Products
SentimenTrader Trading Tools
‍
Backtest Engine
My Trading Toolkit
Correlation Analysis
Seasonality
Market Prediction
Indicators & Data API
‍
Proprietary Indicators & Charts
Market Data API
Strategies & Scanner
‍
50+ Trading Strategies
Smart Stock Scanner
Smart Option Scanner
Research Reports
‍
Research Solutions
Reports Library
Free Resources
Simple Backtest Calculator
Simple Seasonality Calculator
The Kelly Criterion Calculator
Sentiment Geo Map
Public Research Reports
Education
Sentiment Indicators
Technical Indicators
Pricing
Company
About
In the News
Testimonials
Client Success Stories
Contact
Log inLoginSign up
< BACK TO ALL REPORTS

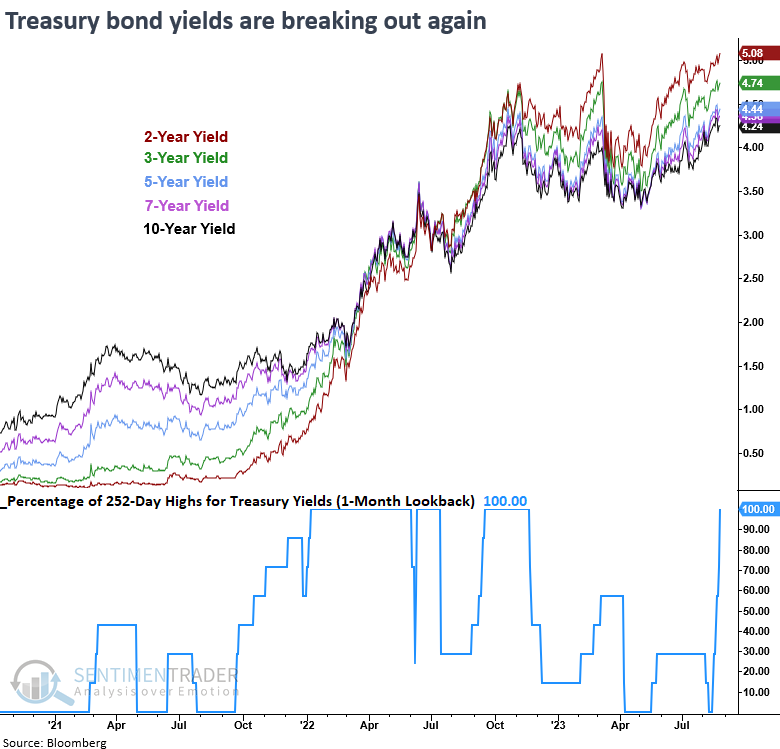
Treasury yields across several time frames closed at new highs

Dean Christians
2023-08-28
Treasury yields, spanning two to ten years, closed at new annual highs over the past month. Comparable breakouts in interest rates previously resulted in further upward momentum in yields, fostering an adverse atmosphere for stocks in the subsequent three months.

Key points:

  • Every single Treasury yield, ranging from two to ten years, closed at an annual high in the last month
  • Similar breakouts led to upside follow-through for rates, especially at the short end of the curve
  • Stocks tend to struggle when yields across the curve break out to annual highs

What's the market message from Treasury yields?

After consolidating for almost nine months below the previous highs, Treasury yields ranging from two to ten years closed at new annual highs. In 2022, the yield curve breakout signal created a significant headwind for stocks, especially for hyper-growth Technology-oriented ones. Will this time be different?

One difference between now and 2022 is that the FOMC is closer to the end of its tightening cycle rather than the beginning. However, should the Fed stay higher for longer, the economy will eventually slow, which is a concern for stock investors. 

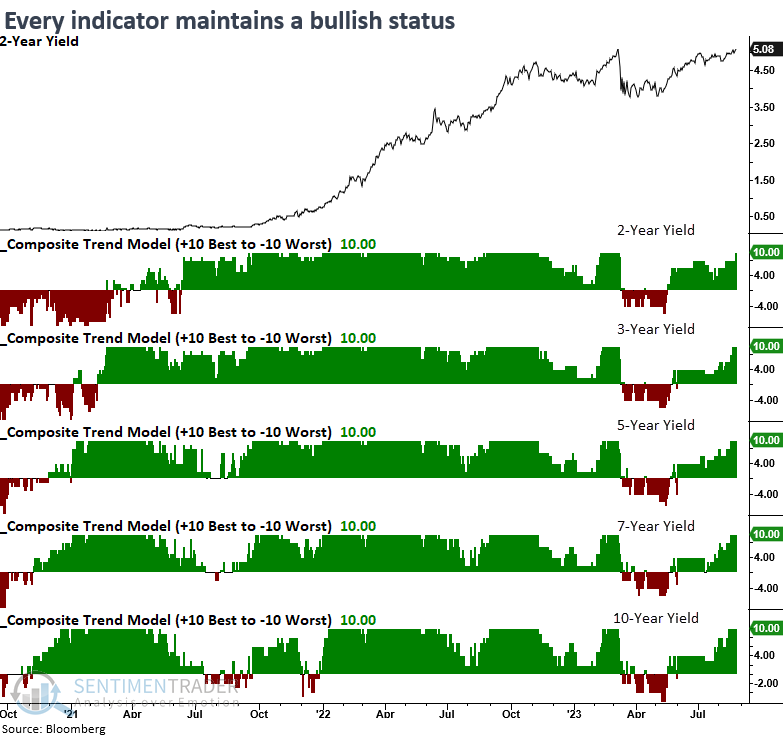
With the two-year yield closing at a new high on Friday, my Composite Trend Model increased to a perfect score of 10, joining the other Treasury yields with every single trend-following indicator in a bullish status.

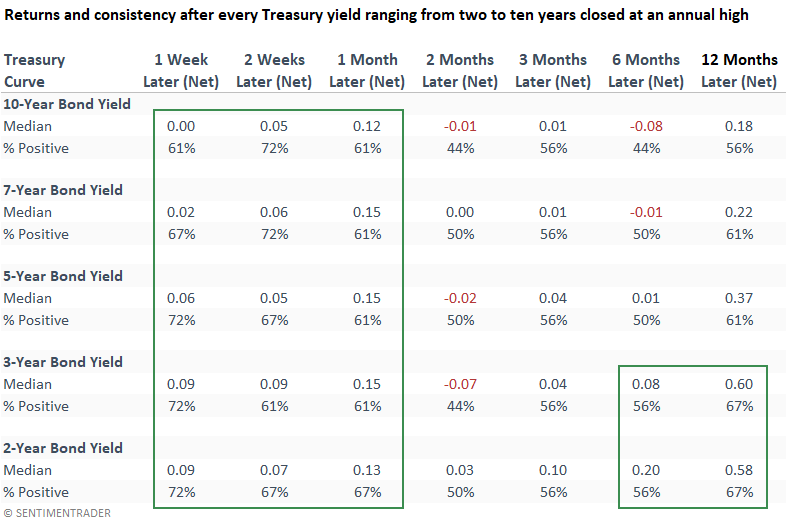
Yield breakouts preceded mostly additional upside follow-through for rates

When every single Treasury yield ranging from two to ten years registers an annual high in the last month, yields across the curve tend to rise further over the next month. 

From six to twelve months later, short-duration yields like the two and three-year are more likely to continue to rally.
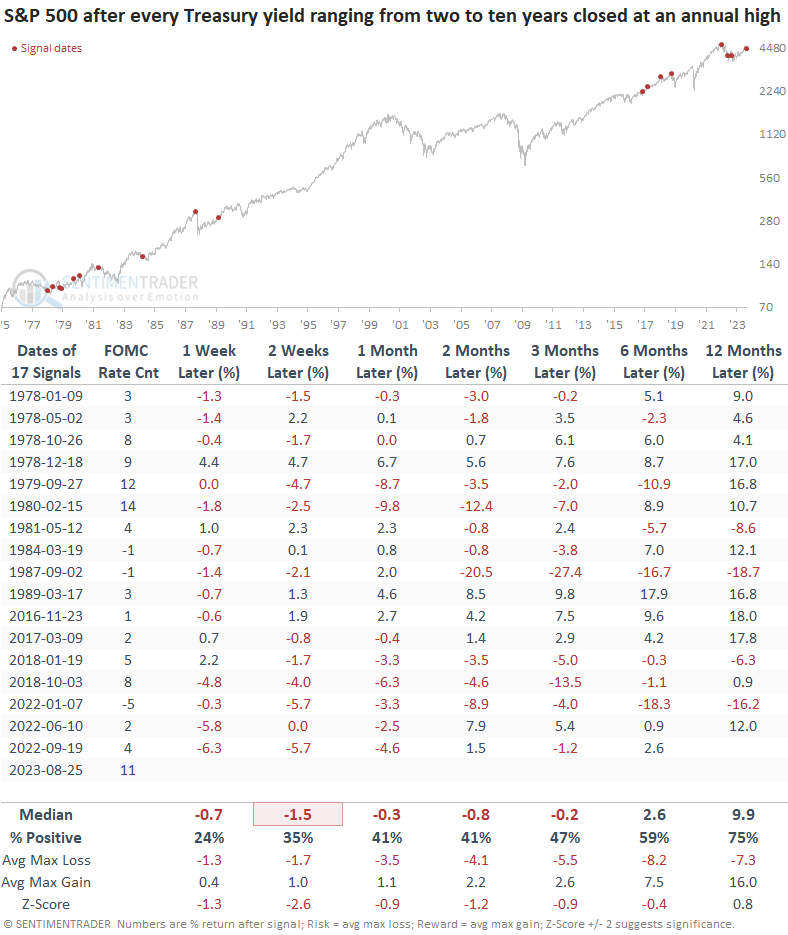
What about stocks?

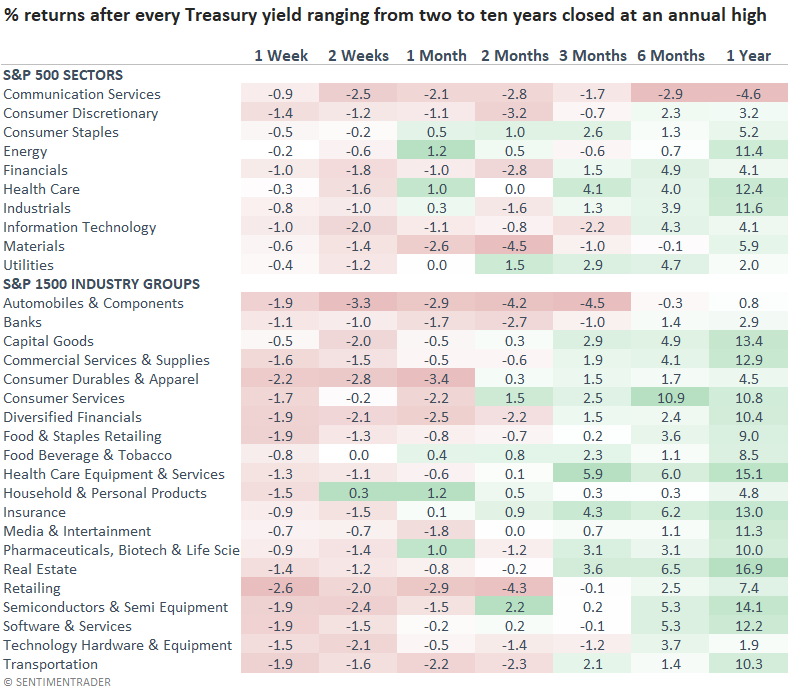
When rates across the curve break out in unison, stocks struggle over short and medium time frames. Over the next three months, the S&P 500 was negative at some point in all but one case.

A significant portion of signals materialized while the FOMC was tightening monetary policy, and these alerts usually occurred in relatively close succession. The late 1970s is a fascinating analog. Despite a bumpy path, the S&P 500 generally rose over the next year before succumbing to the rate pressure in the 1980-82 bear market.

Defensive sectors like Staples, Health Care, and Utilities outperformed in the first three months. As expected, higher rates impacted industries like Autos, Consumer Durables, and Retail. 

In a note last week, Jason published a report on the decade-long breakout in the 10-year yield with a slightly different conclusion.

What the research tells us...

Treasury yields ranging from two to ten years closed at new annual highs after consolidating for almost nine months. After similar breakouts, yields across the curve tend to rise in the near term, with the most significant impact occurring in short-duration bonds like the two and three-year. Stocks struggle over the next three months, with defensive sectors outperforming. With seasonality unfavorable, stocks could be stuck in a range for now. 

PRODUCTS
SentimenTrader
Trading Tools
Indicators & Data API
‍
Strategies & Scanner
‍
Research Reports
FREE
RESOUrCES
Simple Backtest
Calculator
Simple Seasonality
Calculator
The Kelly Criterion
Calculator
Sentiment Geo Map
‍
Public Research Reports
‍
Education
Sentiment Indicators
‍
Technical Indicators
‍
Pricing
Bundle pricing
‍
FAQ
‍
Announcements
‍
COMPANY
‍
About
‍
In the News
‍
Testimonials
‍
Client Success Stories
CONTACT
‍
General Inquiries
‍
Media Inquiries
‍
Financial Professionals Inquiries
‍
© 2026 Sundial Capital Research Inc. All rights reserved.
Setsail Marketing
TermsPrivacyAffiliate Program
Risk Disclosure: The information and tools provided are for research and analytical purposes only and are not intended as investment advice. Market analysis involves uncertainty, and outcomes may differ from expectations. Users should conduct their own due diligence and consider their individual circumstances before making any financial decisions. Past performance is not necessarily indicative of future results.

Hypothetical Performance Disclosure: Hypothetical performance results have many inherent limitations, some of which are described below. No representation is being made that any account will or is likely to achieve profits or losses similar to those shown; in fact, there are frequently sharp differences between hypothetical performance results and the actual results subsequently achieved by any particular trading program. One of the limitations of hypothetical performance results is that they are generally prepared with the benefit of hindsight. In addition, hypothetical trading does not involve financial risk, and no hypothetical trading record can completely account for the impact of financial risk of actual trading. for example, the ability to withstand losses or to adhere to a particular trading program in spite of trading losses are material points which can also adversely affect actual trading results. There are numerous other factors related to the markets in general or to the implementation of any specific trading program which cannot be fully accounted for in the preparation of hypothetical performance results and all which can adversely affect trading results.

Testimonial Disclosure: Testimonials appearing on this website may not be representative of other clients or customers and is not a guarantee of future performance or success.