
TradingEdge Weekly for Sep 9 - Scrambling for protection, failed thrusts, struggling commodities

Key points:
- Institutional traders are scrambling for protection against a market crash at a record pace
- It's hard to blame them since recent breadth thrusts have failed miserably
- The failed thrusts generated oversold signals in many stocks
- One reason for the selling pressure has been tighter financial conditions
- Despite a volatile stock market, consumers' attitudes toward them have improved
- Based on a purchasing managers survey, inflation should recede and stocks should rally
- If stocks do rally, one reasonable strategy is selling naked puts
- Silver hasn't set a new high for over two years, and traders are giving up
- Crude oil just triggered a bearish technical signal
Institutions are scrambling for protection at a record pace
In February 2021, small speculators were going bananas. At the time, we discussed what was perhaps the most remarkable chart that we'd seen in our entire careers.
Until now.
This time, it's not small options traders that have panicked. And it's not FOMO that's causing it. Rather, it's the largest traders in the market, and they're buying protection against a crash at a pace unlike anything the market has ever seen.
Last week, traders of fifty or more contracts bought to open nearly five million put options. More importantly, they spent a whopping $8.1 billion on those contracts. That is almost double the amount of any other week in 22 years.
If we look at the total amount of money institutions spent on bullish strategies (buying calls and selling puts) minus bearish ones (buying puts and selling calls), it's also at a record spread. They spent $1.6 billion more on bearish strategies than bullish ones. The prior records were $1.1 billion during the week of November 7, 2008 (global financial crisis, Obama victory), and $970 million the week of September 30, 2016 (Deutsche Bank crisis).
Another way to look at this is the average premium institutions pay for calls versus puts. Last week, they spent an average of $153 per call option. But they spent a jaw-dropping $1,638 per put option. When we net those out, it once again shows the sudden and record-shattering demand for protection against a crash.
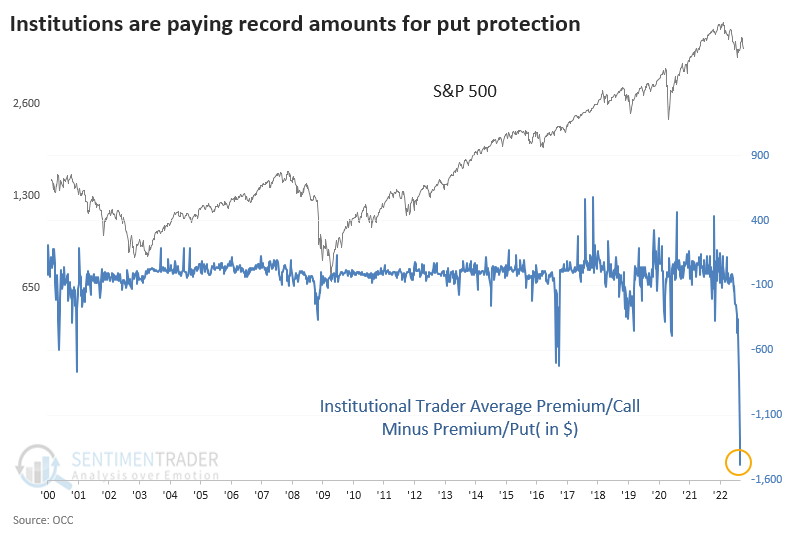
While many investors like to assume that big money = smart money, that is not the case. On an individual basis, sure. But in aggregate, they suffer from the same biases and tendency toward herd mentality that everyone else does. When they pay up for calls, stocks are usually near a peak; when they panic-buy hedges, stocks are usually near a low.
A fair point could be made that they scrambled for protection right before the Lehman bankruptcy in 2008 and enjoyed windfall profits. Okay, noted. Though we also have to note that they spent even more on puts into October and November and potentially suffered losses as stocks jumped more than 20% into January 2009. And their other forays into massive put buying didn't seem to work out too well, either.
It's not just the options market that is showing heavy bearish bets. Large speculators in S&P 500 e-mini futures have established their largest short position in a decade. As a percentage of open interest, it's among the largest ever.
Protection seems wise when bullish setups fail
Three weeks ago, buyers were so interested in owning stocks that they bought pretty much all of them.
Within the S&P 500, more than 90% of stocks traded above their 50-day moving averages, after fewer than 5% of them did in June. When a similar thrust occurred in the spring of 2020, buyers continued to push the index higher over the next few weeks. This time, it has been an almost immediate failure.
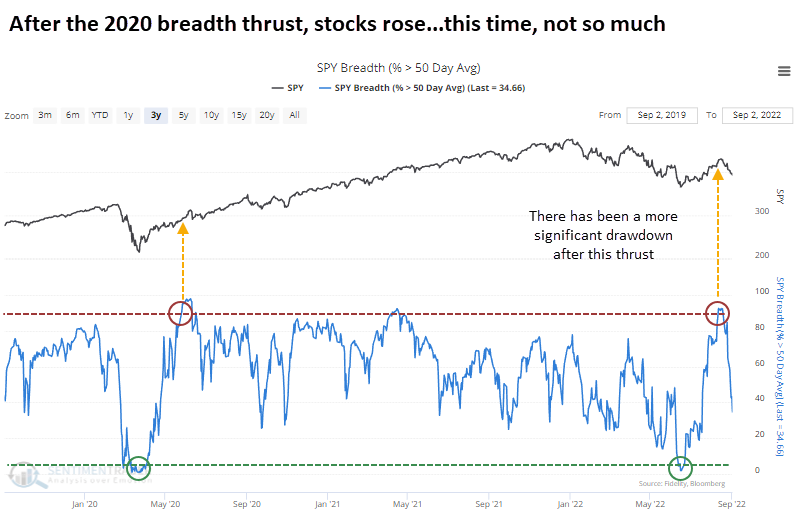
The thrust was triggered on August 12. In the three weeks since then, the S&P index fell as much as -8.3%. This is the worst three-week reaction in the history of breadth thrusts.
The table below shows the worst three-week reactions to similar breadth thrusts since 1928. Curiously, only one signal, in 1940, showed persistent losses in the months ahead. After the others, the S&P 500 rebounded, and its gains were usually significant.
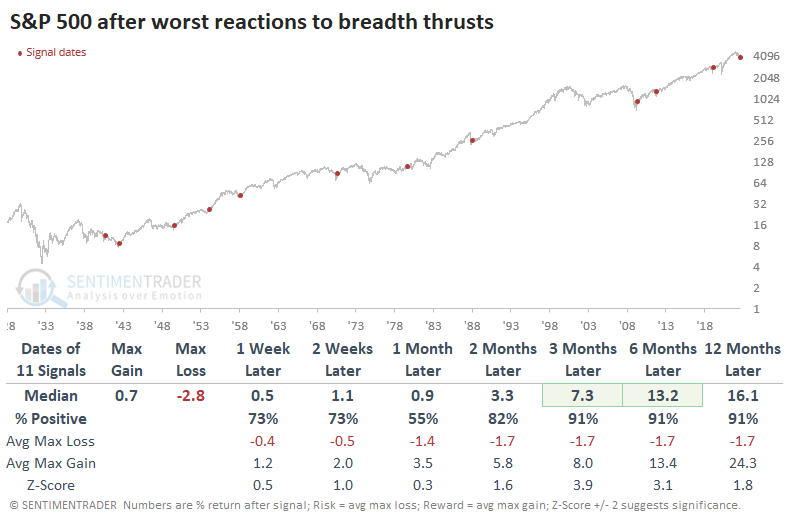
The Risk/Reward Table shows that within the next three months, only two signals suffered a drawdown of more than -5%. All but one of them enjoyed a gain of more than +5% within that time frame.
The failed thrust does not seem to be something to worry about just yet.
The failed setups generated oversold conditions
The Stochastic Oscillator (Stochastic for short), created by George Lane, is a popular technical indicator found in most charting applications.
Dean noted that with stock indexes retracing a significant portion of the recent rally, most stocks are now showing an oversold condition based on the 14-day Stochastic. Last week, the number of oversold stocks (14-day Stochastic < 20) in the S&P 500 exceeded 73%.
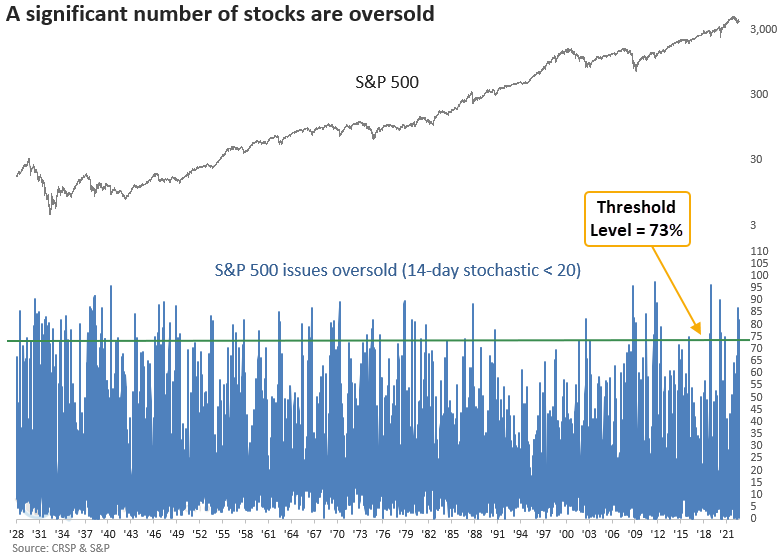
The Stochastic Oscillator model generated a signal 91 other times over the last 95 years. Returns had an upward bias, with the three-month time frame showing the best win rate and z-score. The previous signal from June closed out the 5th best two-month return in history.
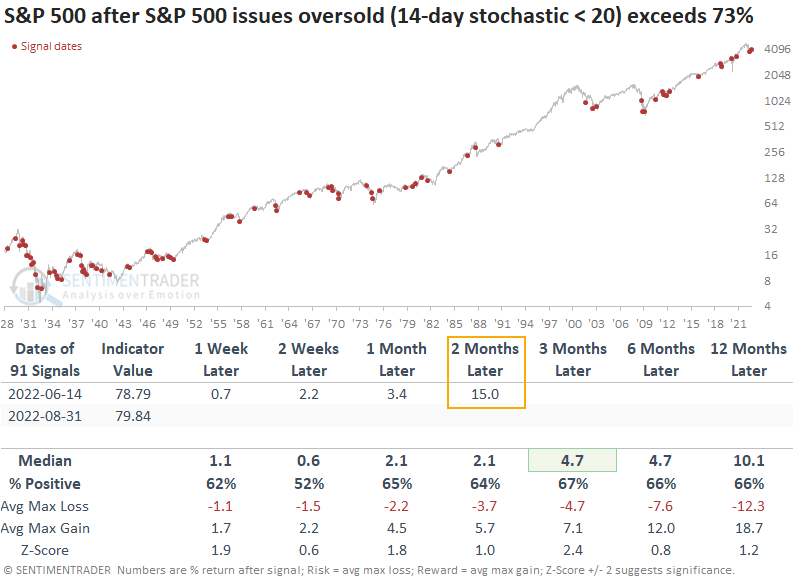
Context is important, and currently, the S&P 500 is mired in a long-term downtrend. Its 200-day average has declined for at least 90 consecutive days.
If we add that condition to the study, it identified 26 other instances. Once again, returns show an upward bias, with the best win rate and z-score coming a month later. The two and three-month windows suggest a potential retracement after the initial bounce. Results were excellent a year later post the 1929-32 bear market.
One reason for the selling - tighter financial conditions
Financial conditions are getting tighter, but stocks haven't totally collapsed.
Dean showed that the Goldman Sachs financial condition index closed at a new 252-day on Tuesday. At the same time that financial conditions broke out to a new high, the S&P 500 remained more than 6% above its June low. Typically, financial conditions and the S&P 500 move in opposite directions - when conditions tighten, the S&P 500 declines and vice versa.
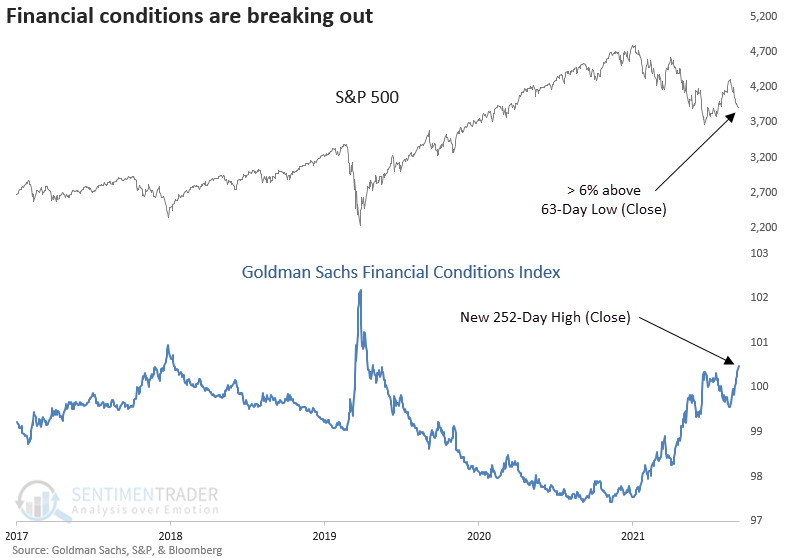
A breakout in financial conditions as the S&P 500 hovers above a low doesn't bode well for the market across most time frames.
The S&P showed a negative return at some point in the first six months in all but one instance. After 12 out of 16 signals, the S&P closed at a new 63-day low before it hit a new 252-day high.
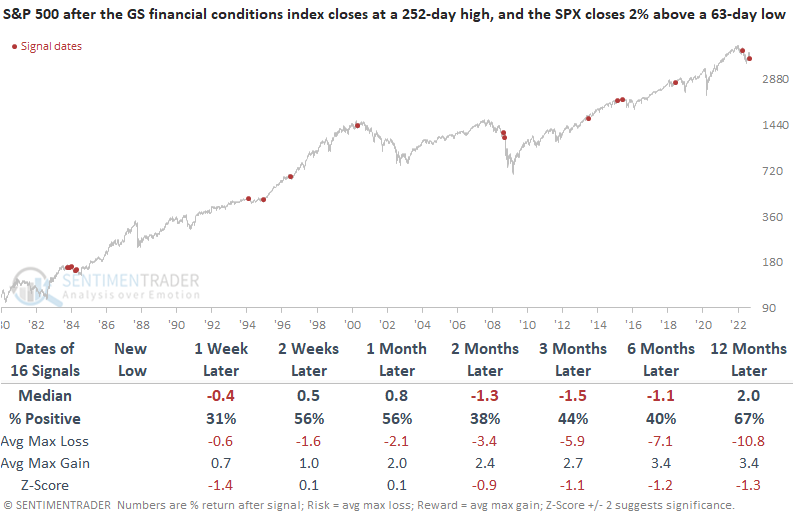
Bulls should want to see financial conditions get looser in the weeks ahead to have more confidence in stocks.
Consumers' attitude toward stocks is finally starting to improve
Consumers are finally starting to warm up to the stock market.
Jay showed that in the Conference Board's survey of consumers, the net percentage of consumers expecting stocks to increase versus decrease rebounded from the worst level in a decade.
The chart below displays those times when this spread crossed above -13.3%, and the table shows S&P 500 performance following those signals. While past performance doesn't guarantee future results, the S&P showed a positive return every time across every time frame. The latest signal was triggered at the end of August.
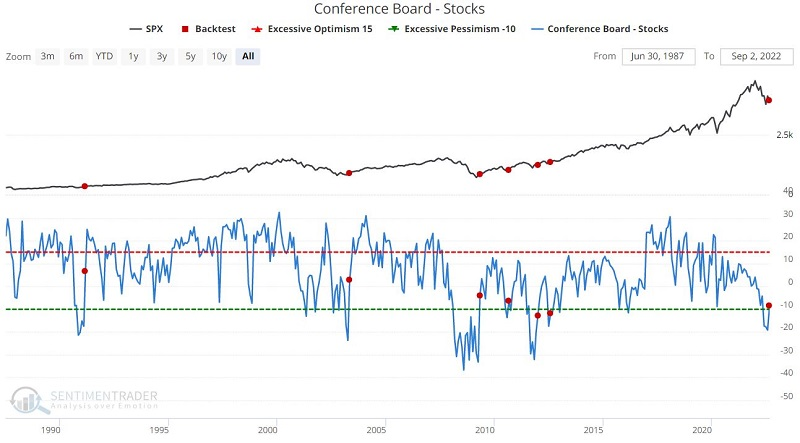
The results were even more robust when we look at the Nasdaq 100 (NDX) instead of the S&P 500.
While the net percentage of bulls minus bears finally turned higher last month, a long-term average of the percentage of bulls has drifted to a historically low level. Again, after similar behavior, the S&P 500 showed positive returns in the months ahead, and the Nasdaq 100 enjoyed even more robust returns.
They should feel even better as inflation comes down
Dean showed that purchasing executives are reporting sharply lower prices for goods, and that bodes well for markets.
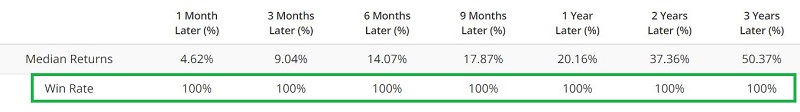
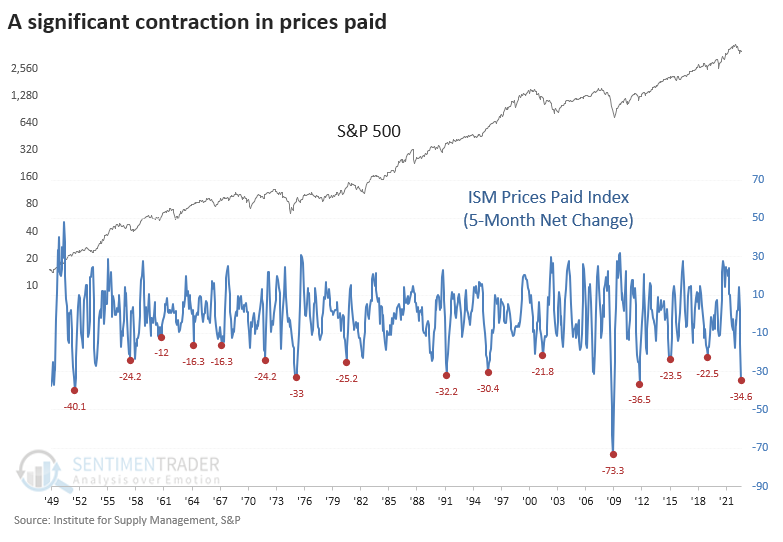
The Institute for Supply Management released the latest manufacturing data last week. While the overall survey has fallen in the previous few months, the prices paid index has fallen off a cliff. The index has declined by over 34% in five months, the fifth largest contraction in history.
A sharp drop in the ISM prices paid index was bullish for stocks, especially on a medium to long-term basis. A year later, the S&P 500 was higher 100% of the time.
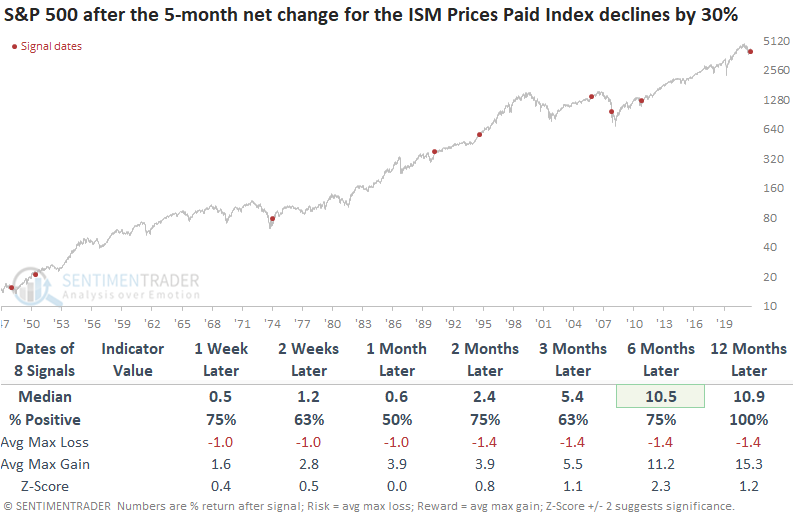
Commodities tend to suffer after a significant contraction in the ISM prices paid index, especially over the next one to three months. Bond yields were lower in every instance three months later, even in 1975, which occurred in a high-inflation environment.
These signals also preceded a drop in the year-over-year change in the CPY during the next 6-12 months after 6 of the 8 signals. The other two took longer to see a decline but ultimately did.
If stocks rally, selling puts on volatile stocks should work
Some traders sell naked put options to accumulate a stock; most consider this to be a conservative strategy. Jay noted that this strategy can lead to well above-average returns but with heightened risks. It can benefit investors sitting on uninvested cash and unsure about when to get back into stocks.
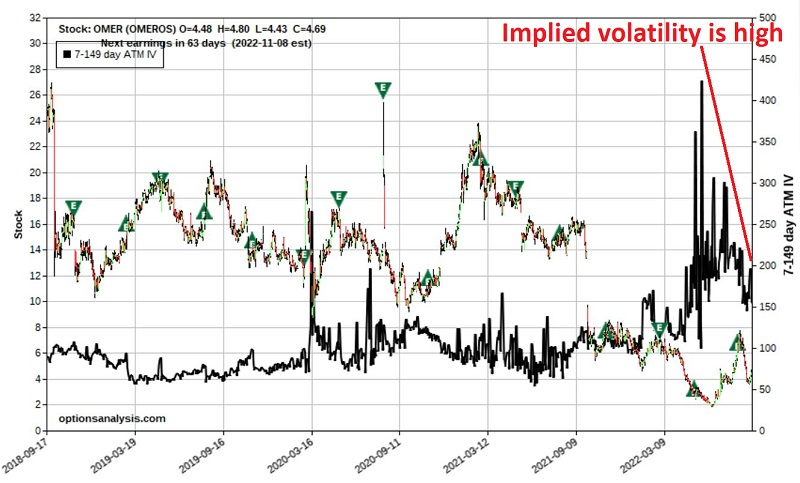
Omeros (OMER) is a small, volatile, risky biotech stock. The stock traded in a wide range between $8 and $28 a share before collapsing to $1.85 and rebounding to $4.69. This is a volatile and unpredictable stock.
Let's ask a specific question: Will this stock stay above $1.65 between now and 2022-11-18? In other words, we will look at a trade that will show a profit as long as OMER does not decline over -62% in the next 78 calendar days. This offers a much higher probability of profit than simply buying shares of the stock.
Selling options is best done when implied volatility is relatively high - which indicates an above-average amount of time premium built into the option prices for that stock. The chart below displays a bar chart for OMER with implied volatility overlaid (black line).
Our example trade uses the strategy known as selling a naked put, as follows:
- Sell 15 OMER Nov18 2022 2 puts @ $0.35
There is a lot to digest here.
The trading volume for this option on 2022-09-06 was "20." So, this is clearly a thinly traded option. Low trading volume typically results in a wide bid/ask spread, which is undoubtedly the case here.
The bid is $0.25, and the ask is $0.45. On a percentage basis, this is a huge spread and a deal-breaker for many traders. But we will push the edge of the envelope here a bit.
For this example, we will assume a fill at the bid/ask midpoint of $0.35. At $0.35, the implied volatility is 206%, which, as we saw in an earlier chart, is at the high end of the historical range. When selling naked puts, the more premium you take in, the better.
A few things to note:
- Selling 15 puts @ $0.35 apiece means we generate a credit of $525 (the option buyer pays us $525, which is added to our trading account)
- As long as OMER stays above $2.00 a share until November options expiration, we will keep the entire $525
- To enter this trade, we need to have enough cash on hand to buy 1,500 shares of OMER stock at $2 a share, or $3,000
- However, the $525 we received in premium for selling the puts can count towards this amount, so we only need to put up $2,475
Jay went on to further discuss this position and how a reasonably conservative trader can manage the risk of a naked option position.
Silver hasn't been so shiny
For silver bulls, the last two years have been anything but sterling. That metal hasn't set a 252-day high for over two years, among the longest streaks in 50 years.
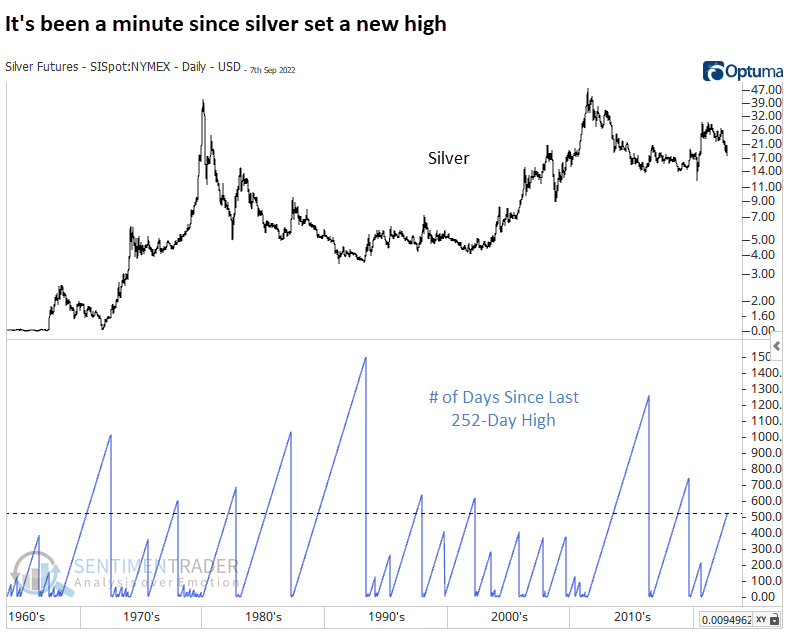
By the time it reached this long, silver had a modest tendency to keep falling over the next 1-2 months before rebounding.
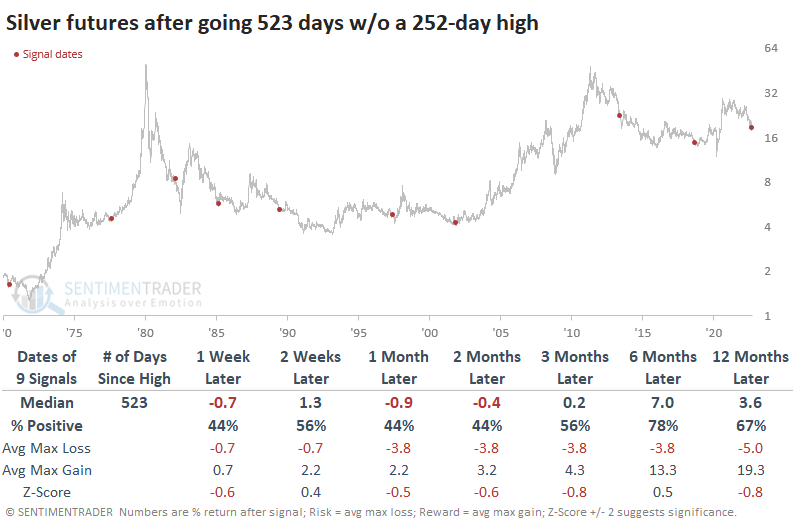
Traders aren't waiting around. Large speculators in silver futures hold more than 8,200 contracts net short, more than 5% of open interest. The Backtest Engine shows that after other weeks when specs held more than 5% of contracts short, silver rallied more than 70% of the time across all time frames. A big caveat is that this was not very robust. If we relax the parameters to lesser extremes, silver's returns diminish significantly.
Bets against the metal pushed the Optimism Index (Optix) over the past 50 days to one of the lowest levels in 20 years. The Backtest Engine shows that the metal tends to rebound over the shorter term when the Optix has gotten this low.
Shorter-term traders who use ETFs are fleeing, too. Over the past 50 days, the SLV fund has suffered an outflow of more than $28 million per day, the 3rd-worst exodus since inception.
One bugaboo for bulls is seasonality. Silver has tended to peak right about now and decline into the fall season. It has not followed its typical seasonal pattern too closely this year, so it's probably worth taking this with a grain of salt.
Crude oil has been performing terribly, too
Like silver, crude oil has been getting hit hard.
For the first time in more than two years, oil suffered a "death cross," or a bearish crossover of its 50-day moving average beneath its 200-day moving average. This ended its 2nd-longest streak with a bullish configuration.
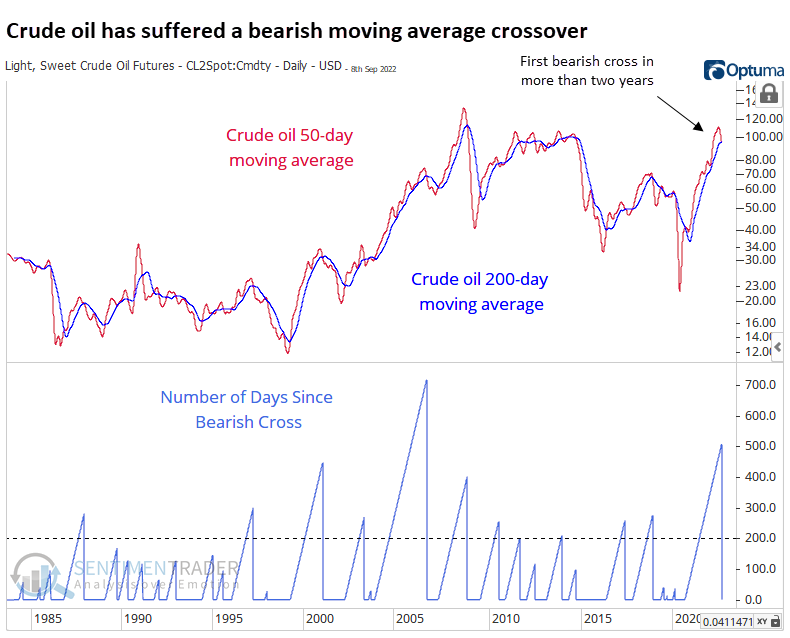
After a long time without one, these bearish crosses tended to lead to more losses in the weeks and months ahead.
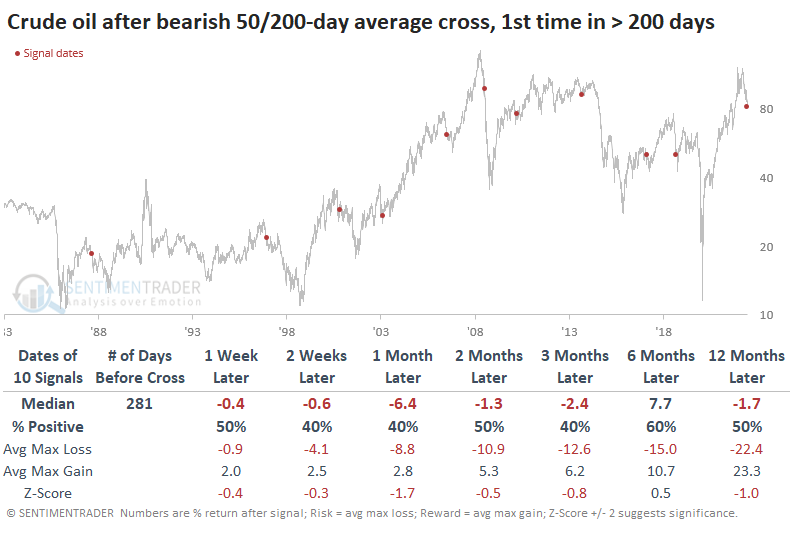
It's not shown in the table, but the worst returns were over the next 30 days when oil showed a gain only two out of the ten times.
About TradingEdge Weekly...
The goal of TradingEdge Weekly is to summarize the research published to SentimenTrader over the past week. Sometimes there is a lot to digest and this summary is meant to highlight the highest conviction or most compelling ideas we discussed. This is NOT the full research that's published, rather it pulls out some of the most relevant parts. It includes links to the published research for convenience; if you don't subscribe to those products it will present the options for access.