
TradingEdge Weekly for Sep 6 - Defensive leaders, global uptrends, "inevitable" bond rally

Key points:
- Defensive sectors are taking leadership positions
- Every major developed market is in a medium-term uptrend in the context of a protracted bull market
- The correlation between value and growth stocks has almost never been smaller
- A relative strength system has shifted from growth to value
- Tech stocks have often had a tough September
- About that "inevitable" bond rally...
- Platinum is facing a tough seasonal window
- Copper and natural gas are heading into opposite seasonal tendencies
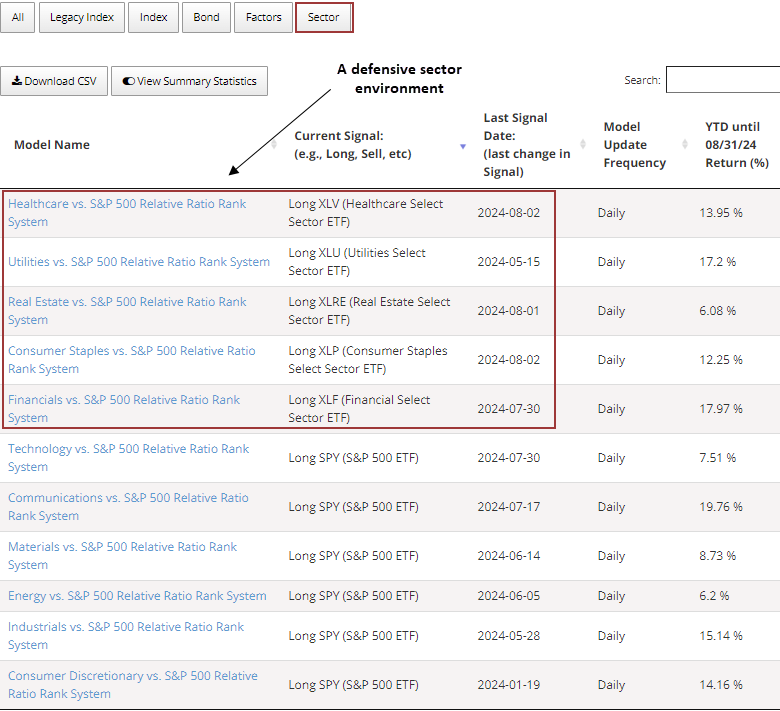
Defensive sectors are 4 for 4
Consumer Staples, Healthcare, Real Estate, and Utilities are exhibiting positive relative trend scores. Dean showed that similar relative trend profiles for defensive sectors suggest stock indexes could stall over the next month.
With stocks losing momentum in recent weeks after a strong rally, relative trend scores for defensive sectors have risen, resulting in Consumer Staples and Healthcare joining Real Estate and Utilities in the positive category. For the first time since December 2021, their relative trend composites displayed a positive score in unison.
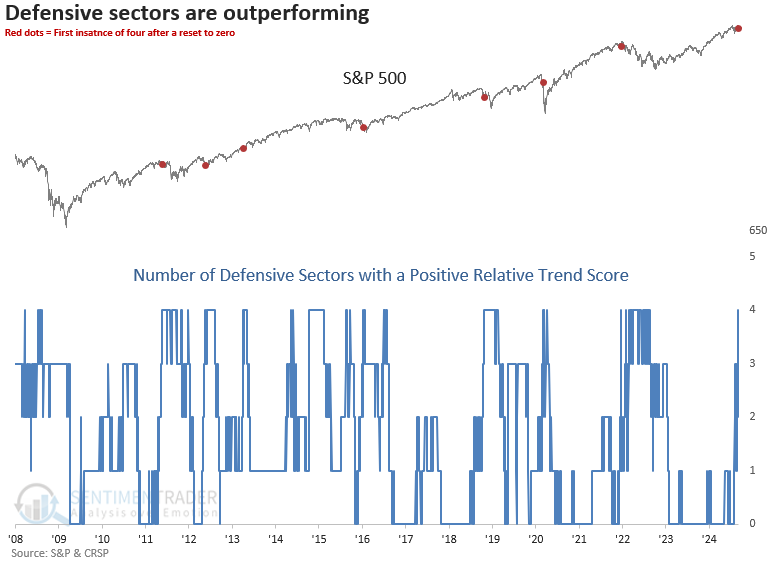
Typically, when all four defensive-oriented groups showed a positive relative trend score, the S&P 500 had already entered a correction, as reflected in the percentage below the 5-year high column in the outlook table. During this phase, the world's most benchmarked index often remained flat over the following month. However, after this consolidation period, the index rebounded over medium and long-term periods, exhibiting significance in several horizons.
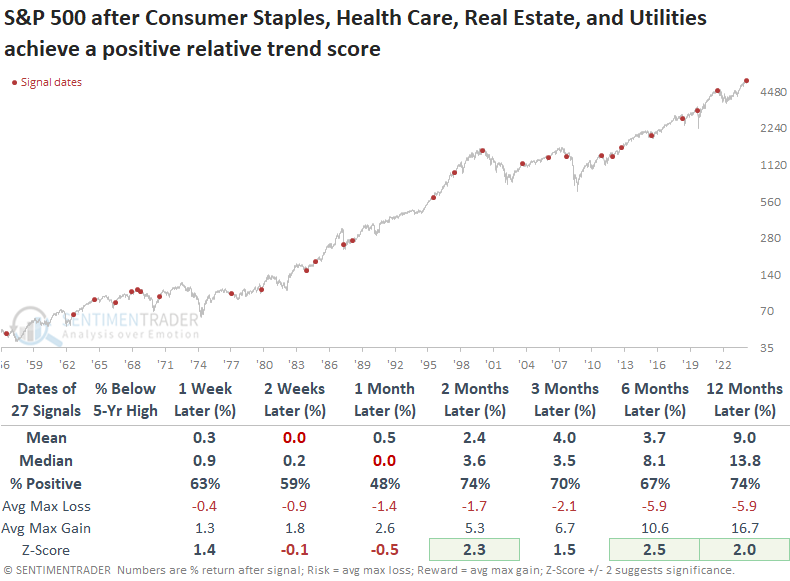
When the S&P 500 closed within 5% of a 5-year high at the time, it still tended to consolidate over the subsequent month and then rally over medium and long-term time frames.
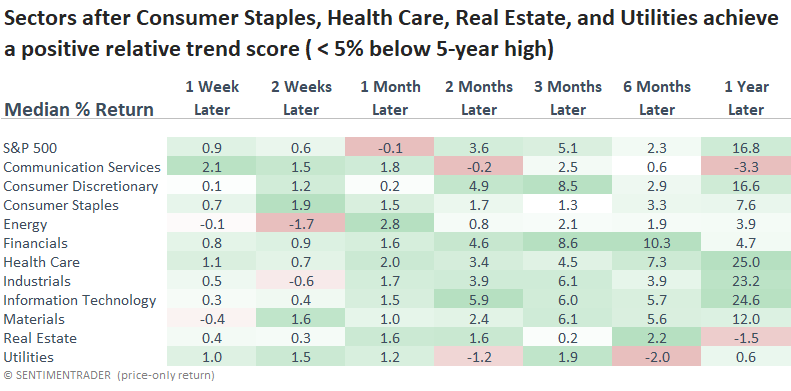
Over the following month, all four defensive sectors outpaced the S&P 500. Furthermore, Healthcare extended its strong performance, delivering the highest annual return among all sectors.
Strong trends in developed markets
Traders returned from vacation with a crabby disposition. Anyone who's been around for a while will know this is not unusual.
Just before they hit the sell buttons, conditions looked pretty good, not just in the U.S. Among nearly two dozen (mostly) developed markets, every single one was in a medium-term uptrend within long-term uptrends. The last time that happened was nearly four years ago.
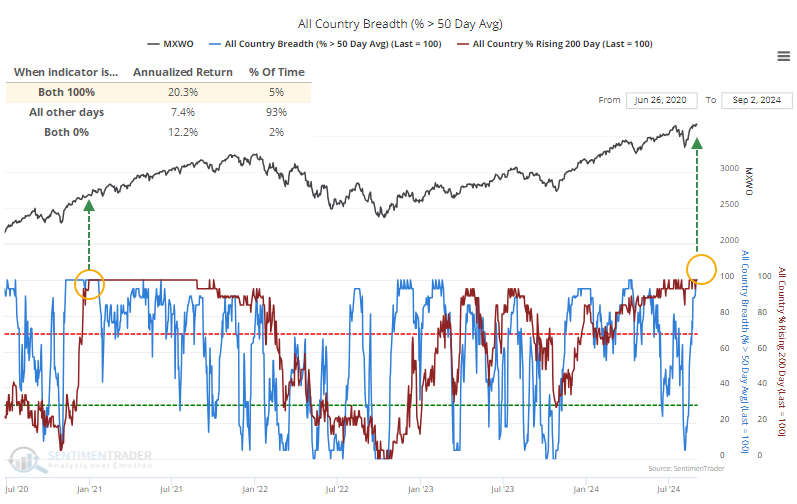
The chart above shows that when both indicators are at 100%, developed markets returned an annualized +20.3% (high positive momentum) and +12.2% when both were at 0% (deeply oversold), versus only +7.4% during the mushy middle days.
While these trends are specifically not focused on the United States, it's worth noting that returns in the S&P 500 after these conditions were met were exquisite. From two to twelve months later, the S&P showed only a single loss across any time frame.
If we broaden our horizons and look at the MSCI Developed Markets Index, which includes the U.S., we can see that returns were still extremely strong. There were no losses of note across any time frame for any signal.
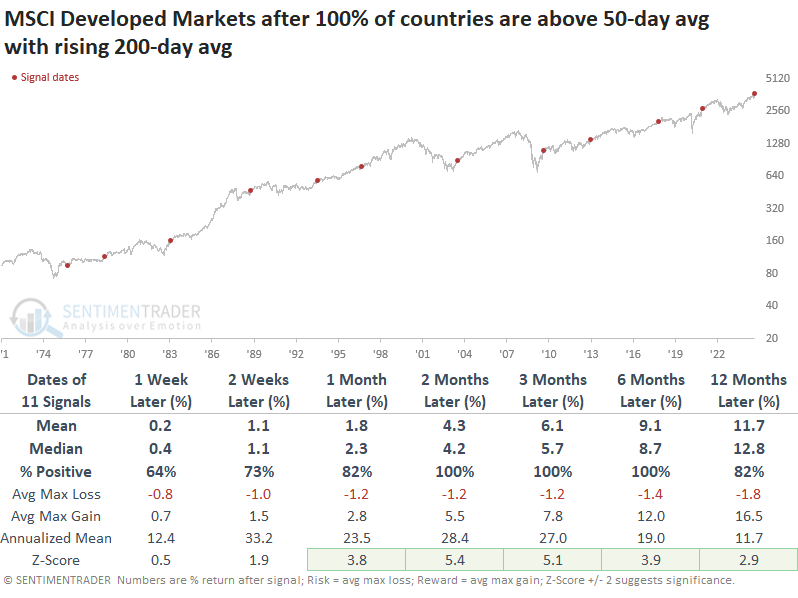
The risk/reward for this index was superior to that for the S&P 500. Up to a year later, the maximum drawdown across all signals was only -5.3%, and the median was only -1.9%.
The sample size contracts if we exclude the U.S. from the indexes since the ex-U.S. index only dates back to 1988, eliminating three signals. Still, returns were excellent, especially during the medium term. Returns were still excellent if we look at all markets, including both developed and emerging countries. Across all time frames for all signals, there were no losses larger than -1.7%
Factor friction
It's no secret that the stock market has been disjointed this year.
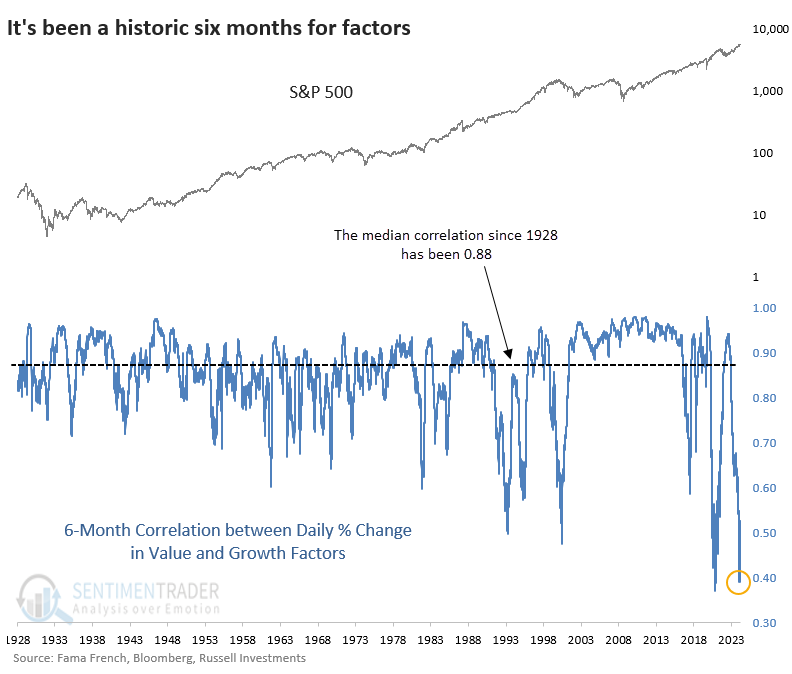
Almost daily, either value or growth stocks would rise while the other fell. That has preceded one of the lowest correlations over six months in nearly 100 years. The only time since 1928 when the correlation was lower was May 2021.
The table below shows each time since 1928 when the correlation between value and growth stocks bottomed below 0.7. To make it more realistic for real-time analysis, the table shows every time the correlation dropped below 0.7 and didn't make a lower low for one month. That's where we are now.
Some of those did end up being the low for the cycle, but often did not; the correlation turned around and went to a lower low. Overall, it did not lead to dramatic trouble, except for one-year returns over the past 25 years.
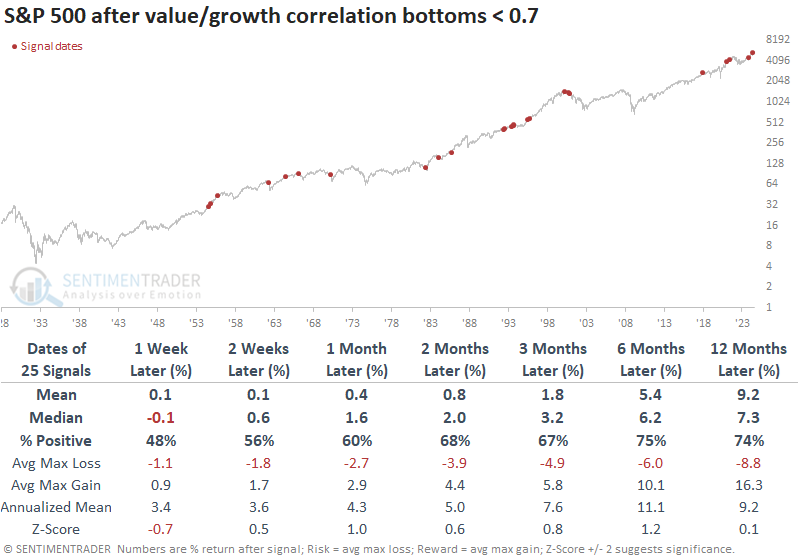
These were decent signals for value stocks. The median return over the next year was +14.4%, nearly double the S&P 500's median return, with lower risk and higher reward.
Growth stocks tended to rise less often over the medium- to long-term, and their average return was about half that of value stocks. In the short run, however, growth stocks tended to benefit more than value. The switch occurred at around the three-month mark.
A shift to value
A trading strategy that utilizes relative strength shifted from large-cap growth to large-cap value.
Dean noted that at the close of trading on Tuesday, a strategy that uses relative strength to rotate between large-cap growth and value shifted in favor of value. At the same time, strategies for the Nasdaq 100 ETF (QQQ) and the Nasdaq Composite ETF (ONEQ) issued sell signals and now hold the S&P 500 ETF (SPY).
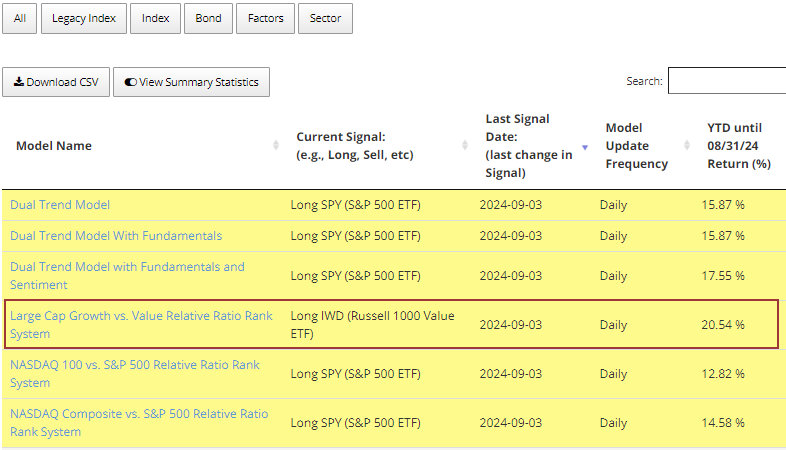
The system applies an 84-day range rank to the ratio between the iShares Russell 1000 Growth ETF (IWF) and the iShares Russell 1000 Value ETF (IWD). When the range rank rises above the 97th percentile, the system initiates a position in growth. Conversely, when the range rank falls below the 6th percentile, it rotates to value.
Since ETFs are a relatively new product with limited historical data, I used index data starting in the 1950s to test for the optimal range rank durations and signal thresholds for all relative ratio timing systems on the website.
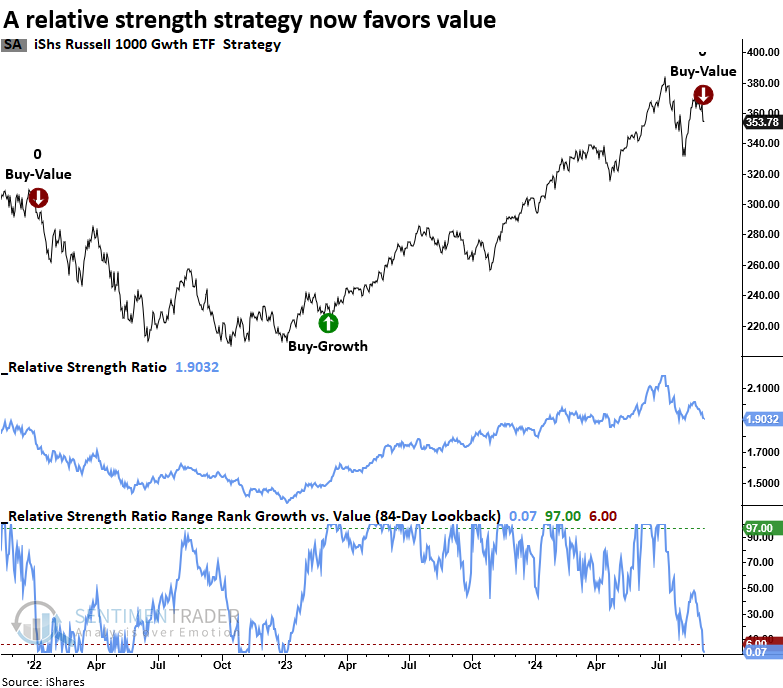
While the strategy is based on a simple concept that uses a medium-duration lookback period, it has proven highly effective, delivering a compound annual growth rate (CAGR) of 11.45%, outperforming the S&P 500 ETF's benchmark return of 8.5%. As of the end of August, the strategy was ahead of the S&P 500 by nearly 2%. If it maintains this lead through year-end, 2024 will represent its 10th consecutive year of outperforming the benchmark.
The relative strength timing systems available on the website are positioned in defensive groups. Should the defensive sectors reverse to sell signals, a concern hanging over the market likely has been alleviated.
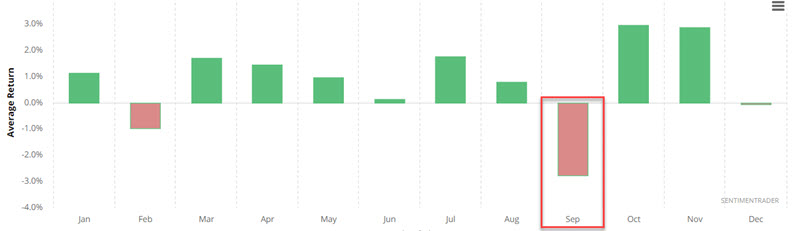
Potential time for tech trouble
Seasonality is simply an average of what has happened in the past. That said, Jay noted that the technology sector is entering a period that demand investors attention.
Undisputedly, technology has been the place to be for performance. But the chart below displays the average monthly performance for ticker XLK since it started trading in 1998. The key thing to note is that September has been XLK's worst performing month (February is the only other month to show an average loss).
An unfavorable period extends from Trading Day of Year (TDY) # 170 through TDY #185. For 2024, that period extends from the close on 2024-09-04 through 2024-09-24. The chart below displays the hypothetical growth of $1 invested in XLK only during this period since 1999.
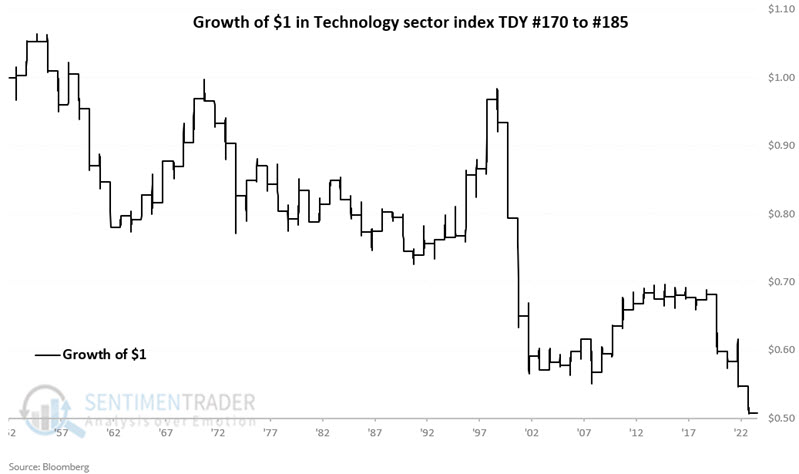
It should be noted that XLK showed a gain 46% of the time during these windows. So, no assumption should be made that XLK is automatically doomed to decline in the weeks ahead.
The "inevitable" bond rally
The one seemingly sure thing now is that the Fed will soon cut rates, interest rates are destined to fall, and bond prices are sure to rally. But Jay showed several indicators and models that are not bullish for long-term treasury bonds.
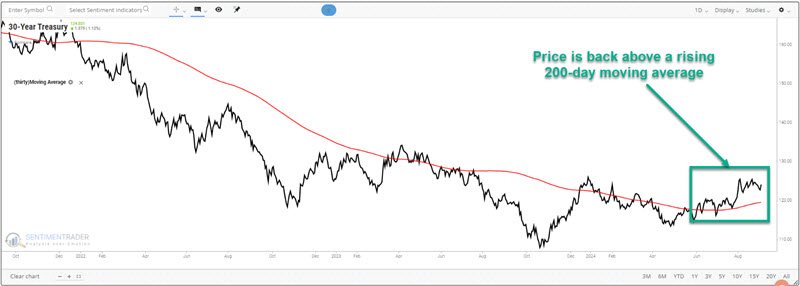
On a technical basis, a bullish case can be made. The daily chart below shows that THIRTY is back above a rising 200-day moving average. As long as it remains the case, it does make sense to give the bullish case the benefit of the doubt.
There is a tendency for yields to move in very long-term waves. Jay showed a cycle that bottomed out in 2010 and projects a generally rising rate environment until 2040. This cycle is by no means exact, but if it tells us anything, it is that interest rates may be more stubborn to sharp declines than most investors currently think.
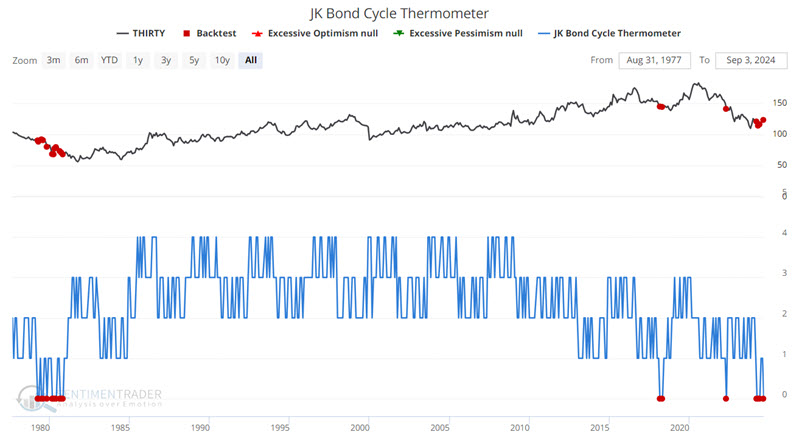
In a series of articles earlier this year, Jay introduced the JK Bond Cycle Thermometer and JK Bond Cycle Model. These models are based on very long-term cycles in interest rate trends. The chart below displays the monthly action for the JK Bond Cycle Thermometer, which can range from zero to +4. The model is presently at a reading of zero, which has consistently preceded negative returns in 30-year bond futures prices.
The same goes for the JK Bond Cycle Model. This model ranges from 0 (bearish for bond prices) to +1 (bullish for bond prices) and is currently at a zero reading, which again, has preceded negative bond prices with consistency.
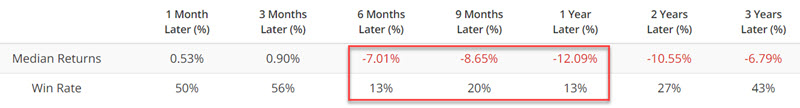
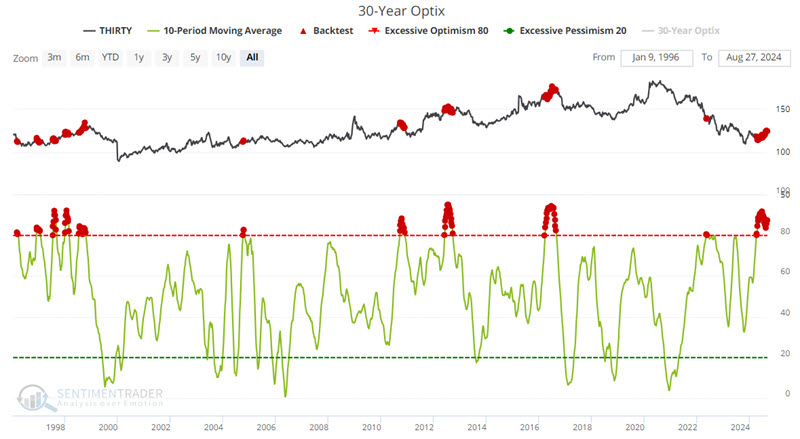
Sentiment on bonds has also risen to a high level. The chart below highlights with a red dot those weeks when the 10-week moving average of our 30-Year Optix indicator was above 80%.
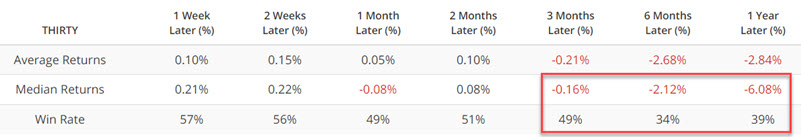
A history of subpar Win Rates (higher one year later only 39% of the time) does not guarantee a bond bear market in the year ahead. Still, this history stands in stark contrast to conventional wisdom.
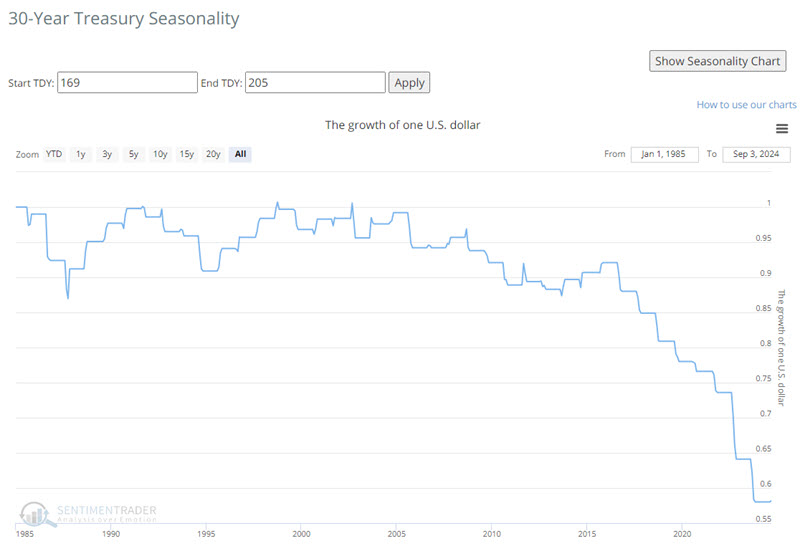
Seasonally, bonds have entered one of the more unfavorable seasonal periods of the year. The chart below displays hypothetical growth of $1 invested in 30-year bonds only during an upcoming 36-day window. The results suggest early September has generally not been the time to load up on long-term treasuries.
Lastly, Jay showed bond returns following a Copper/Gold Ratio below 0.17. This does not happen often, but just eyeballing the chart suggests that this has tended to occur as bond rallies were nearing a top.
Platinum problems
Jay noted that the precious metal platinum is entering a period of often serious seasonal price weakness.
The chart below displays the annual seasonal trend for ticker platinum futures.
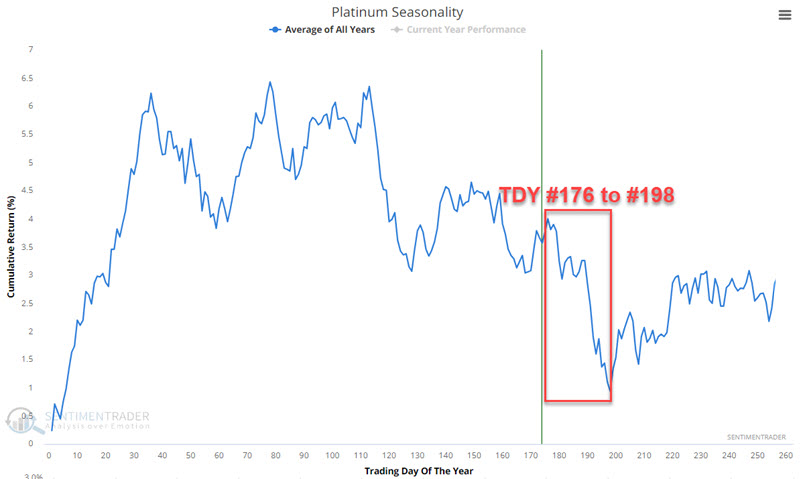
Note that an unfavorable period extends from Trading Day of Year (TDY) # 176 through TDY #198. For 2024, that period extends from the close on 2024-09-04 through 2024-10-04. The chart below displays the hypothetical cumulative $ +(-) achieved by holding a long position in platinum futures only during this period since 1987.
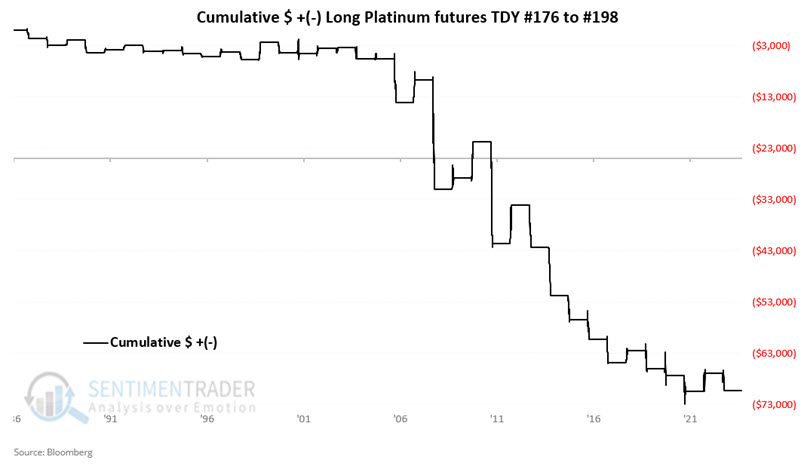
The metal lost ground 62% of years during these windows, with average and median losses skewing heavily to the downside, and five losses of -$8K or more versus zero winners of +8K.
Copper and gas
Jay further showed that two of the world's most important commodities (copper and natural gas) are entering periods that demand investor's attention - one in a favorable way, one in the opposite
The chart below displays the annual seasonal trend for copper.
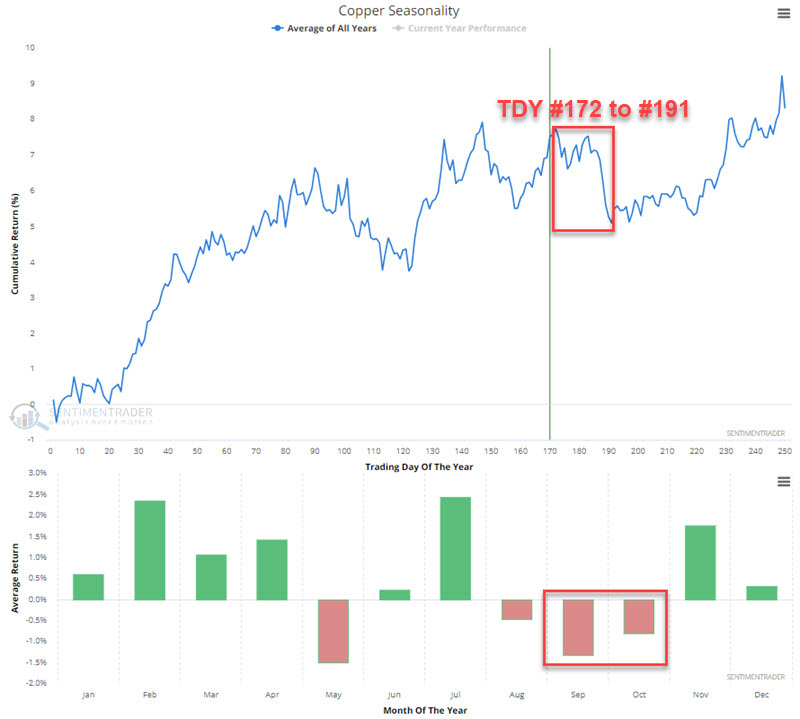
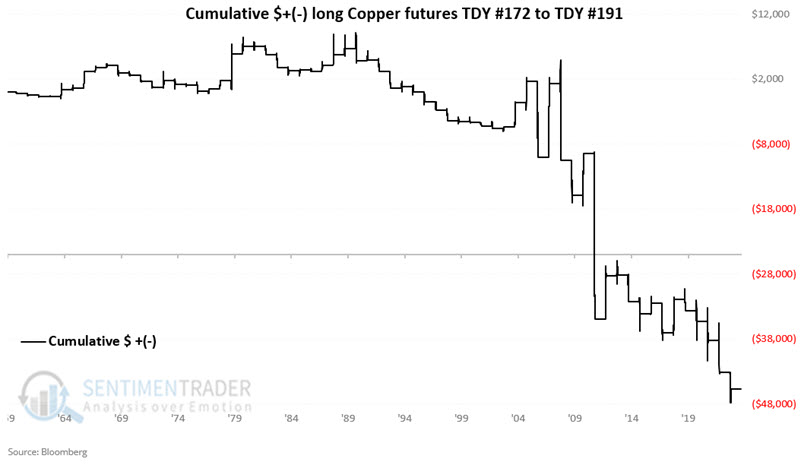
Note that an unfavorable period extends from Trading Day of Year (TDY) # 172 through TDY #191. For 2024, that period extends from the close on 2024-09-03 through 2024-09-30. The chart below displays the hypothetical cumulative $ +(-) achieved by holding a long position in copper futures only during these windows since 1959.
Whereas copper has historically skewed negatively during the early fall, natural gas has tended to do the opposite. A favorable period extends from Trading Day of Year (TDY) # 172 through TDY #198. For 2024, that period extends through the close on 2024-10-04.
The chart below displays the hypothetical cumulative $ +(-) achieved by holding a long position in natural gas futures only during the TDY #172 to #198 period since 1990.
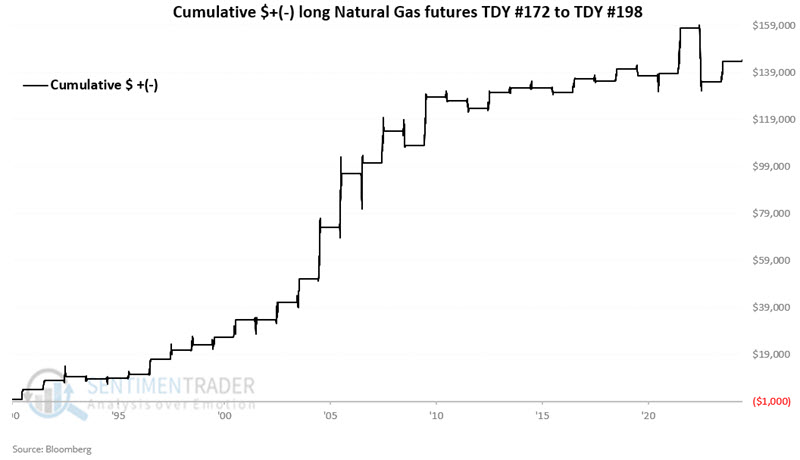
The chart above shows that as natural gas prices have been much lower in recent years, the favorable nature of the early fall season has leveled off to some degree. For the moment, the combination of favorable seasonality and a favorable price trend may offer an opportunity. Note also that the sharp plunge in 2022 reminds us that the purported reliability of any seasonal trend never relieves a trader of the responsibility to manage each trade and to consider potential stop-loss actions.
About TradingEdge Weekly...
The goal of TradingEdge Weekly is to summarize some of the research published to SentimenTrader over the past week. Sometimes there is a lot to digest, and this summary highlights the highest conviction or most compelling ideas we discussed. This is NOT the published research; rather, it pulls out some of the most relevant parts. It includes links to the published research for convenience, and if you don't subscribe to those products, it will present the options for access.