
TradingEdge Weekly for Sep 22 - Seasonal softness, participation problems, oil optimism

Key points:
- Using options on a volatility product for a bet on seasonal trends
- Financial conditions signal risk-off behavior
- The S&P is levitating above its long-term average but fewer stocks are following
- Among big technology stocks, new 52-week lows are rising
- Smaller stocks have slid to another multi-decade low relative to larger stocks
- Semi stocks fell to a 2-month low for the first time in nearly a year
- Another surge in Japanese stocks
- The Canadian dollar is facing seasonal weakness and poor sentiment
- Crude oil term structure gives a warning for energy contracts
- Oil is overbought for the first time in over a year
- Investors are sweet on sugar
An options trade for seasonal follow-through
The VIX Index has declined to the low end of its historical range. Jay noted that volatility has a tendency to rise - and the stock market to fall - during the late September into mid-October period. Options offer a relatively inexpensive way to hedge against such an occurrence.
The VIX Index measures the implied volatility for options on the S&P 500 Index. Ticker VXX is an ETN (Exchange-traded note) that purports to track the action of VIX futures. In reality, it does a poor job of tracking the VIX Index. Due to the vagaries of futures pricing, VXX perpetually trends lower - with occasional bursts higher when the VIX Index spikes.
One other potential factor at the moment is seasonality. The chart below displays the annual seasonal trend for the S&P 500 Index. The year's weakest period is directly ahead of us and runs from 2023-09-18 through 2023-10-08.
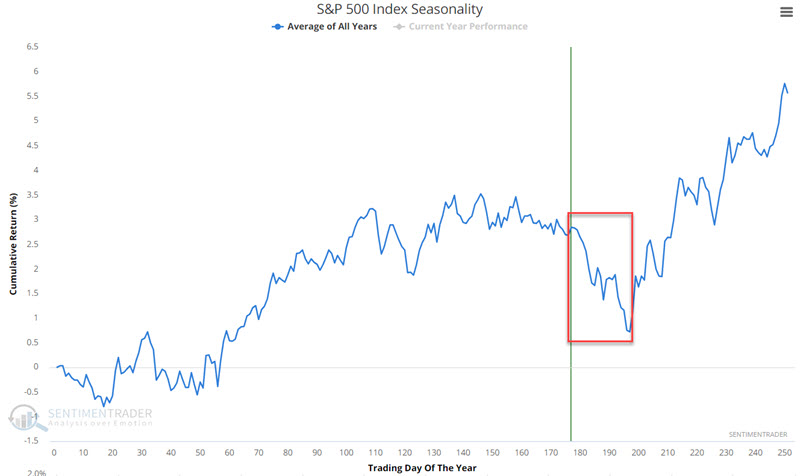
As always, it must be pointed out that seasonality is NOT a roadmap of what will happen this year. It is simply an average of what has happened in the past.
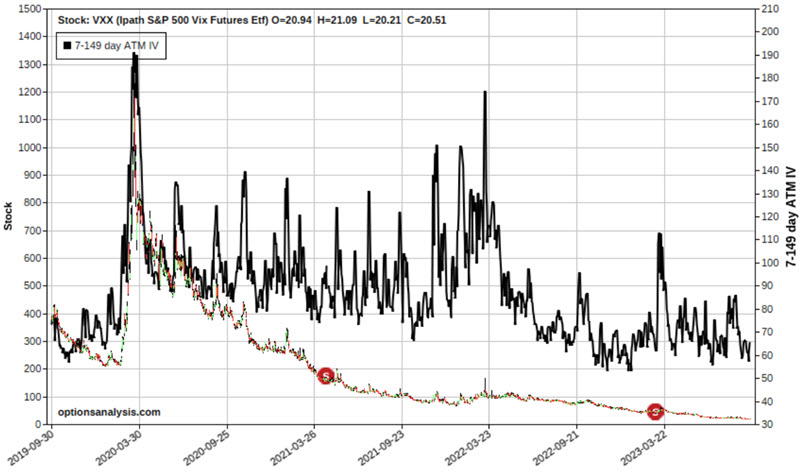
The chart below displays VXX, clearly illustrating the persistent downward long-term trend. The black line indicates the implied volatility for options on VXX. Note that this reading is near the low end of its historical range. This tells us that VXX options are "cheap" (i.e., there is a relatively low level of time premium built into these options). This - combined with the potential for a seasonal spike in the VIX Index - suggests the potential for a rare opportunity for option traders looking to play the long side of VXX.
The simplest way to demonstrate a potential opportunity is with an example. Our example trade involves:
- Buying 1 VXX Oct 2023 20 call @ $1.73
- Selling 1 VXX Oct 2023 35 call @ $0.22
Things to note:
- The cost to enter a 1-lot - and the maximum risk - is $151
- The maximum profit is $1,349 and would be realized if VXX was at or above $35 a share as of October 20th option expiration
- The breakeven price at expiration is $21.51 a share for VXX
This trade is also an example of taking advantage of volatility skew. The 20-strike price call that we are buying trades at an implied volatility of 62.5%. The 35-strike price call that we are selling trades at an implied volatility of 111.5%. This is an example of buying a "cheap" option and selling an "expensive" option.
The chart below displays the expected P/L for this trade as of 2023-10-08 (i.e., TDY #197 for the S&P 500).
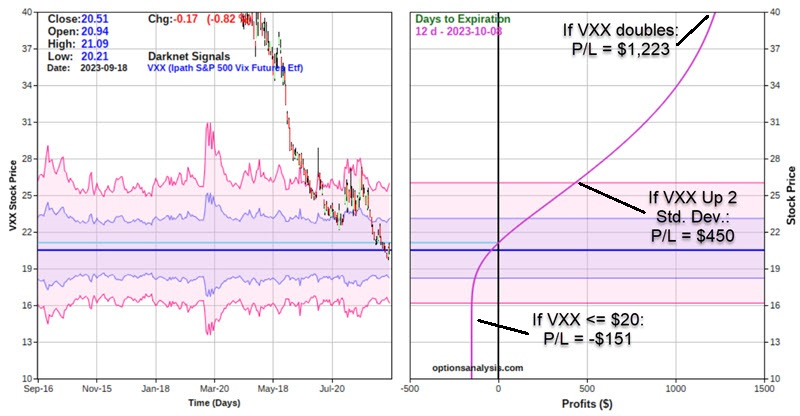
The bottom line: This trade (which represents an example and not a recommendation) represents a low-dollar-cost way to hedge against a sharp decline in stock prices and/or a sharp rise in volatility. Under any other circumstance, this trade will likely end in a loss because VXX almost invariably trends lower if the VIX Index moves lower, sideways, or even slightly higher slowly.
Financial conditions signal risk-off
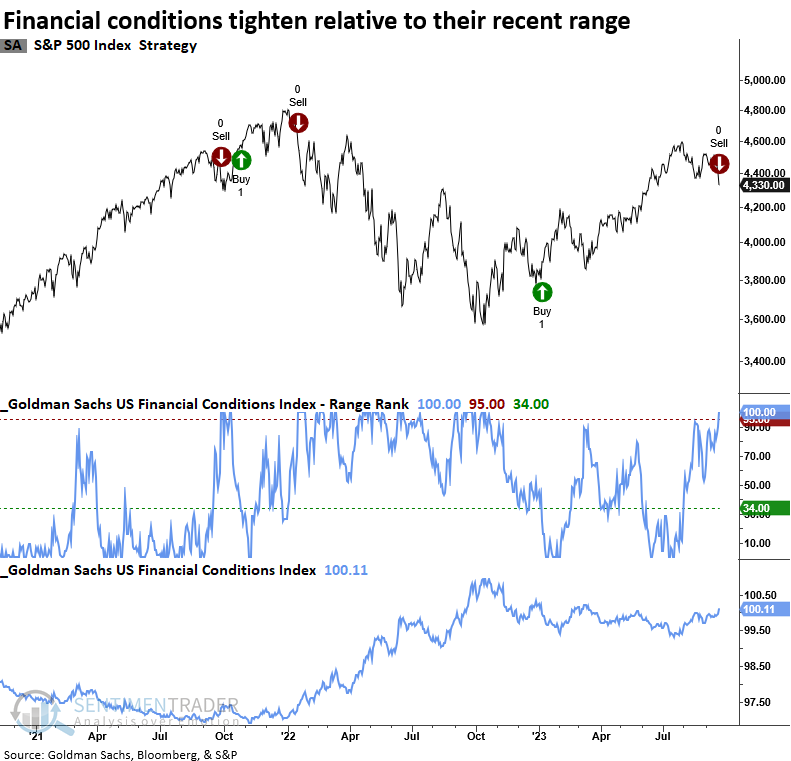
Dean showed that a trend-following model based on the Goldman Sachs Financial Conditions Index signals risk-off. Periods with tightening financial conditions underperform phases when conditions are easing. Defensive sectors typically fare better than other groups under similar circumstances.
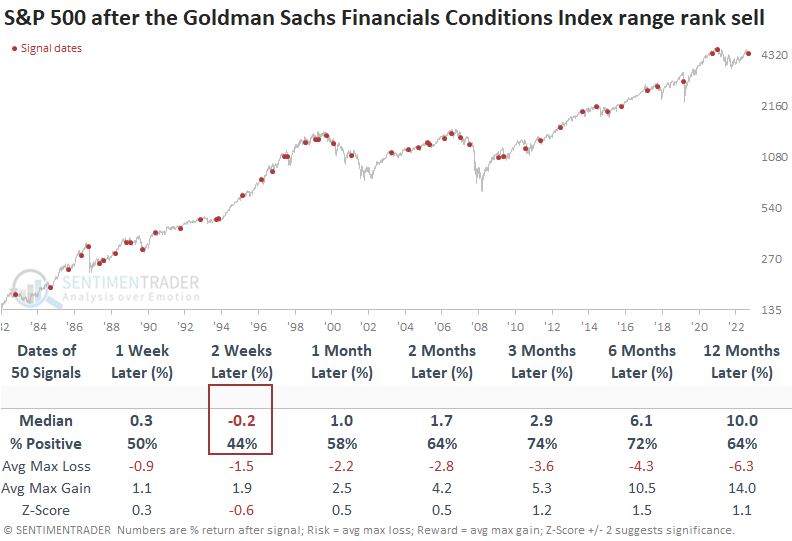
If you recall, the model moved to a bullish trend condition in January, capturing an 11% gain with the sell signal on Thursday. The model applies an 84-day range rank to the Goldman Sachs Financial Conditions Index. When the range rank declines below the 34th percentile, and price momentum for the S&P 500 is positive, the system goes long. Conversely, the model issues a sell signal when the range rank increases above the 95th percentile and the S&P 500 exhibits negative price momentum.
When the range rank for the Goldman Sachs Financial Conditions Index reverses from a period of easing to tightening, the S&P 500 tends to struggle over the next few weeks. Since 2001, the likelihood of producing an unfavorable outlook has been more pronounced, with 22 out of 25 occurrences showing negative returns at some point over the same period.
When financial conditions tighten, defensive sectors like Consumer Staples, Health Care, and Utilities tend to outperform other groups over the subsequent year.
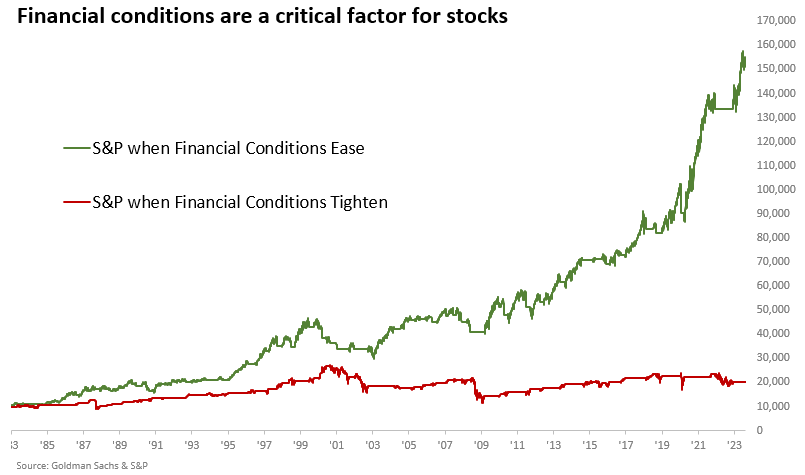
When it comes to trend-following systems that are either all in or out, measuring performance based on the growth of an initial investment is a more appropriate methodology to assess the strategy's validity. Utilizing trend-following rules, a $10,000 investment in the S&P 500 increases to $151,000 when financial conditions ease. Conversely, tightening financial conditions results in significantly smaller growth, with the initial investment reaching only $20,000.
One of the frustrating aspects of trend-following systems is their susceptibility to whipsaw alerts. With stocks showing initial signs of an oversold condition and seasonality getting closer to a more favorable period, we must be mindful of this potential outcome.
Lackluster participation as the S&P levitates
There has been a lot of talk lately - well, all year, really - about weak market breadth. In almost all of our work since October, we haven't really seen the sense in the argument.
It's gotten a bit dicier since then. It's not that breadth is bad per se; it just hasn't been all that great.
One of the hallmarks of healthy markets is that more than 60% of stocks in the index should consistently hold above their 200-day moving averages. When the market dips and fewer than 40% of stocks (or close to it) are above their averages, buyers should see an opportunity and return. We have not seen the former.
Below, we can see the S&P 500, its deviation from its 200-day moving average, and the percentage of stocks in the index above their own 200-day moving averages. The index has held more than 5% above its average for weeks, while fewer than 60% of members are above their own averages by any amount.
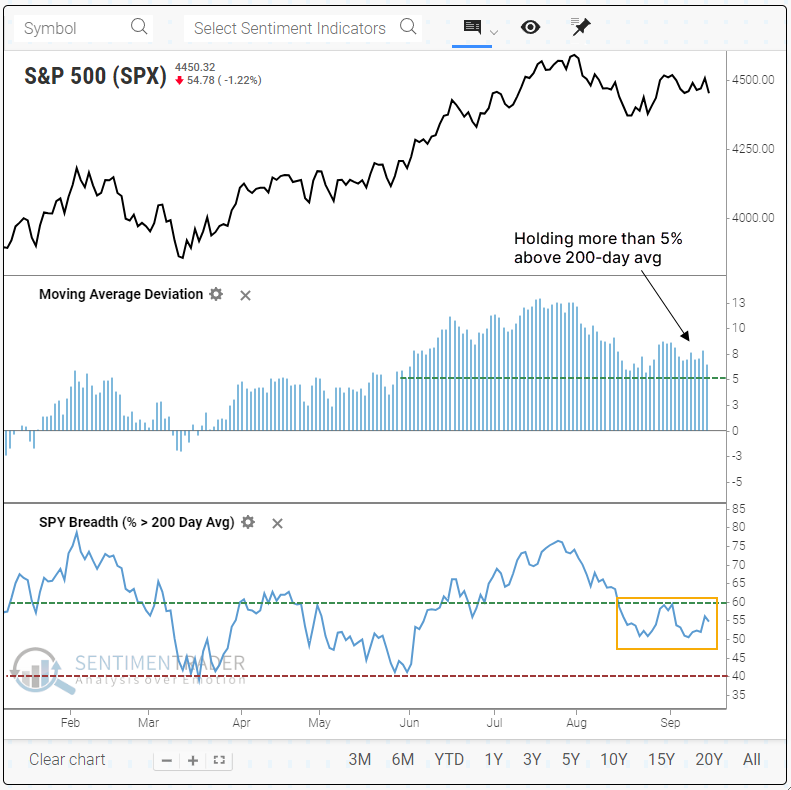
This is unusual - since 1928, when the S&P 500 has been more than 5% above its 200-day moving average, a median of 81% of its stocks were also above their own moving averages. This is the 5th-longest streak since 1928 when the S&P held more than 5% above its 200-day average while no more than 60% of its members traded above their own 200-day averages.
Since the streak is so long, the precedents are few, and the usual caveats about tiny sample sizes apply. For what it's worth, the index tended to pull the members along, and up to three months later, the index was higher after five of the six instances.
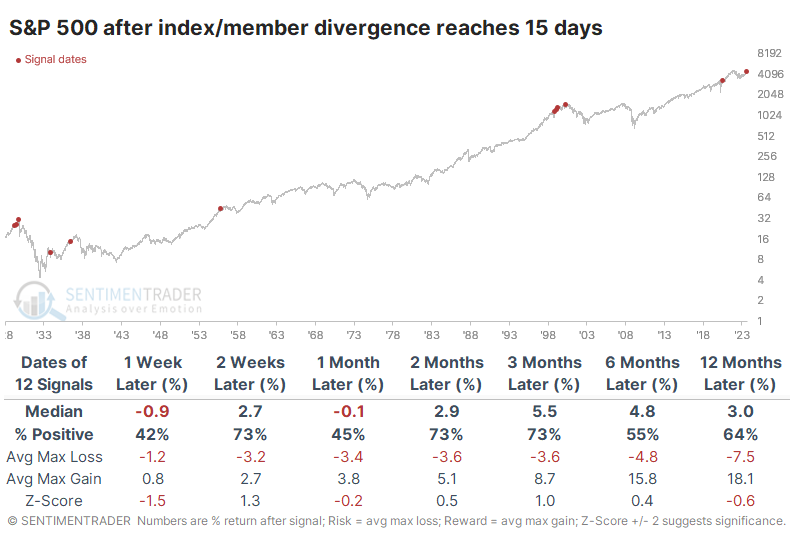
Since the sample is so small, let's look at lesser extremes. The following table shows times when the divergence streak reached 15 trading days. These weren't quite so dire, as it added dates in 1955 and 2020 that preceded decent gains. But still, it was mostly concentrated in the 1920s-30s and ahead of the internet bubble peak.
The precedents for similar behavior are somewhat troubling. It would be a lot more worrisome, however, if we get to a point where fewer than 40% of S&P stocks are holding above their 200-day averages, and bulls show little interest in using that as a buying opportunity.
Some breadth concerns among Big Tech, too
There are some nascent signs that the good participation among stocks that have helped to sustain the market since October is slipping. Some of the biggest drivers of the rally have been massive tech stocks, which are heavily represented in the Nasdaq 100. As we're seeing within the S&P 500, there are some initial signs that all is not well within the index.
Over the past 20 days, the Nasdaq 100 has rallied several percent. But the percentage of stocks within the index that have fallen to a 52-week low has more than doubled.
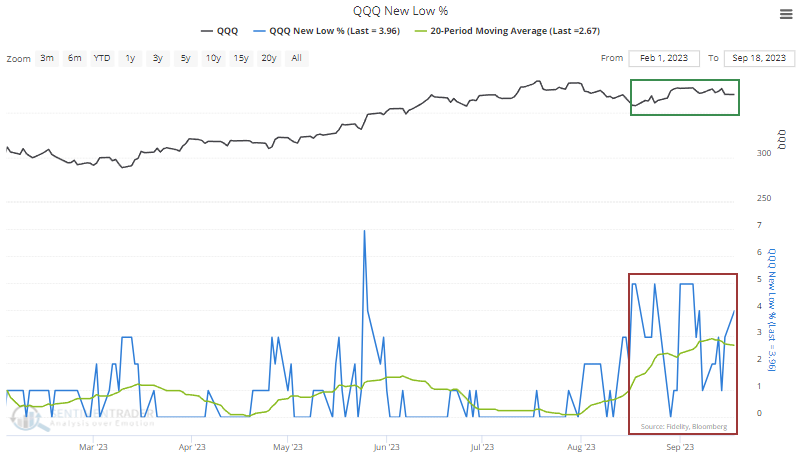
Divergences like this can be an effective heads-up of looming trouble in the index. So far, the signs of internal deterioration are isolated, and historical similarities aren't all that troubling...yet.
The table below shows every time over the past (nearly) 40 years when the NDX climbed by more than 3.5% over the past month, yet the 20-day average of 52-week lows climbed by more than 1.5%. It filters out any signals that occurred when the index was more than 10% from a multi-year high.
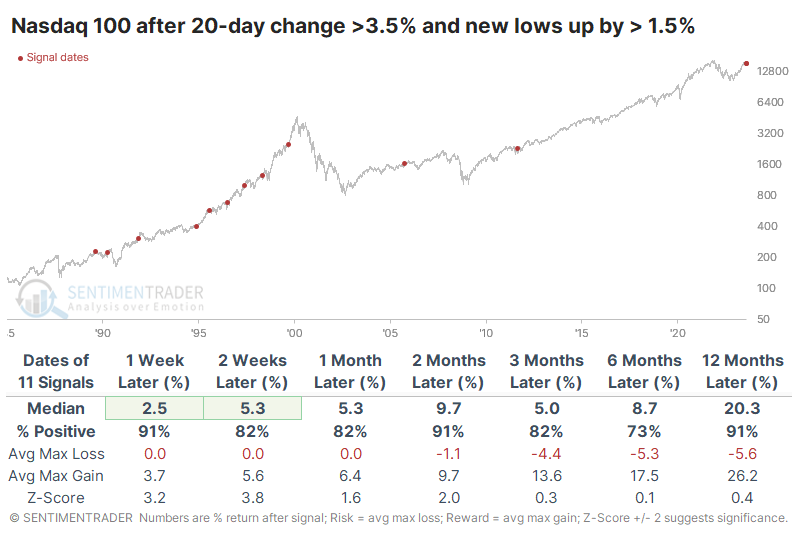
It wasn't much of a problem. Over the past 30 years, the Nasdaq 100 continued to rise over the medium- to long-term every time. It was not an effective indicator of imminent demise.
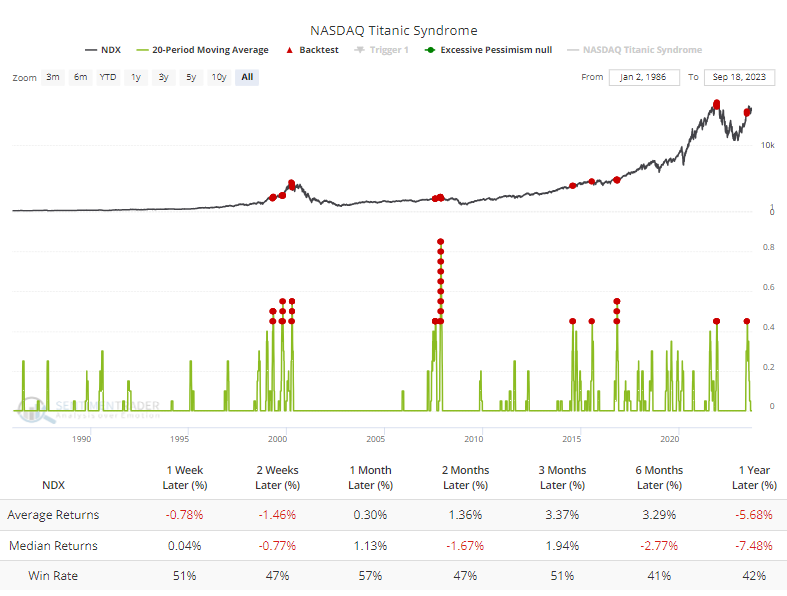
So, the initial evidence isn't compelling enough to suggest the index is in immediate trouble. It would be more worrisome if further signs of internal deterioration started to trigger. It happened in June, with a bevy of technical warnings via the Titanic Syndrome on the broader Nasdaq exchange.
The Backtest Engine shows that the Nasdaq 100 suffered poor consistency and average returns from 6-12 months after a cluster of these signals over 20 days. It would be even more worrisome if these signals started cropping up again, especially if it's coupled with triggers in the Hindenburg Omen, further indicating signs of a terribly split market.
For one of the few times in almost a year, we're starting to see signs of a split in the market. Whereas during most of the last 11 months, most stocks were rising, and there were multiple bouts of buying thrusts, buyers' interests have become more concentrated and isolated. That doesn't necessarily spell imminent doom, but it's not a great sign.
Another new relative low for smaller stocks
We've spent some time looking at the differences in fortunes between various sectors and factors this year because there has been ample opportunity to do so. While the "breadth is narrow" argument doesn't have a whole lot of support, there is no doubt that a handful of stocks have been able to drive a large part of the gains across sectors and indexes.
Bloomberg recently noted that investor preference between smaller stocks and larger ones has become so stark lately that a ratio between the two just fell to a two-decade low. Indeed it has.
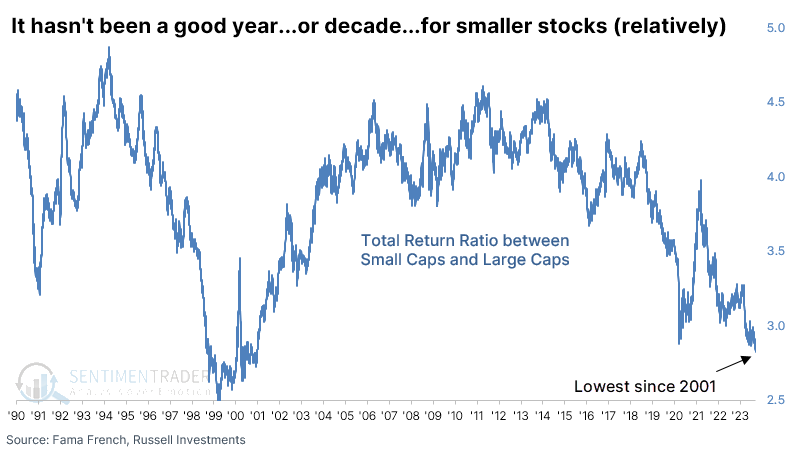
Based on other times the ratio fell to the lowest in at least a decade, and for the first time in at least 30 sessions, there wasn't a lot of reason to expect an imminent or sustained turnaround. Over the next three months, the total return on Small Caps exceeded Large Caps only 3 times out of 15 attempts, and those were just barely.
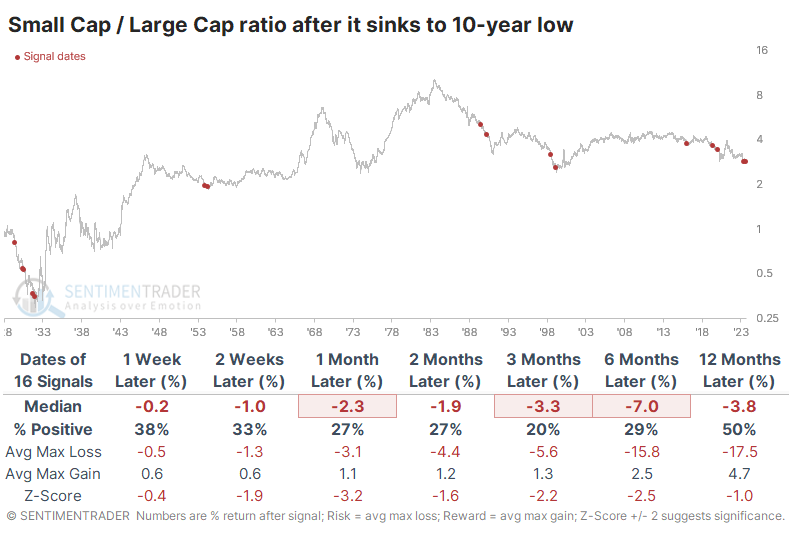
The total return on Small Caps was uninspiring. Over the next six months, the median return was -8.7%, which is horrid for a total return index. Even excluding the 1930s, returns were quite good four times but not the others.
It was better for Large Caps. Since 1950, the twelve-month returns were positive each time, all but one by double digits.
Semi's streak stopped
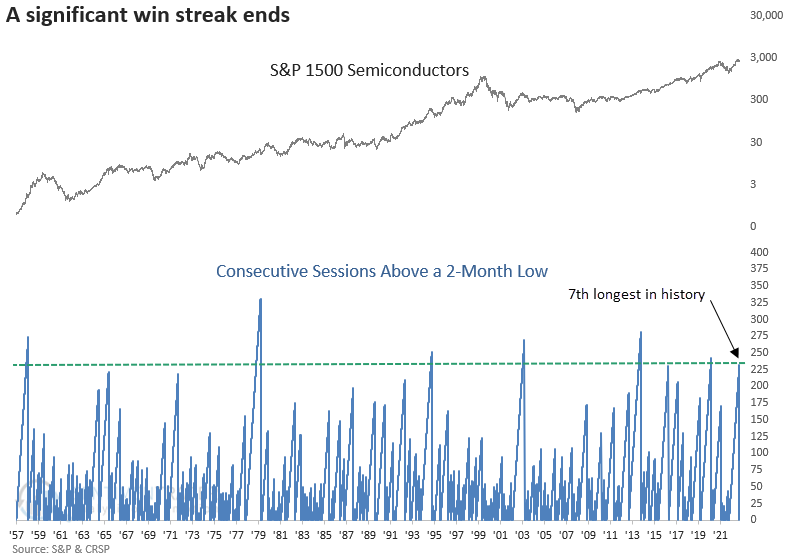
Dean showed that a semiconductor index closed at a 2-month low after avoiding a low for 232 consecutive sessions. Similar conclusions to a lengthy win streak led to a short-term pause within the context of an uptrend.
After failing to close at a 2-month low for 232 consecutive sessions, the S&P 1500 Semiconductor index snapped its win streak on Wednesday, ending the 7th longest period without a low in more than 65 years.
When semiconductors closed at a 2-month low for the first time after avoiding a low for 200 sessions or more, the industry tended to see further downside over the following week. The pause didn't last long as the group bounced back with a 90% win rate a month later. A year later, semiconductors were higher 90% of the time, with a median gain of 20%.
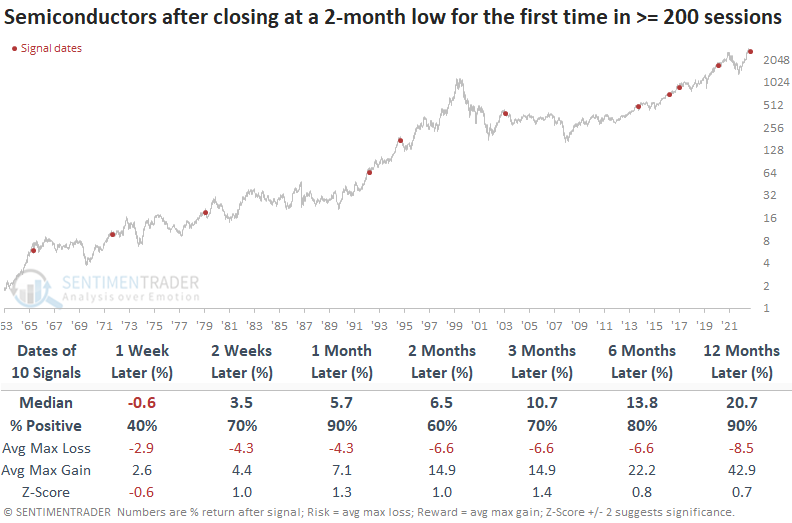
Semiconductors tended to outperform Technology and the S&P 500 over medium and long-term horizons, though it was more of a toss-up in the shorter-term.
Another surge in Nikkei stocks
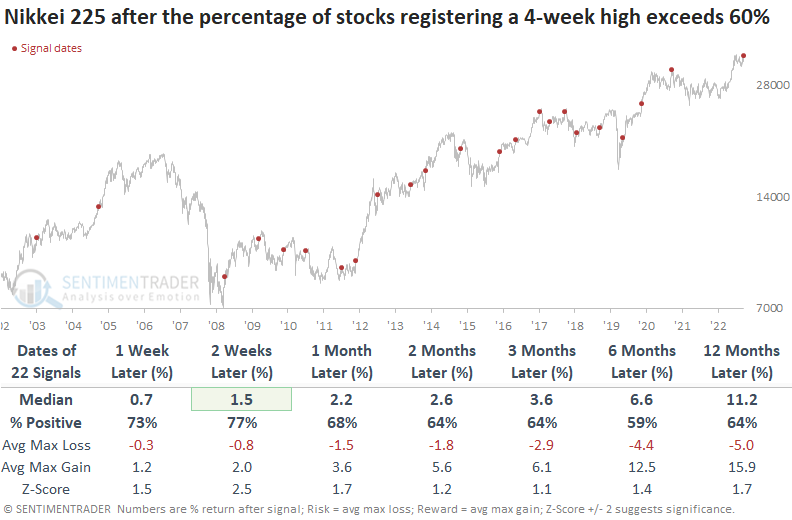
Dean showed that the percentage of Nikkei 225 stocks registering a 4-week high surged above 60%. After similar thrusts, the bellwether index was higher 77% of the time over the next two weeks. Other breadth and relative strength indicators paint a favorable picture for Japan.
In a research note in May, Dean highlighted the massive breakout in the widely followed Nikkei 225 Index. Since that report, the bellwether index is up a little over 8% in local currency terms. The currency-hedged ETF (DXJ) has surged by an impressive 19%.
After consolidating for the last two and half months, the Nikkei 225 is on the cusp of breaking out again, and participation from individual members within the index is surging with more than 60% of Nikkei 225 members closing at a new 4-week high.
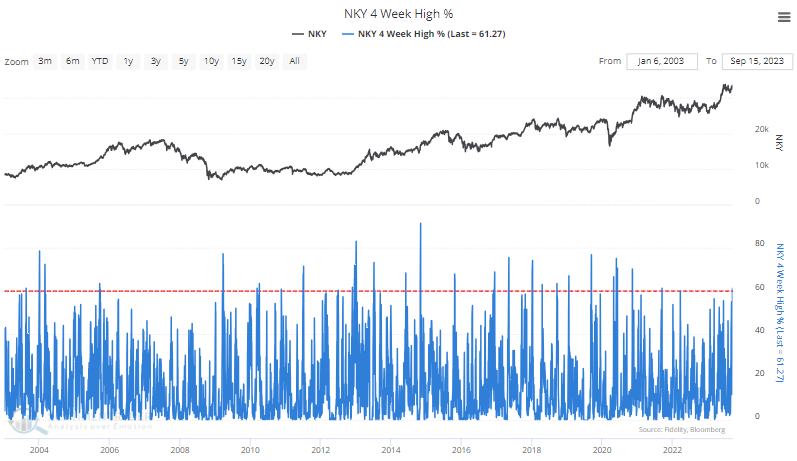
When the percentage of Nikkei 225 members closing at a 4-week high exceeds 60%, the bullish price momentum is likely to continue in the near term, with the index rising 77% of the time over the next few weeks. At some point over the next month, the bellwether index was higher in 20 out of 22 precedents.
It's not just Nikkei 225 Index members that are surging. The Topix Index, which contains over 2000 Japanese stocks, has seen the highest surge in 52-week highs since 2017. Readings above 10% generate healthy annualized returns.
The percentage of Topix Index members trading above their 200-day average has risen to the highest reading since 2021, a level associated with favorable annualized returns.
Loony loonie
Jay showed that the Canadian Dollar is entering a period of typically significant seasonal weakness and trader sentiment is flashing an oddly contrarian unfavorable signal.
The chart below displays the annual seasonal trend for the Canadian Dollar. The red box highlights the period that extends from the close on Trading Day of Year #185 through TDY #251. For 2023, this period extends through the close on 2023-12-18.
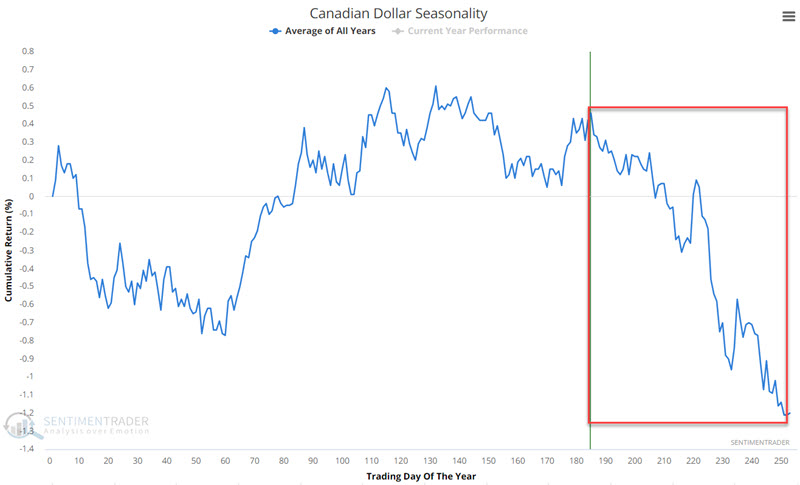
Since 1971, this seasonal window showed a gain only 35% of the time, with an average loss about twice the average gain, and much more likely to suffer a large decline than enjoy a large rise.
Since has soured. Generally, the lower our Optix indicator falls, the more likely the highlighted market or index will stage a reversal. But there are exceptions to every rule. The Canadian Dollar appears to be one of those exceptions. Other times the Optix fell this low, it didn't have a great track record of preceding lasting rebounds.
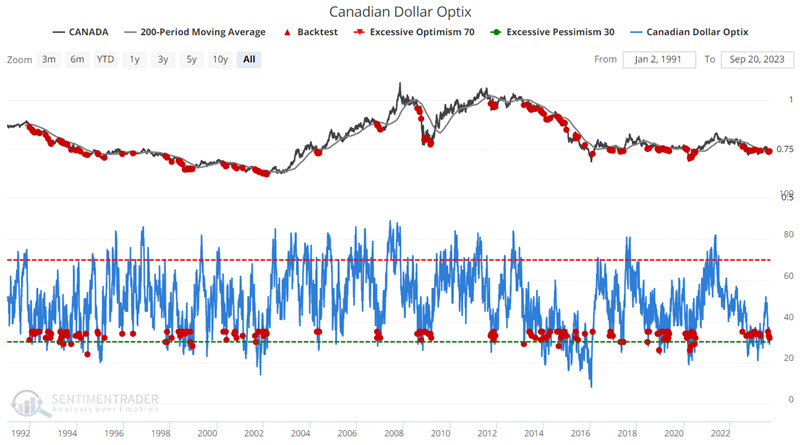
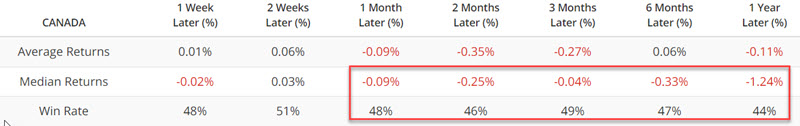
This is by no means an overwhelmingly bearish signal. The Win Rates across the board are just under coinflip territory, so this is not a signal that would ever be used as a standalone model.
Crude concerns
Jay noted that crude oil futures term structure recently crossed a potentially significant level. This action may have implications for the energy complex.
The term structure of crude oil futures shows the relationship of the near-term futures contract to a further-out contract. If it is above 1.0, the near-term contract is priced higher than the further-out contract, called backwardation. Spikes in this measure can flag impending market weakness.
The chart below displays all dates when the Crude Oil Term Structure crossed above 1.05 for the first time in 21 trading days. The most recent signal occurred on 2023-09-15.
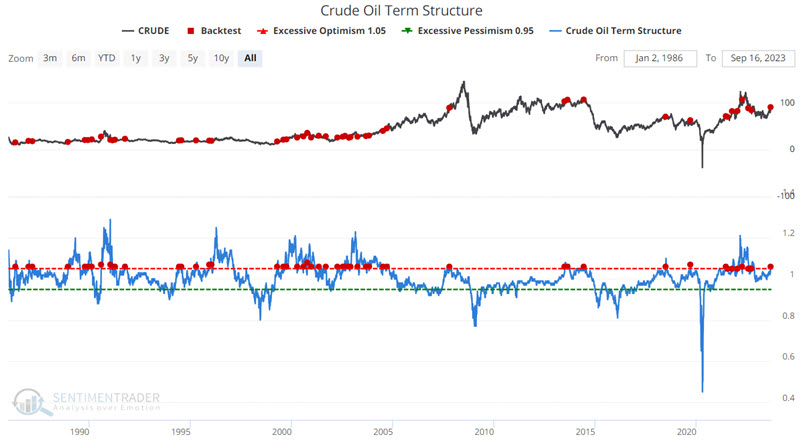
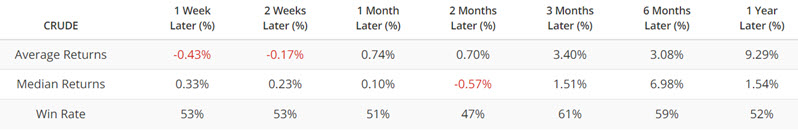
The results are essentially not all that meaningful, with Win Rates mostly in "coinflip" territory and lackluster Average and Median Returns.
Instead of looking at the entire history of crude oil futures trading, we will focus only on the last 15 years. The reality is that some readers will consider this relevant, and others will dismiss it as curve fitting or recency bias. There is no correct answer, and it is one you will have to decide for yourself.
The table below displays crude oil performance only during the last 15 years when the Crude Oil Term Structure crossed above 1.05 for the first time in 21 trading days.
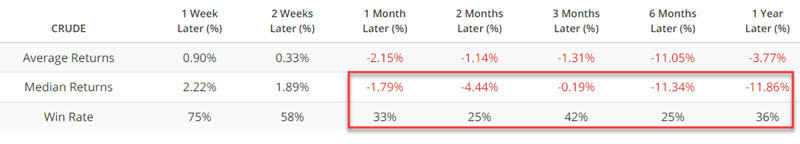
With the notable exception of signals generated in 2021 (which did still experience some significant weakness in the first two months after a signal), the overall results have been very subpar. Six-month returns showed a gain only 25% of the time, with a median decline in double digits.
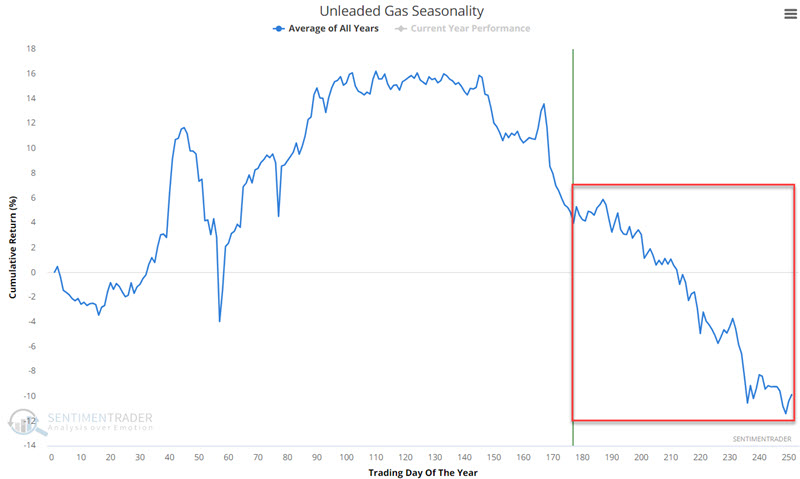
To get a broader picture of the energy sector, the chart and table below display unleaded gasoline futures performance only during the last 15 years when the Crude Oil Term Structure crossed above 1.05 for the first time in 21 trading days.
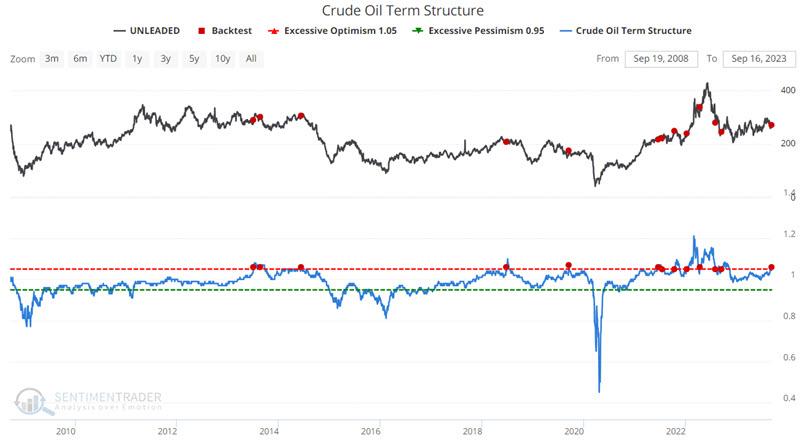
Early strength in the first two weeks after a signal often led to significantly poorer performance. Waiting for some sign of an actual reversal is likely a better course of action than selling short into a sharply rising market. Natural gas generally fits the same profile as crude and unleaded.
One of the key reasons to be wary of a possible reversal is seasonality in some of the energy products. Jay showed the annual seasonal trends for the four major energy futures markets - crude oil, unleaded gas, heating oil, and natural gas, of which unleaded is shown below. All but one of them show consistent weakness in the last months of the year.
Oil is overbought and overloved
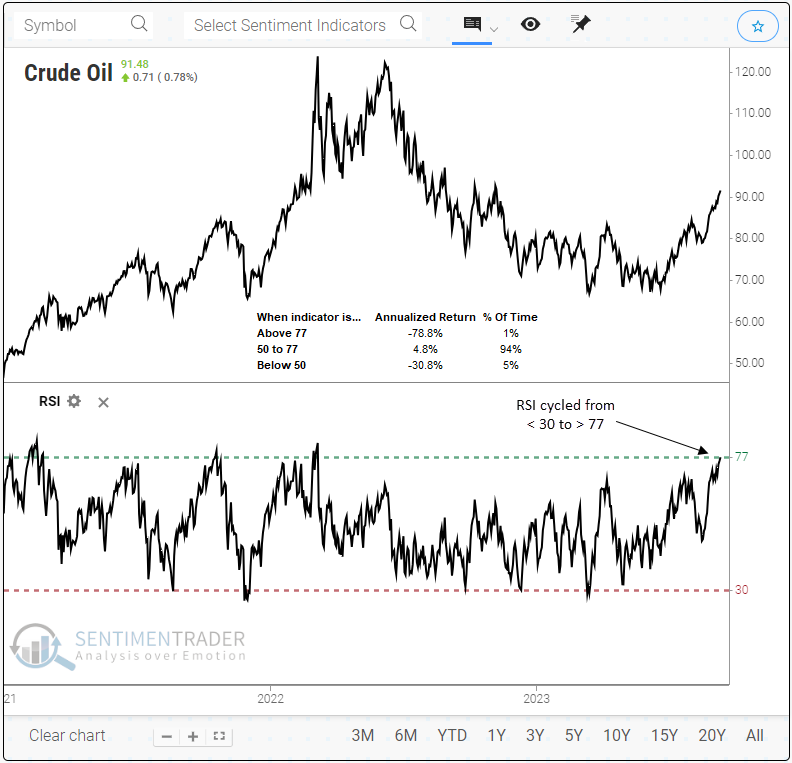
Dean showed that the Relative Strength Index (RSI) for crude oil rose above 77, indicating an overbought status. Similar overbought conditions suggest oil could struggle over a medium-term horizon.
The Relative Strength Index (RSI), developed by J. Welles Wilder Jr., is a popular technical analysis indicator that measures market momentum. As per the classical interpretation, when the RSI reading reaches 70 or higher, it denotes an overbought scenario, whereas a reading of 30 or lower signifies an oversold condition. Unlike stocks, commodities are known for their tendency to revert to the mean. Hence, the sustainability of overbought conditions is generally lower.
For the first time in more than 18 months, the Relative Strength Index (RSI) for crude oil rose above 77, a condition achieved only 1% of the time since 1983. While the sample size is small, annualized returns are extremely unfavorable when the RSI increases to the current level.
When the RSI for crude oil cycles from less than 30 to greater than 77, the commodity tends to encounter difficulties over short and medium-term horizons. In 19 out of 22 precedents, oil experienced negative returns at some point within the next two months.
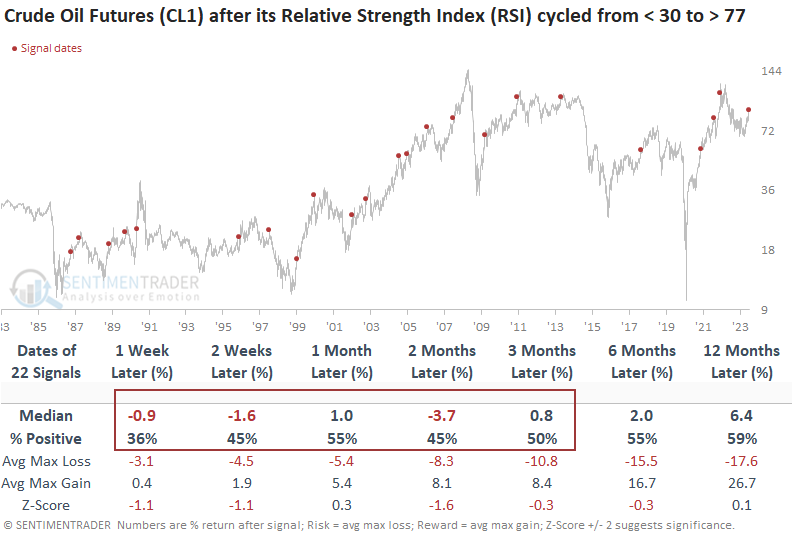
When the RSI for oil exceeds 77 for the first time after a 1-year low, the commodity tends to digest the recent gains over the next few weeks.
Jay noted the term structure above, so we will now identify instances when the RSI was above 77 for the first time after a 1-year low, and the term structure was 1.07 or greater. The outlook for crude oil doesn't look promising across any time horizon.
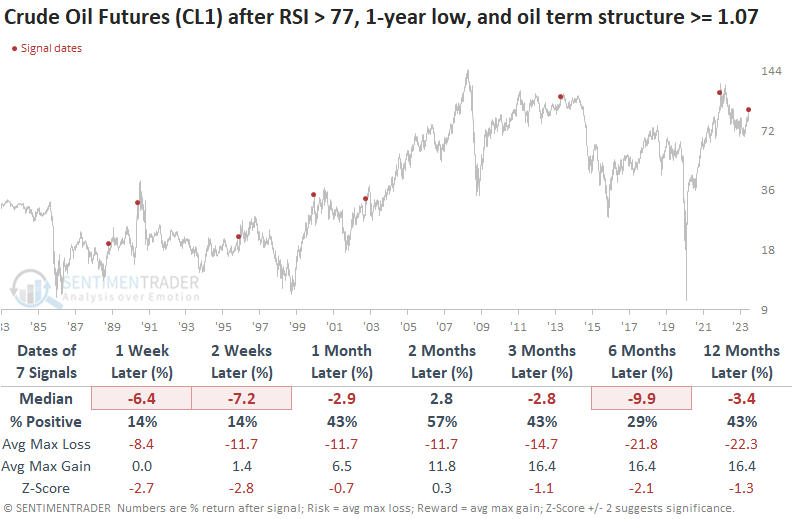
The S&P 500 energy sector shows sluggish results over the subsequent month for each of our crude oil studies. However, the overbought condition in oil leans bullish over long-term horizons.
A sugar high
Jay showed that sentiment on sugar futures got a bit overheated as our Sugar Optix indicator soared as high as 84 before backing off. Historically, when sugar sentiment reverses from an extremely high reading, unfavorable things tend to follow.
The chart below displays Sugar futures and Sugar Optix sentiment gauge and highlights all day when Sugar Optix was above 70.
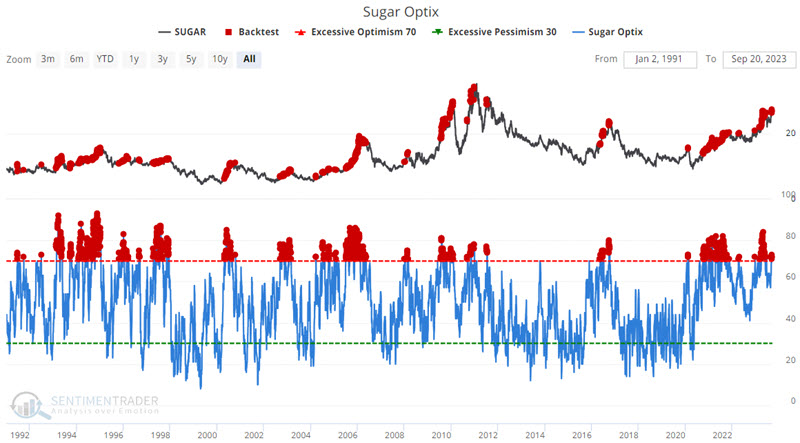
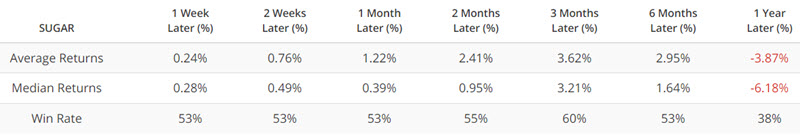
These particular results show a tendency for moderate gains in the short term and a decline over one year. But by themselves, these results are not compelling from a trading perspective. On numerous occasions, Sugar continued to rally sharply higher after Optix rose above 70 before eventually peaking.
Let's smooth results using a 100-day moving average of Sugar Optix readings. The chart and table below display Sugar futures performance after the 100-day average for Sugar Optix readings is above 70.
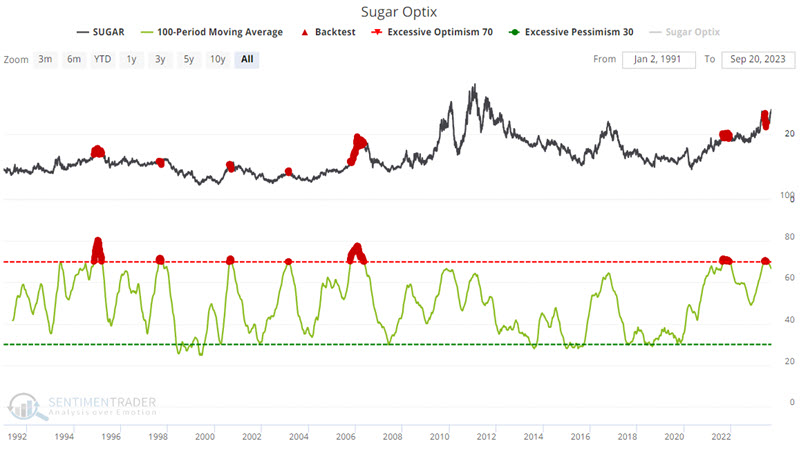
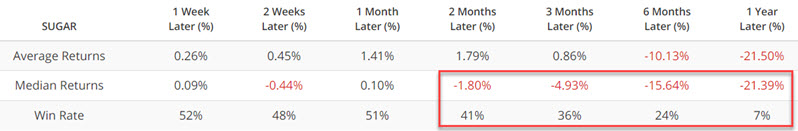
Now we are getting closer to something useful, as 6- and 12-month results are decidedly bearish. However, we see times when a signal involves selling short into strength.
So, let's consider one last iteration. In this test, we look for the 100-day moving average of Sugar Optix to cross below 70. In other words, instead of looking for a signal while sentiment is becoming more bullish, we will wait for "the bloom to come off the rose," so to speak.
The chart and table below display Sugar futures performance after the 100-day average for Sugar Optix readings crossed below 70.
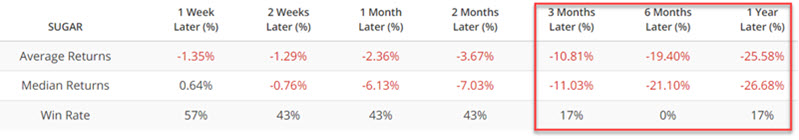
This triggered in July and sugar has rallied hard since then. But the long-term implications are not all that encouraging for sugar bulls.
About TradingEdge Weekly...
The goal of TradingEdge Weekly is to summarize some of the research published to SentimenTrader over the past week. Sometimes there is a lot to digest, and this summary highlights the highest conviction or most compelling ideas we discussed. This is NOT the published research; rather, it pulls out some of the most relevant parts. It includes links to the published research for convenience, and if you don't subscribe to those products, it will present the options for access.