
TradingEdge Weekly for Sep 13 - Some green shoots, surging utilities, new low yields

Key points:
- The Nasdaq Composite and Nasdaq 100 have suffered quick successive corrections
- Falling oil prices and Treasury yields have been a tailwind for stocks
- Seasonality remains an issue, but some indicators are flashing green
- Some specific sectors are facing especially tough seasonal windows
- Utilities have been on a historic run
- Investors are showing some panic in energy stocks, while definitely not in utilities
- 3-year Treasury yields cycled to a new low
- TLT is poised to set a new one-year high for the first time in months
- Oil fell to a new low, too
- Soybeans are facing their toughest seasonal window of the year
Quick corrections
Just as quickly as the August gains materialized, they disappeared. Or much of them, anyway. The Nasdaq Composite made a roundtrip from correction territory to well within a pullback, back beyond a correction.
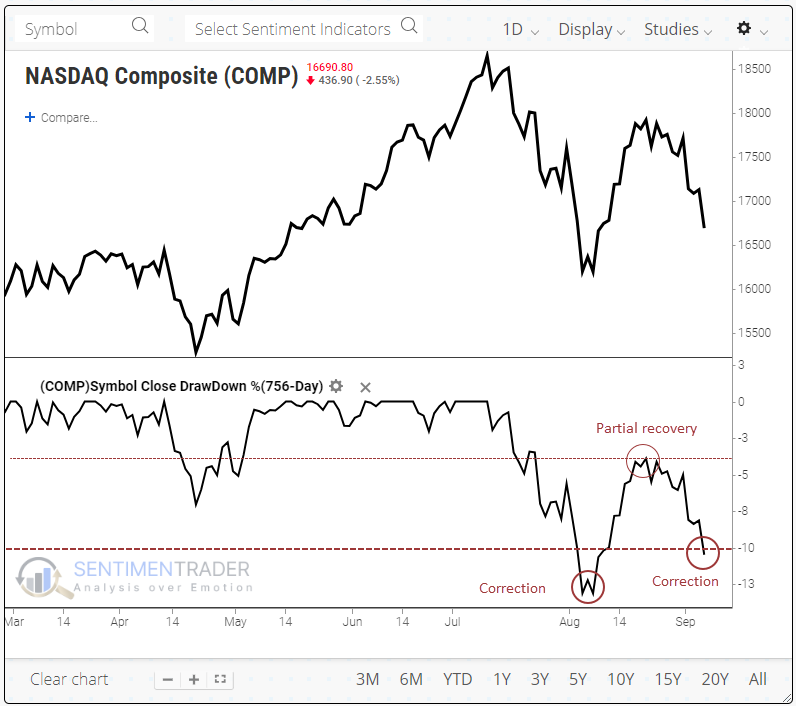
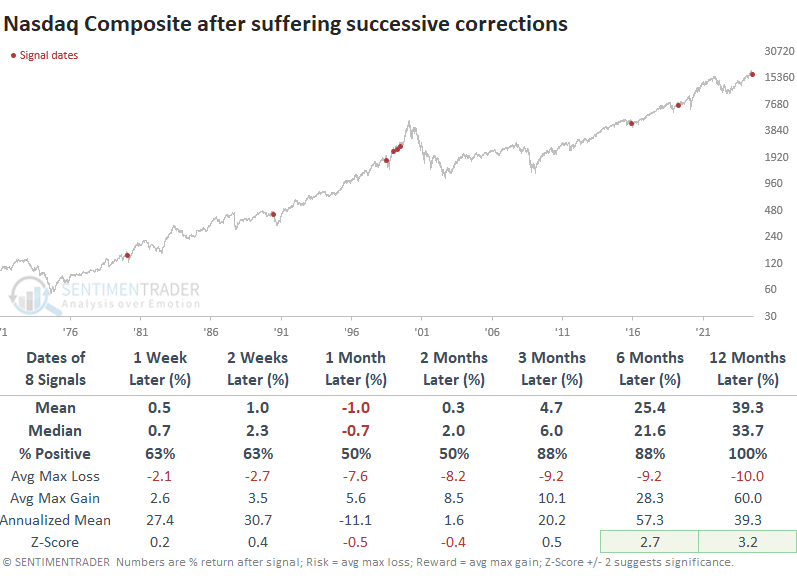
Successive corrections have preceded some significant peaks - well, one - but mostly, it led to recoveries. The table below shows every time the Nasdaq Composite was at least 10% from a multi-year peak (for convenience, we'll call this a correction). Then it recovered to within 4% of that peak and quickly fell back to more than 10% below. Over the next year, the index sported double-digit gains every time.
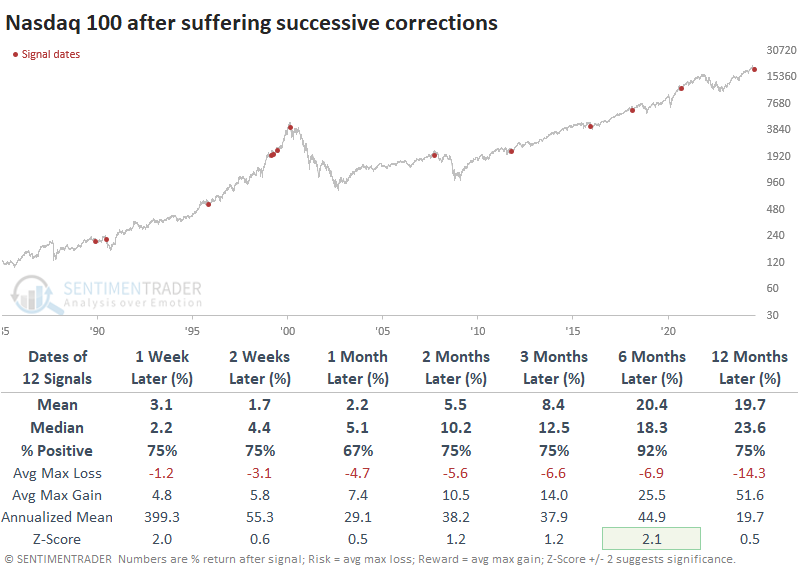
The Nasdaq 100 is more concentrated and often more volatile than the Composite. It shows a similar pattern: a -10% correction, recovery to within 4% of its high (rounded), and then a decline back into correction territory.
Because of that increased movement, the Nasdaq 100 has more often suffered repeat corrections. Over the next six months, the NDX showed gains after 11 out of 12 signals. That single loss was a doozy, however, as it coincided with the pricking of the internet bubble.
Macro market tailwinds
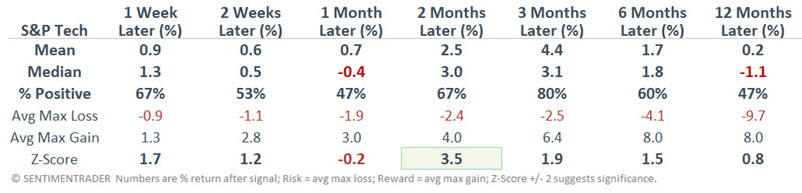
A significant divergence has developed between stocks, crude oil, and the 10-year Treasury yield. Dean noted that similar precedents preceded a 100% win rate for the S&P 500 over the subsequent six months.
As he points out further below in this report, crude oil and Treasury yields have both fallen to the bottom ends of their ranges, which may be sending important macro economic signals. All this is happening while the S&P 500 remains near the upper end of its own range.
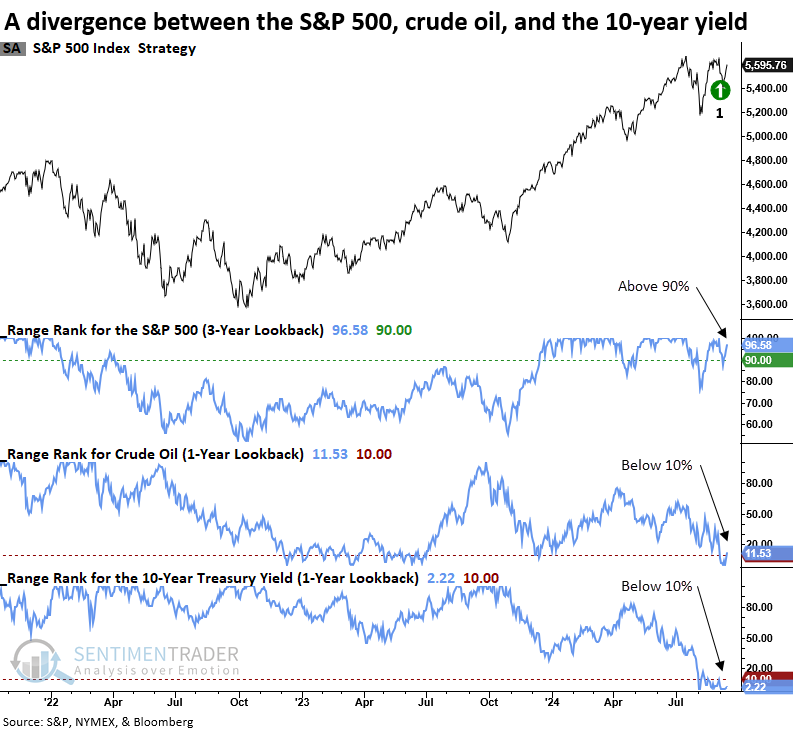
Whenever the S&P 500 resided near the upper end of its 3-year range as crude oil, and the 10-year yield hovered near the bottom end of their respective 1-year ranges, stocks benefited significantly, with the world's most benchmarked index rallying 100% of the time over the following six months. The last two signals suffered meaningful drawdowns, especially in 2020 during the pandemic panic.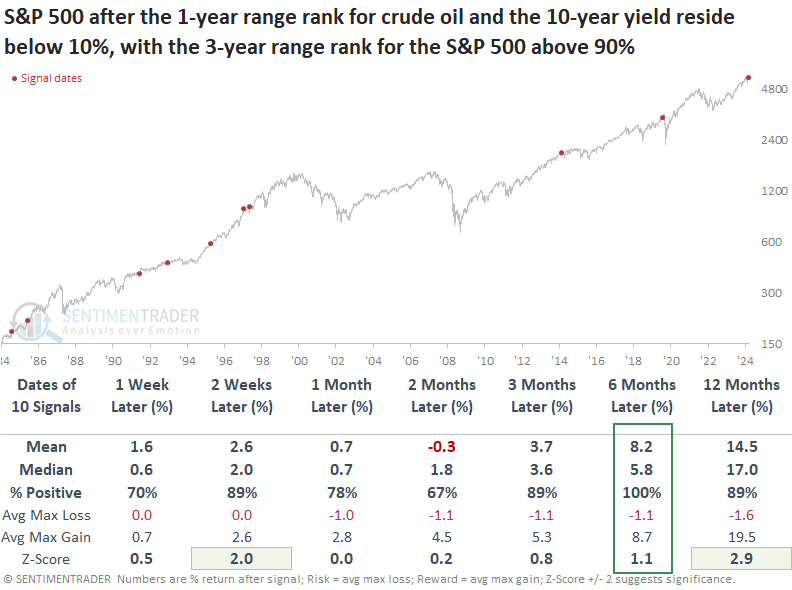
Over the subsequent month, the S&P 500 and many cyclical sectors delivered lackluster returns, whereas defensive groups displayed gains, a scenario we are observing again now. However, six to twelve months later, the cyclical sectors reversed, taking the lead over defensive stocks.
Seasonal worries but some bullish indicators
Jay suggested that weak seasonality is an overarching concern in the near-term. Short-term concerns aside, a handful of indicators have recently pointed to better times ahead.
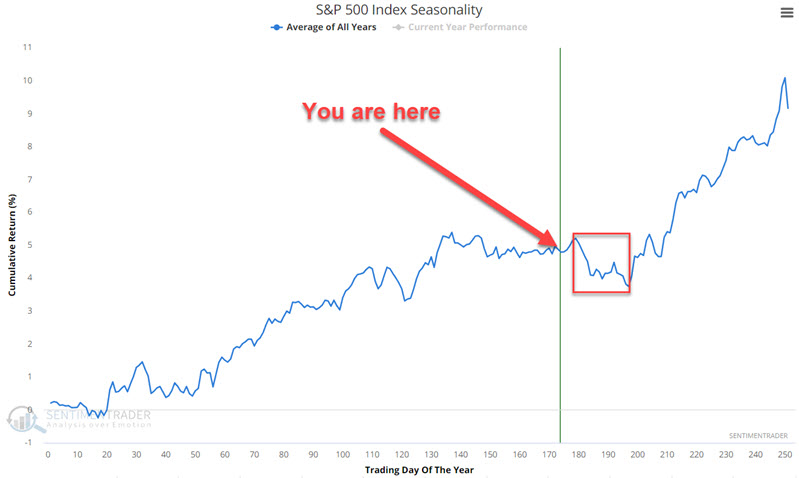
The concern of seasonal weakness presently overhangs the stock market. As another reminder, the chart below displays the annual seasonal trend for the S&P 500 Index.
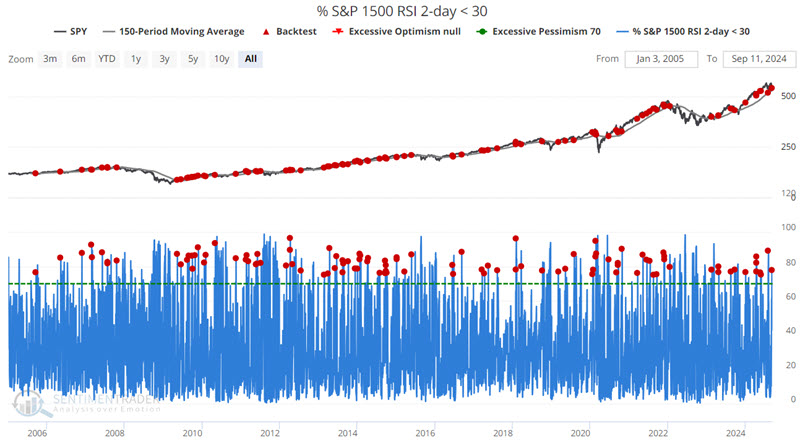
Let's look at a decent "buy the pullback in an uptrend" type of indicator. The chart below highlights all dates when the % of S&P 1500 Index stocks with a 2-day RSI below 30% crossed above 70% and the S&P 500 Index was above its 150-day moving average.
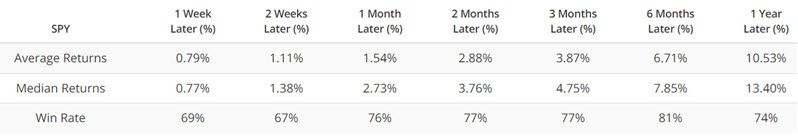
The first criteria naturally tend to occur when the market experiences a meaningful pullback and many stocks reach an oversold reading. The second criterion filters for an overall uptrend in the market. Over the next six months, the S&P 500 rallied 81% of the time with a robust average return.
Jay also looked at Dumb Money Confidence and the OEX Open Interest Ratio, which are both giving bullish implications for stocks.
Seasonal sector issues
September 2024 is off to a particularly rough start. Jay noted that if history proves an accurate guide, investors may do well to avoid large allocations to the consumer staples, consumer discretionary, and materials sectors
The chart below displays the annual seasonal trend for the Consumer Staples Select Sector SPDR ETF (ticker XLP), which tracks the S&P 500 Consumer Staples Index.
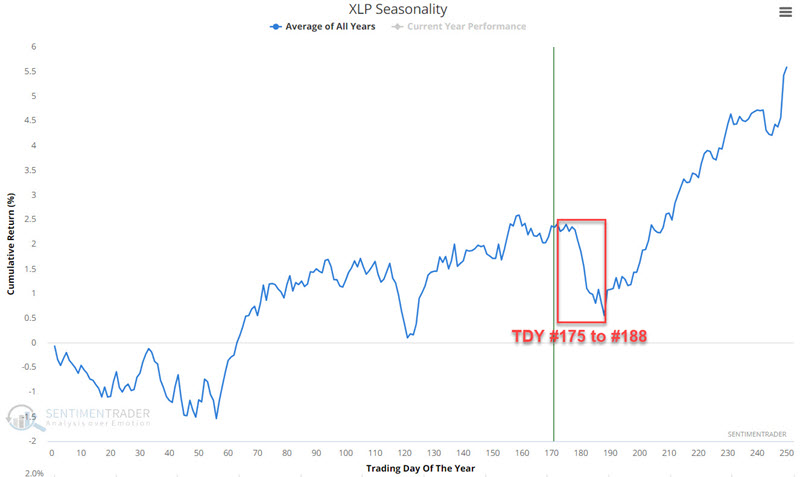
Note that an unfavorable period extends from Trading Day of Year (TDY) # 175 through TDY #188. For 2024, that period extends from the close on 2024-09-11 through 2024-09-30.
We will use the S&P 500 Consumer Staples Index starting in 1953 for testing purposes. The chart below displays the hypothetical growth of $1 achieved by holding a long position in the Consumer Staples Index only during the TDY #175 to #188 period since 1953.
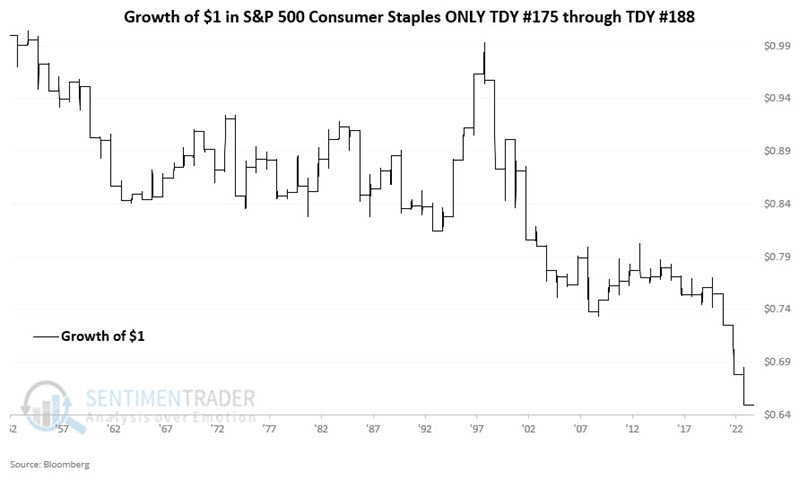
These windows showed a gain 46% of the time, and were twice as likely to show a large decline of more than 5% than a large rally.
Jay also highlighted similarly weak windows that are coming up for the consumer discretionary and materials sectors.
Utilities momentum
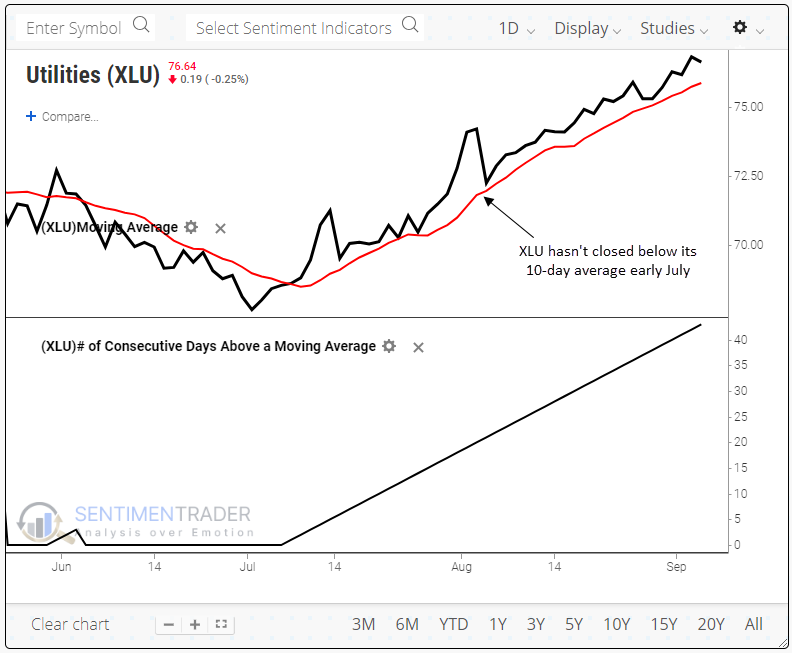
We've noted many times over the years that utilities, unique among sectors, don't often react well to positive momentum. They are a highly defensive group of stocks, and the momentum factor is not usually effective over any time frame.
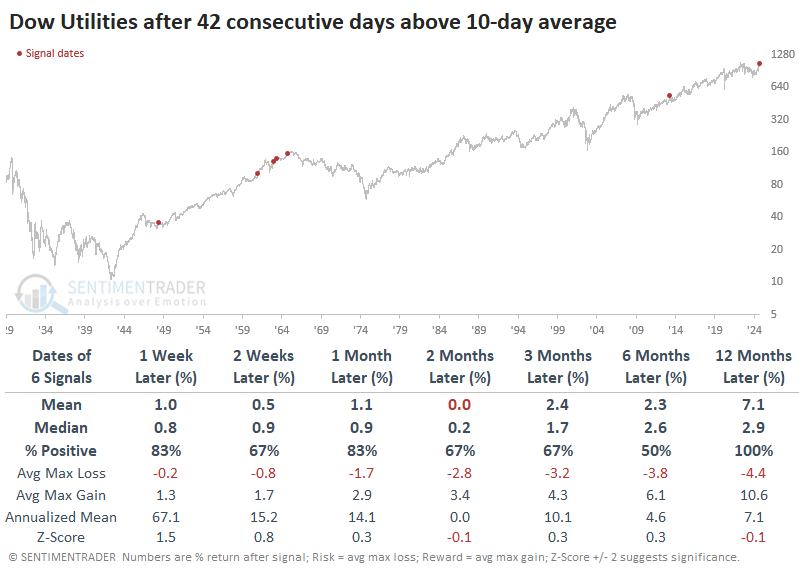
The group is at another one of those points. The XLU fund is amid a historic run, having not closed below its 10-day moving average for a remarkable 43 trading days, more than two months. This streak exceeds any other streak since the fund's inception by far.
If we use the Dow Jones Utilities Average to go back as far as we can, we see that there have only been a handful of extreme streaks when the sector levitated for at least two full months above its 10-day moving average.
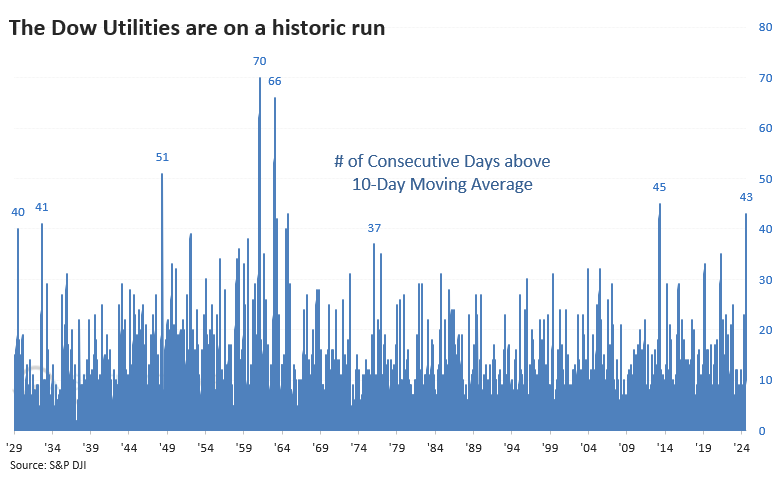
The table below shows that the other times the streak reached 42 days, utilities did okay in the months ahead, but the two-month average return was about even. Over the next year, the index showed a gain all six times, but only one was meaningful. Except for 1961, utilities struggled to show any meaningful gain (this excludes dividends).
Utilities often pay a hefty dividend, so if we use a total return data series, we get a large sample size, and average returns increase. Still, over most time frames, the average return is less than any random time, and the last four signals were all substantial losers.
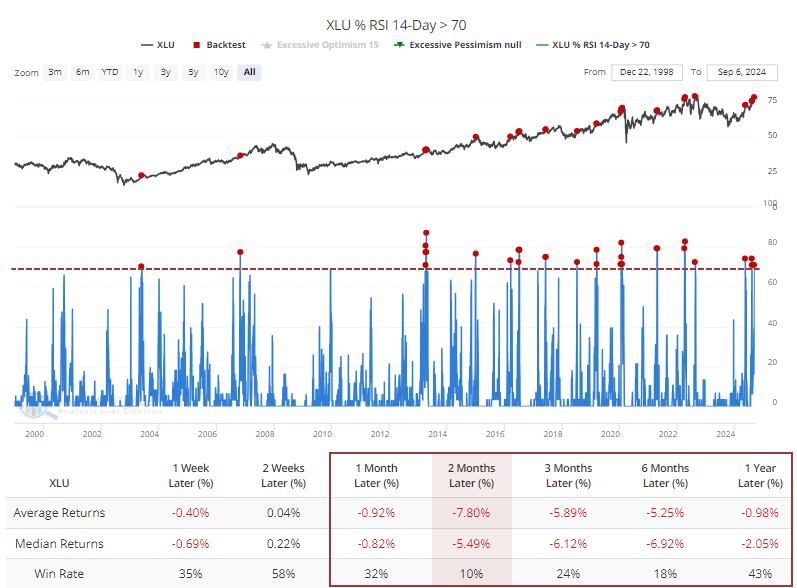
The indexes are not the only ones doing well; the average utility stock has also been driving higher. Late last week, more than 70% of stocks in the sector could be considered overbought. The Backtest Engine shows 29 days when so many utility stocks were overbought. Over the next two months, only 3 of those days sported a positive return, and all three gains were small.
On a longer time frame, internal momentum has been persistent enough that the McClellan Summation Index for utilities has crossed +2500, an extremely high level for this sector. Again, the Backtest Engine shows poor returns going forward. Also, more than half of the stocks hit a 52-week high on the same day. Once again, the Backtest Engine tells us the sector hasn't consistently maintained this upside momentum over the past 25 years.
Panic in energy (and definitely not in utilities)
That money flowing into utilities has to come from somewhere, and in part, it came from more cyclical sectors like energy.
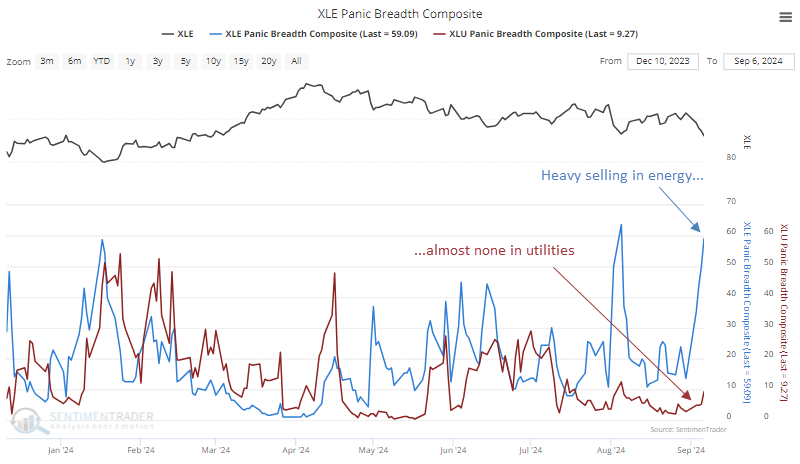
The Sector Breadth page shows that among the major U.S. sectors, utilities and energy are at opposite ends of the spectrum. The Panic Breadth Composite aggregates a handful of measures into one convenient measure that monitors the level of internal selling pressure. There is very little in utilities and quite a lot in energy.
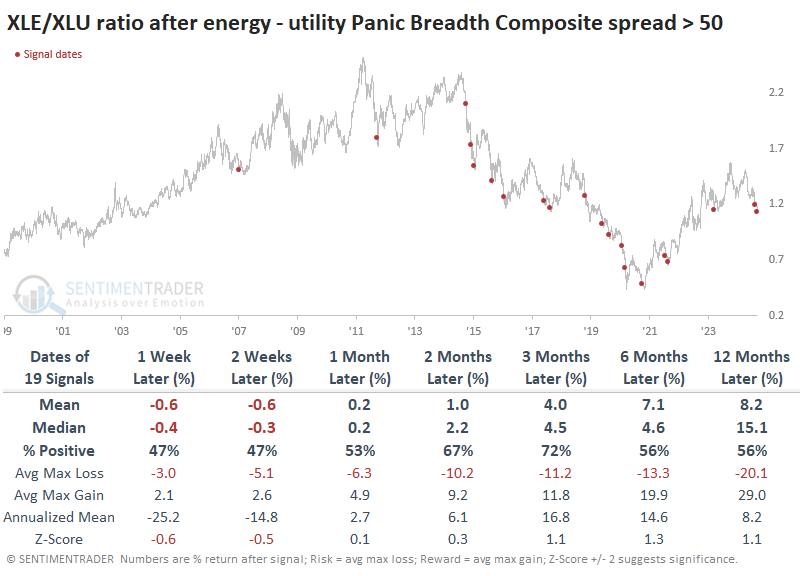
It was rare to see a spread this wide between energy and utility stocks prior to the past decade. It only happened twice between 1998 and 2014, both preceding a nearly immediate turnaround in the sectors' fortunes. The ratio of the XLE fund (energy) to XLU (utilities) quickly turned up and headed significantly higher in the months ahead.
Since then, it has been much more hit-or-miss, especially the tumultuous period before and after the pandemic. Since 2021, the relationship has been more mean-reverting after extremely wide spreads in the Panic Breadth Composites. The prior signal from August is showing a negative return, but that has not been an effective gauge of a longer-term mean-reverting probability.
Because these spreads tended to happen when investors were concerned about economic growth, among other worries, it's not a surprise that the broader market had often been weak when these signals were triggered. The S&P 500's returns following them were quite good, with only two small losses over the next six months.
New low in yields
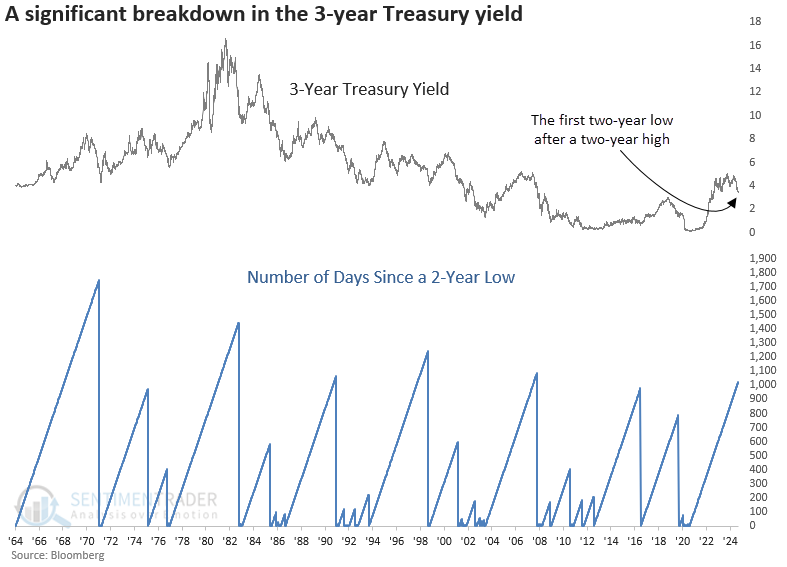
The 3-year Treasury yield closed at a two-year low for the first time since registering a two-year high. Dean showed that comparable breakdowns in the 3-year Treasury yield preceded additional downside pressure in yields.
On Tuesday, the 3-year Treasury yield fell to a new two-year low, ending the 6th longest winning streak in history without a multi-year low.
When the 3-year Treasury yield reached a two-year low for the first time following a two-year high, the short-term Treasury yield fell 67% of the time from one to twelve months later. With the 3-year Treasury yield falling to a two-year low as 11 interest rate hikes from the Federal Reserve remain in place, it begs the question: Is the Federal Reserve behind the curve?
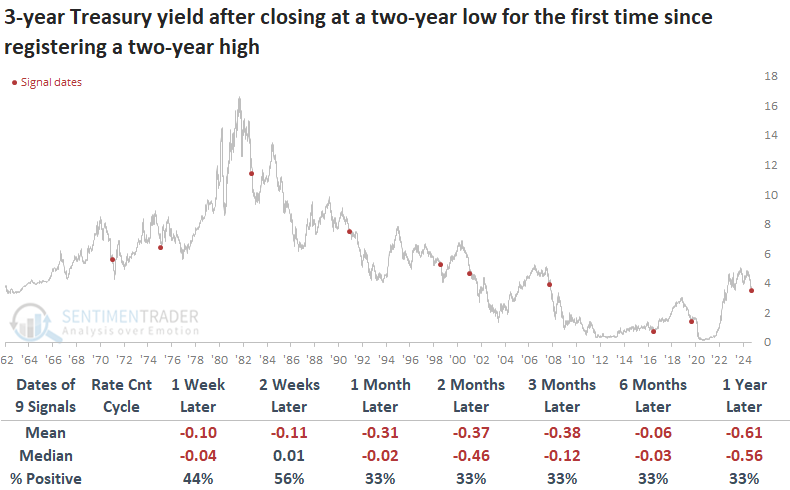
Although the 10-year Treasury yield was lower 67% of the time over the following year, the downward trajectory for the benchmark yield did not follow a consistent path like the 3-year Treasury.
Over the subsequent month, the S&P 500 and many cyclical sectors delivered lackluster returns, whereas defensive groups displayed gains. However, six to twelve months later, the cyclical sectors reversed, taking the lead over defensive stocks.
Energy and industrial metal commodities displayed muted to negative returns over medium and long-term horizons. Although gold is not included in the commodity table, an assessment of the precious metal did not provide a bullish or bearish edge.
Bullish bond signal
Jay similarly noted that a simple signal model recently generated a favorable signal.
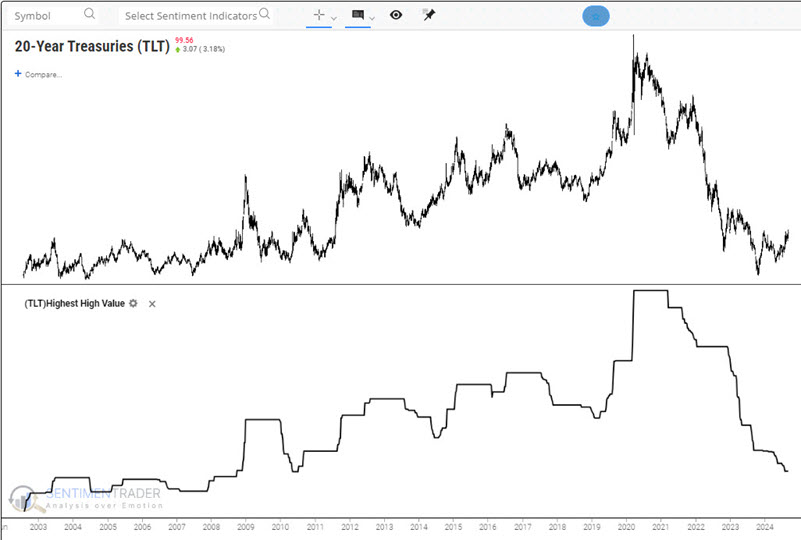
For this, we will use weekly data for ticker TLT. A simple favorable trigger occurs when TLT makes a one-year high during the current week for the first time in 13 weeks. When this occurs, but TLT at the close of trading that week and hold for 13 weeks.
The chart below displays a weekly chart for TLT at the top and the 52-week high at the bottom. We are looking for those times when the 52-week high value ticks higher for the first time in at least 13 weeks. A new signal will occur at the end of this week on 2024-09-13.
We do not specifically recommend using this model as a mechanical trading system. That said, let's consider the historical hypothetical results from doing so.
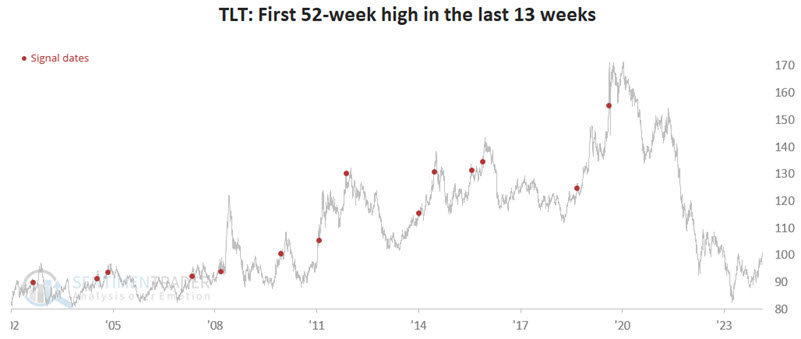
The chart below highlights signals using this simple method. A new red dot will occur on 2024-09-13. The two to three month timeframe appears to be the "sweet spot" regarding performance.
A new low in oil, too
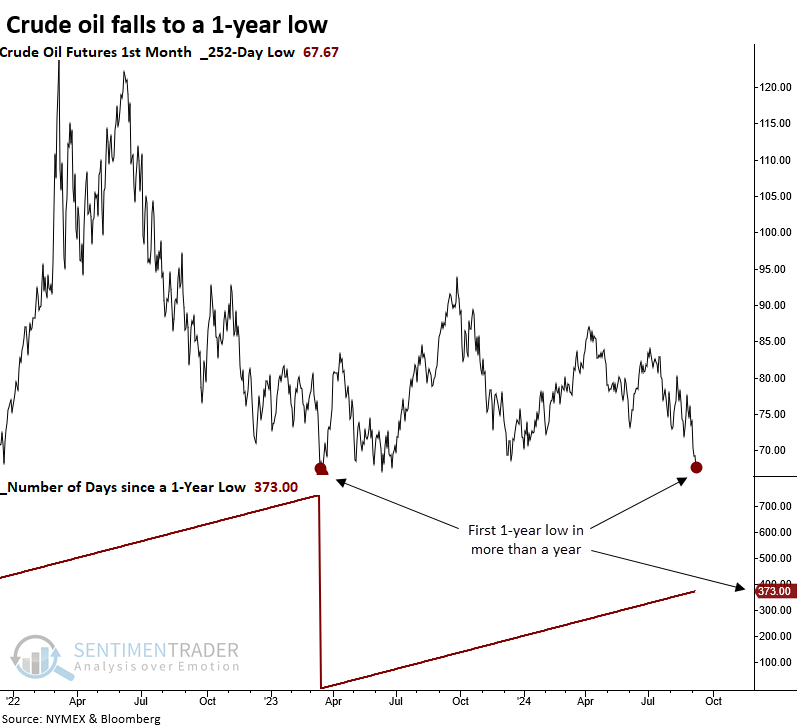
Crude oil closed at a 1-year low for the first time in over a year. Dean showed that similar price patterns suggest the commodity could stagnate over the subsequent six months.
Crude oil, a critical global commodity known for its influence on economic trends, hit a 1-year low last week for the first time in more than a year. The previous instance led to a rebound. However, the rally was capped, and oil has been consolidating in an extensive range, with the commodity now pressing near the lower boundary.
When crude oil reaches a 1-year low for the first time in a year, it often shows a mild tendency to rebound over the subsequent weeks, rising in 12 out of 17 cases. However, oil's performance over the next six months, while slightly better than a coin toss, was not without risk. At some point during this time frame, the commodity displayed a loss in 13 out of 17 instances.
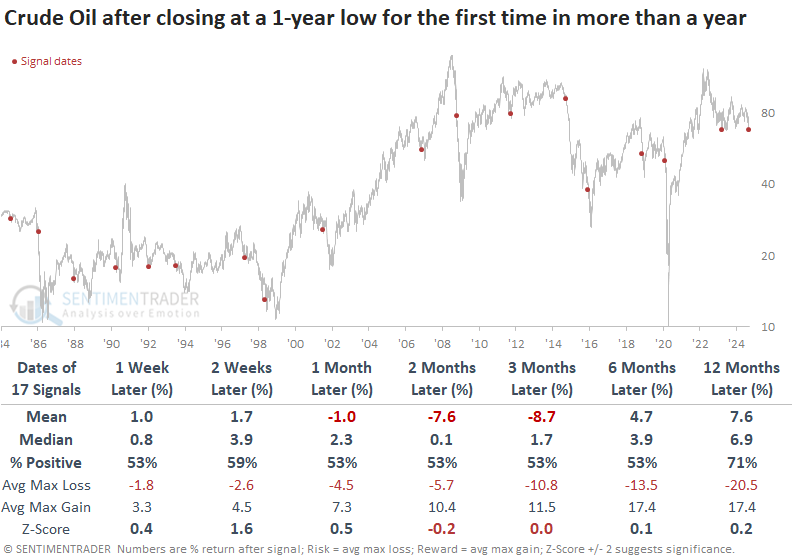
Over the next six months, the signal encountered a maximum loss exceeding -5% in 12 out of 17 cases and -10% in 11 out of 17 occurrences. Furthermore, the average maximum loss almost equaled the maximum gain at the three-month interval.
The S&P 500 Energy sector underperformed the S&P 500 in six out of seven intervals. As one might expect, Consumer Discretionary stocks benefitted the most from the one-year low in crude oil, outperforming the broad market across all time horizons. Moreover, a year later, it was the best-performing group.
Bearish beans
Soybean seasonality in the middle of a period of historically consistent price weakness. Jay suggested that a trader needs a solid reason to risk holding a long position in beans during the upcoming period.
Each year, as soybean harvesting season begins in the U.S. Midwest, little doubt remains about the state of the crop harvest. It is either good, bad, or somewhere in between, but the critical point is that the state of the crop harvest is a known quantity. As a result, whatever risk premium has been built in typically is shed during this September/early October period.
Beans are about to enter another period of typical price weakness that extends from the close on Trading Day of the Year (TDY) #176 through TDY #191. For 2024, this period extends from the close of 2022-09-12 through 2022-10-03.
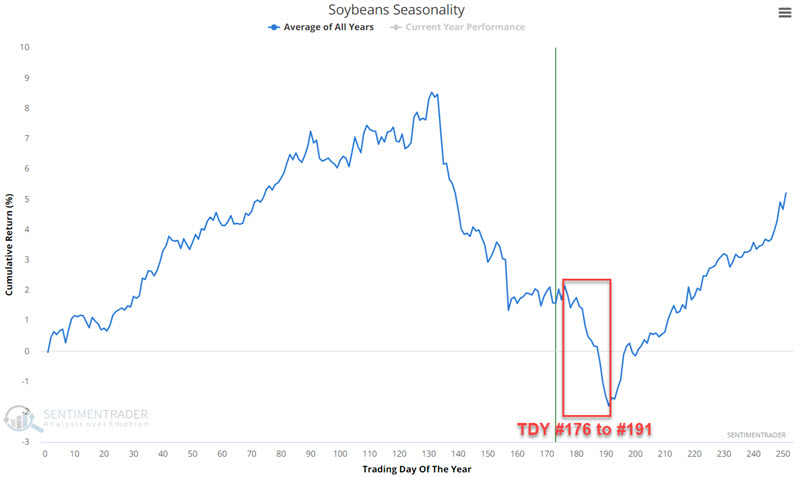
The chart below displays the cumulative $ +(-) for soybean futures held long only during Trading Day of Year #176 through TDY # 191.
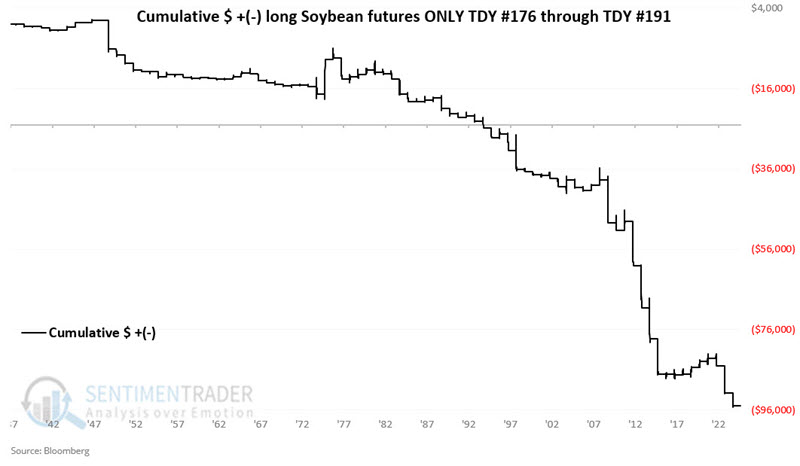
These windows showed a gain only 32% of the time since 1937, with an average loss about twice as large as the average gain. Even worse, the contract suffered a -$12,000 or larger loss during twelve years while rallying more than +$12,000 only once.
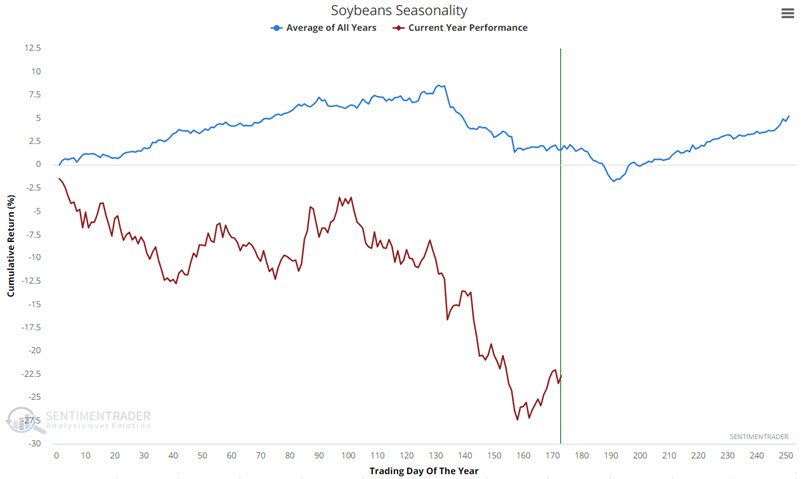
The chart below compares soybean's annual seasonal trend to actual price action so far this year. Even the typically favorable early part of the year failed to show any strength.
About TradingEdge Weekly...
The goal of TradingEdge Weekly is to summarize some of the research published to SentimenTrader over the past week. Sometimes there is a lot to digest, and this summary highlights the highest conviction or most compelling ideas we discussed. This is NOT the published research; rather, it pulls out some of the most relevant parts. It includes links to the published research for convenience, and if you don't subscribe to those products, it will present the options for access.