
TradingEdge Weekly for Sep 1 - Fewer oversold stocks, rising Treasury yields, bad bond sentiment, China negativity

Key points:
- Sectors are losing medium-term uptrends in a long-term uptrend
- Oversold conditions among S&P 500 stocks are dwindling
- Overbought conditions are also dwindling
- The VIX closed below 14 in August...potential path for year-end
- Leveraged ETF traders have reversed from extreme pessimism
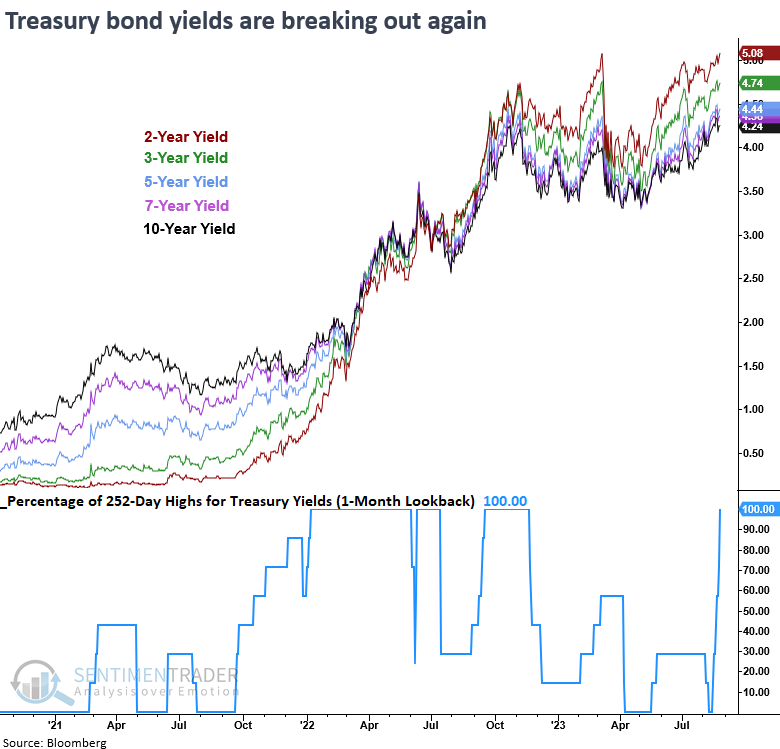
- Every Treasury rate across the curve has hit a one-year high
- The biggest hurdle to even higher rates may be sentiment that is already stretched
- News articles are showing a decade-long record in negativity on China
Medium-term downtrends within a long-term uptrend
As long as the market indexes remain below their July highs, the risk of a further decline remains, particularly during the late-August to mid-October period. Still, Jay noted that several objective indicators have flashed favorable signals of late.
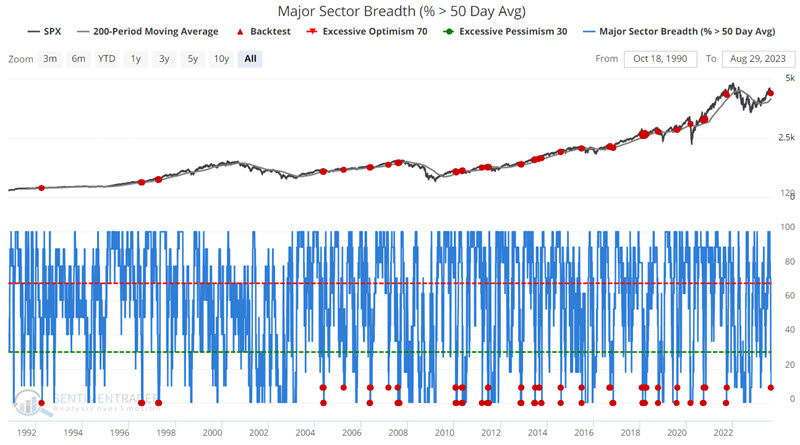
The Major Sector Breadth (%>50 Day Avg) measures the percentage of 11 major sectors trading above their 50-day moving average. A decline to a low level can signify a potential buying opportunity in the market. However, it is typically more advantageous in an already established price uptrend.
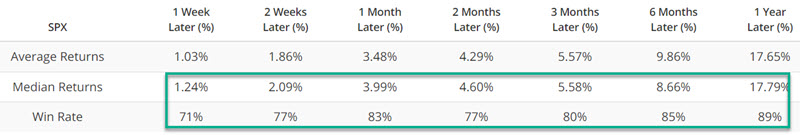
The chart below highlights all dates when the Major Sector Breadth (%>50-Day Avg) indicator was below 10% while the S&P 500 Index closed above its 200-day moving average. Returns were consistently positive across time frames, with impressive average returns.
To understand why the underlying trend is important, the chart below displays all dates when the Major Sector Breadth (%>50-Day Avg) indicator was below 10% while the S&P 500 Index closed below its 200-day moving average.
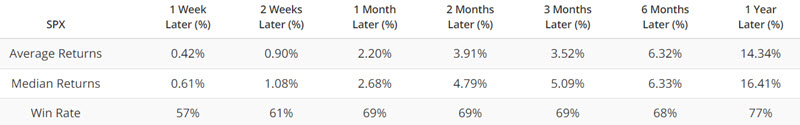
Note that results aren't "bad," they are just inferior almost the board to results when the S&P 500 Index is above its average. Also, during significant bear markets (2000-2002, 2007-2009, 2022), failed signals keep piling up.
Oversold conditions are dwindling
Even though sector uptrends are getting scarcer, Dean showed that the percentage of oversold stocks cycled from greater than 65% to less than 20% in seven sessions.
The recent pullback in the S&P 500 appears to be a routine correction, with the index falling almost 6% on a peak-to-trough basis. Shallow drawdowns are typically associated with oversold conditions from short-duration breadth-based indicators. One short-duration indicator that reached a washed-out status is the percentage of oversold stocks. This breadth-based time series measures how many issues have fallen below a reading of 20% using a 14-day stochastic.
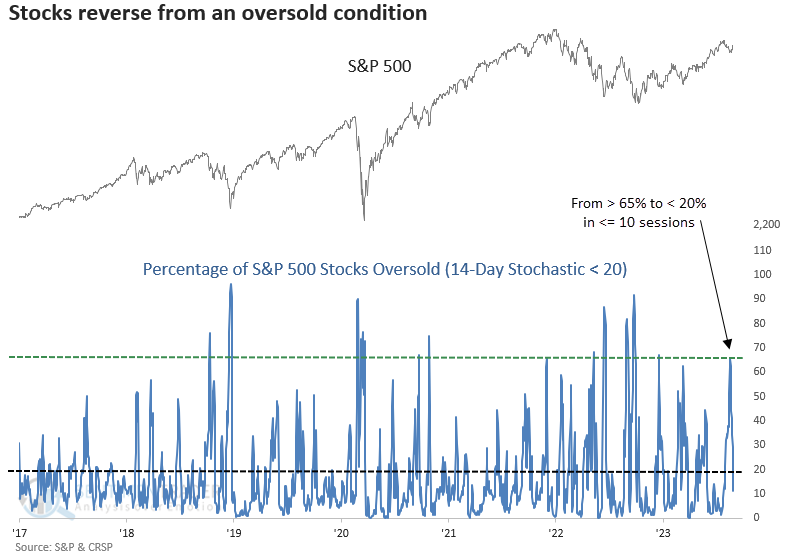
When the percentage of oversold S&P 500 stocks (14-day stochastic) cycles from greater than 65% to less than 20% in ten or fewer sessions with the S&P 500 above its 200-day average, the world's most benchmarked index tends to reestablish its uptrend. Over the next two months, the S&P 500 was higher at some point in 39 out of 41 precedents.
Suppose we examine precedents after the 1929-42 secular bear market. In that case, the results are more favorable. Over the next two months, the S&P 500 was higher at some point in all but one case.
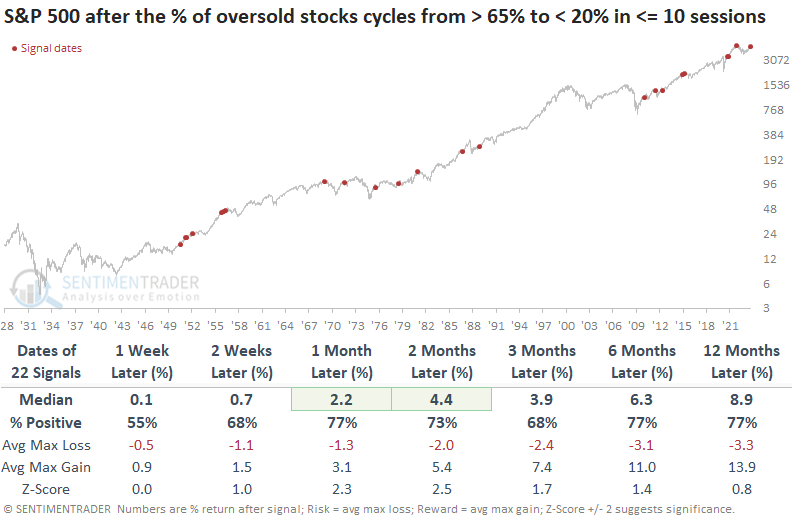
Since 1950, only one precedent resulted in a max loss of greater than -10% over the subsequent two and three-month time horizons.
Overbought conditions are also dwindling
Just as oversold indicators are becoming less common among stocks, so are overbought conditions. Jay showed that the percentage of S&P 1500 stocks with a Relative Strength Index above 70 just went to zero.
The chart below displays all days when this indicator stood at 0% - not a single stock among the S&P 1500 constituents showed a 14-day RSI reading above 70.
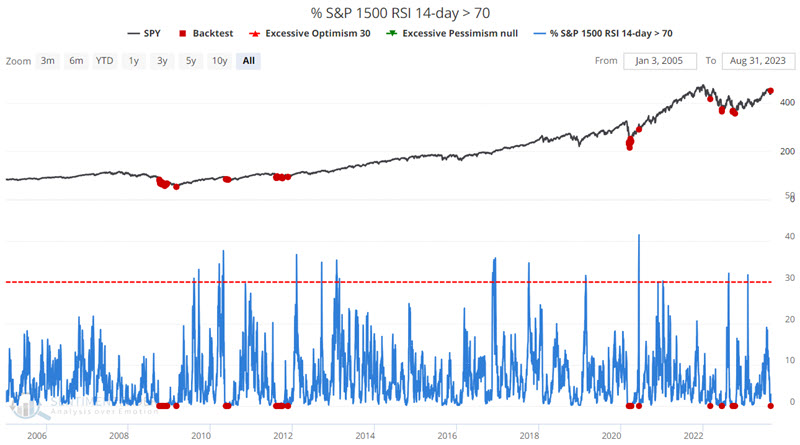
Overall results are favorable; however, these signals can be early if the market is in the middle of a more drawn-out decline.
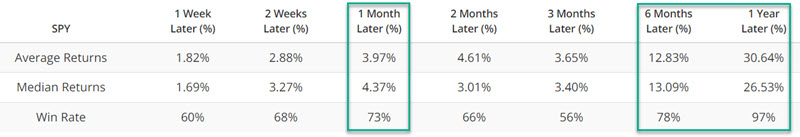
One alternative is waiting for this indicator value to rise above 0. The table below summarized S&P 500 performance after all days when this indicator rose above 0% after first touching 0%.
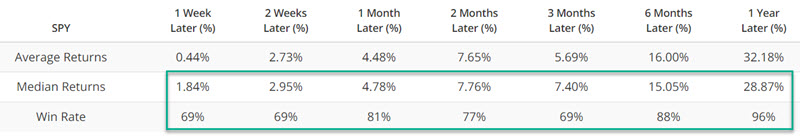
The results are better virtually across the board, but not by a lot, and a continuation of a given decline can occur, as seen in 2008, 2011, and 2020. Still, either of the signals above generally serve as:
- An alert to short-term traders to look for a buying opportunity
- A signal for long-term investors to consider putting cash on the sidelines to work in the market
Low volatility in August
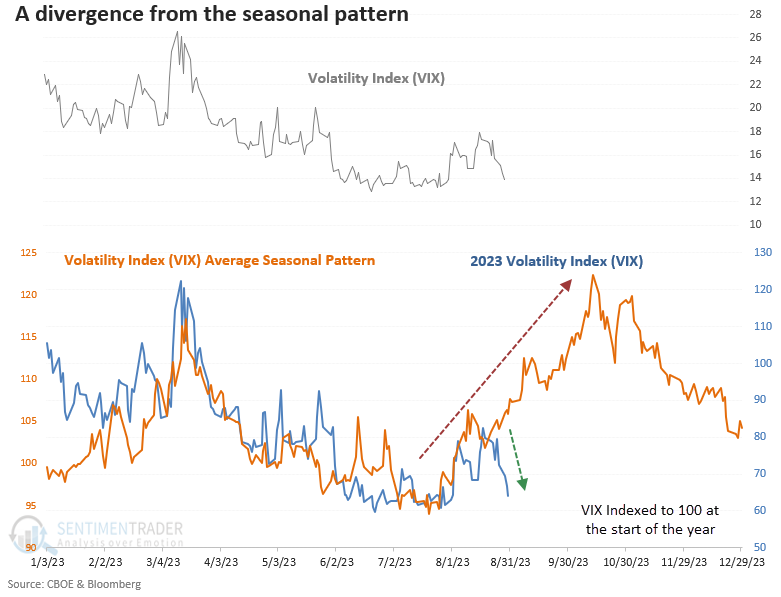
The Volatility Index (VIX) diverged from its seasonal pattern and closed below 14 in August. Dean noted that similar contractions in volatility resulted in an 89% win rate for the S&P 500 over the next month.
While the VIX bottomed near the annual seasonal low since 1990 and rose in unison with historical trends, its trajectory took a notable turn in recent weeks, plummeting below 14 on Wednesday.
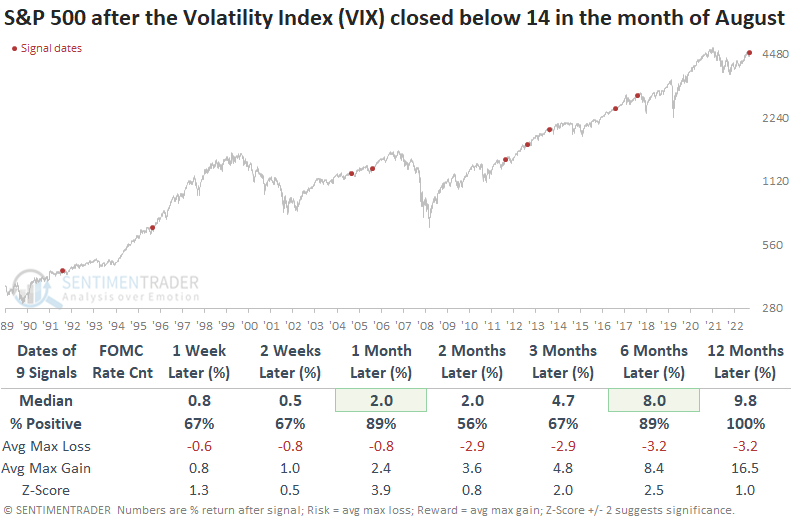
When the Volatility Index (VIX) crossed below 14 in August, the S&P 500 rallied 89% of the time over the subsequent one and six-month periods. A year later, the large-cap index was higher every time despite several precedents that coincided with FOMC tightening cycles. Over the next two months, the max loss never exceeded -4%. The August 2018 precedent is the only time a signal occurred ahead of a significant decline. Still, the S&P 500 gained 3.2% before peaking.
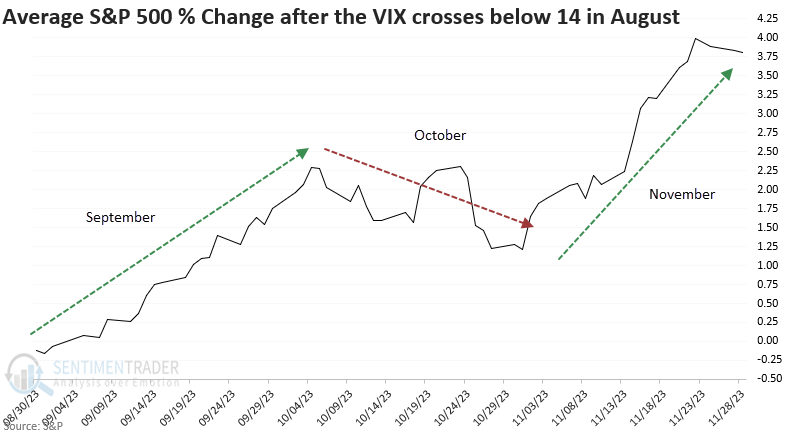
When the Volatility Index falls below 14 in August, the S&P 500 tends to rally in September, consolidate/correct in October, and rally again in November. So, the traditional seasonality trends for stocks might play out differently than expected.
The fear gauge for various asset classes continues to hover near the lower end of their respective 1-year ranges, denoting a bullish backdrop for risk assets like stocks.
Leveraged ETF traders reverse from extreme pessimism
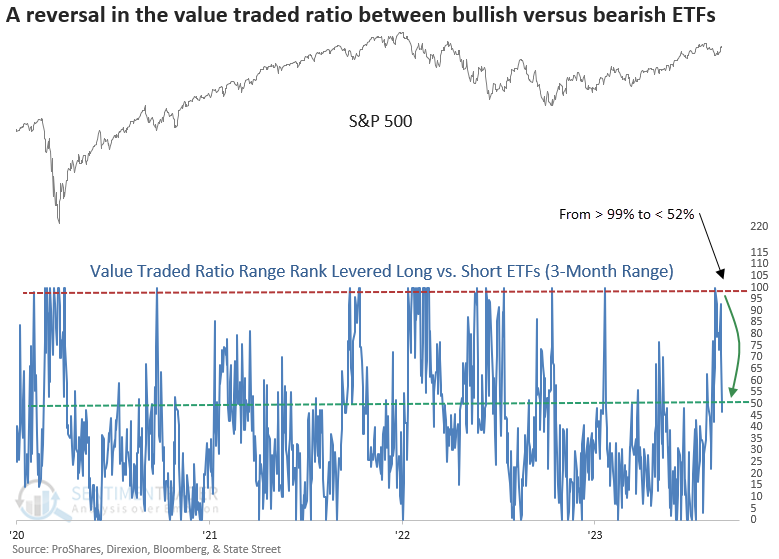
Dean showed that the value traded ratio range rank for levered long versus short ETFs reversed from a pessimistic condition. After similar shifts in investor sentiment, the S&P 500 rallied 83% of the time over the next two months.
By summing the value traded for 2x and 3x levered long and short ETFs and calculating the ratio between traders that are bullish versus bearish, we can gauge market sentiment. To capture the prevailing swings in market psychology, Dean created a model that applies a 3-month range rank to the value traded ratio between levered long versus short S&P 500 ETFs. When the range rank increases to the 99th percentile, indicating pessimism, and reverses below the 52nd percentile, the system triggers a buy alert as long as market momentum is positive.
When the value traded ratio range rank for levered long versus short ETFs reverses lower after reaching a pessimistic condition, returns, win rates, and z-scores for the S&P 500 are excellent across all time horizons.
When the S&P 500 maintained a bullish position above its 200-day average, the value traded range rank signals consistently demonstrated outstanding results across all time frames.
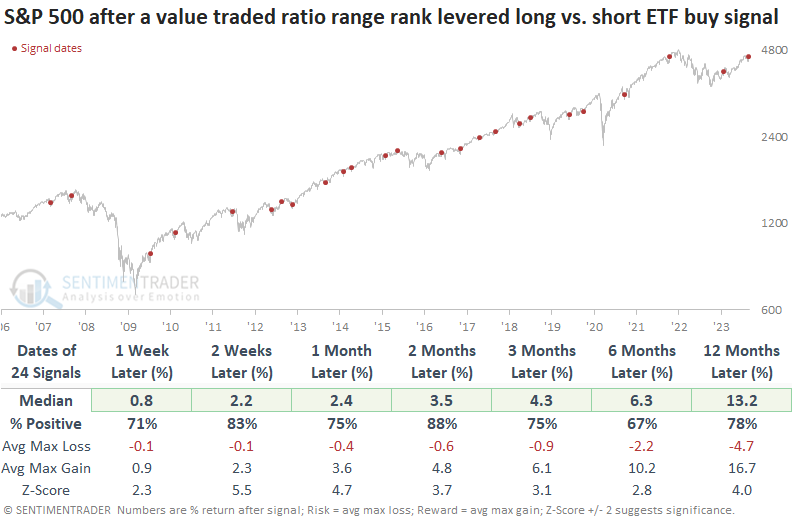
Signals that occurred in an uptrend were less likely to show a meaningful drawdown. Over the course of the next two months, there was only one instance where an alert displayed a max loss greater than -5%.
Higher rates across the curve may be a headwind
Dean showed that every single Treasury yield, ranging from two to ten years, closed at an annual high in the last month. Similar breakouts led to upside follow-through for rates, and stocks tend to struggle.
In 2022, the yield curve breakout signal created a significant headwind for stocks, especially for hyper-growth Technology-oriented ones. One difference between now and then is that the FOMC is closer to the end of its tightening cycle rather than the beginning.
When every single Treasury yield ranging from two to ten years registers an annual high in the last month, yields across the curve tend to rise further over the next month and from six to twelve months later, short-duration yields like the two and three-year were more likely to continue to rally.
When rates across the curve break out in unison, stocks struggle over short and medium time frames. Over the next three months, the S&P 500 was negative at some point in all but one case.
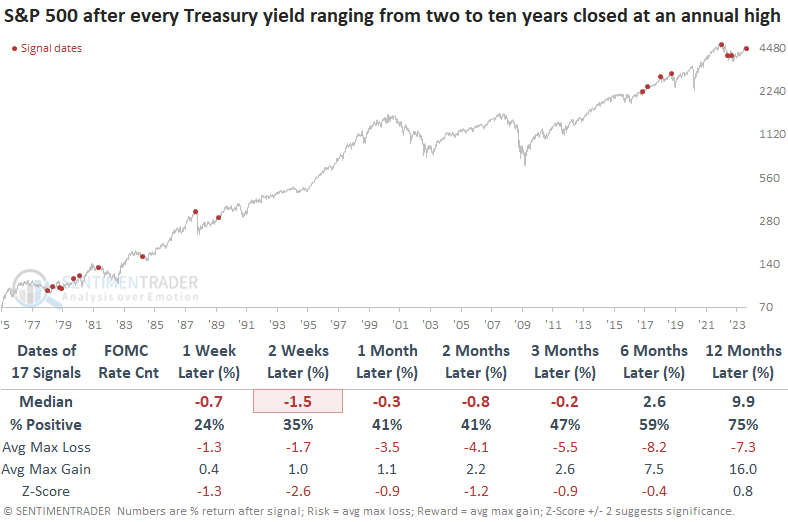
Defensive sectors like Staples, Health Care, and Utilities outperformed in the first three months. As expected, higher rates impacted industries like Autos, Consumer Durables, and Retail.
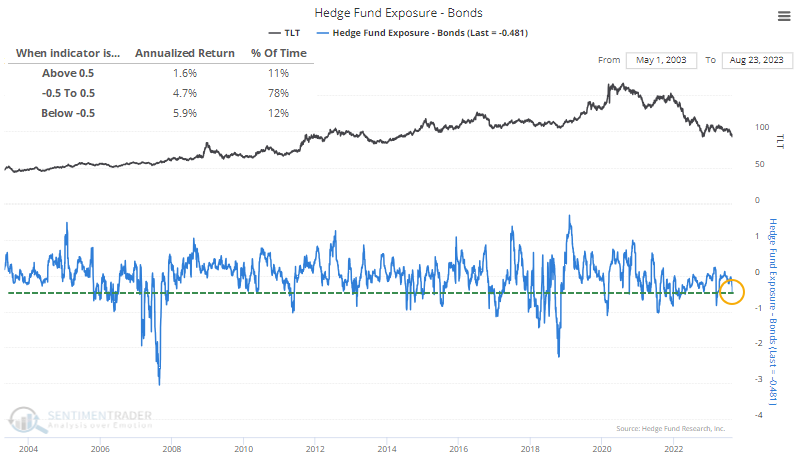
A wrinkle in the rising-rate debate is already-extreme sentiment
From a price momentum point of view, rates look set to continue higher, as noted above.
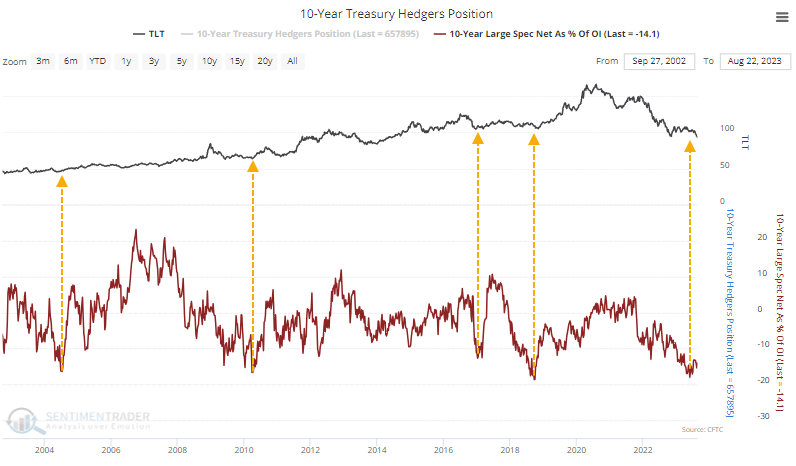
Hedge funds seem to be anticipating that exact thing, as they are quickly scaling back their exposure to bonds. It's close to getting close to -50% exposure, which has preceded above-average annualized returns in TLT.
That coincides with what has been drastic short positions against 10-year Treasury futures. Speculators are holding about 14% of open interest in the contracts net short, which has occurred near troughs in TLT.
In the other leveraged market, options, the 50-day average put/call ratio in 10-year notes is rising from one of its lowest levels ever. However, the options market in bonds does not act like that in stocks. High readings (heavy put activity relative to calls) is a reliable bottom signal in stocks, but not for bonds, and vice-versa.
Switching to TLT itself, the Open Interest Put/Call Ratio is similarly low, showing a historically low level of open interest in put contracts relative to call contracts. While contrarians want to consider this a sign of optimism, it has been misguided. Most of the bottoms in TLT have occurred when the open interest ratio was very low.
Traders have been leaving the ETF in droves lately, after a brief bout of apparent optimism. The 20-day average fund flow is now an average outflow of more than $75 million per day.
Because stocks had been doing well until recent weeks, and bonds have not, the Stock/Bond Ratio was stuck at a very high level and has just started to reverse. The Backtest Engine shows that when the 50-day average of the ratio began to curl lower after a very high reading, it preceded six-month gains for TLT each time.
Among other worries is seasonality, which is about to turn decidedly negative for TLT. Bond futures contracts and other fixed-income ETFs show mostly the same pattern, with a traditional rough stretch during September/October. Maybe as a consolation, 2023 hasn't exactly abided by the annual pattern, with steep losses during what had been its most consistently positive time of year.
Good luck finding a positive spin on China
Finding a mainstream financial news article about China with a positive spin is nearly impossible. It seems to be literally impossible, actually, and not only for a positive overall vibe - just a positive mention of anything whatsoever. That's particularly the case in Western media and especially those that are U.S.-based.
This isn't just subjective. According to the Bloomberg database of news articles across all sources dating back a decade, there has never been a week with more negative news articles about the country as a percentage of all articles. We used the following terms: weak, warning, risk, problem, struggle, worse, fall, gloom, disappoint, contagion, loss, negative, and slump.
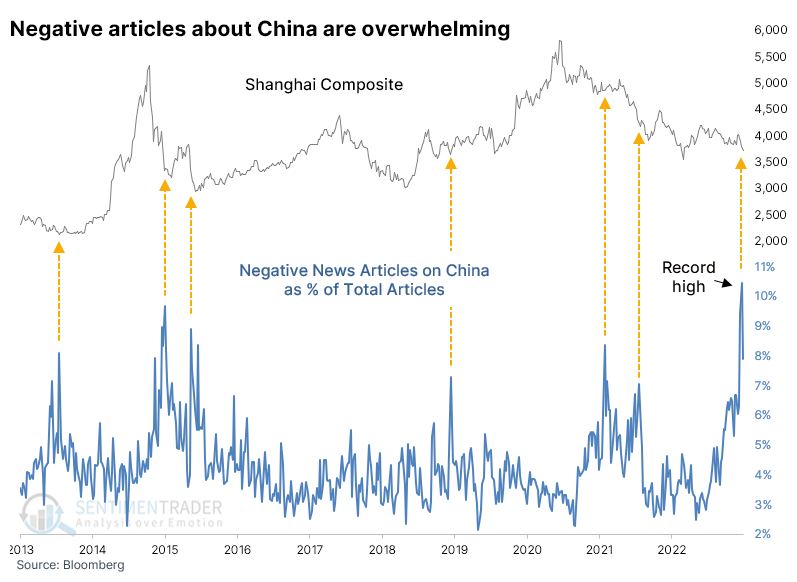
The only other time period that came close was the last week of August 2015, also a time of great turbulence in that market that was met with similar policy responses.
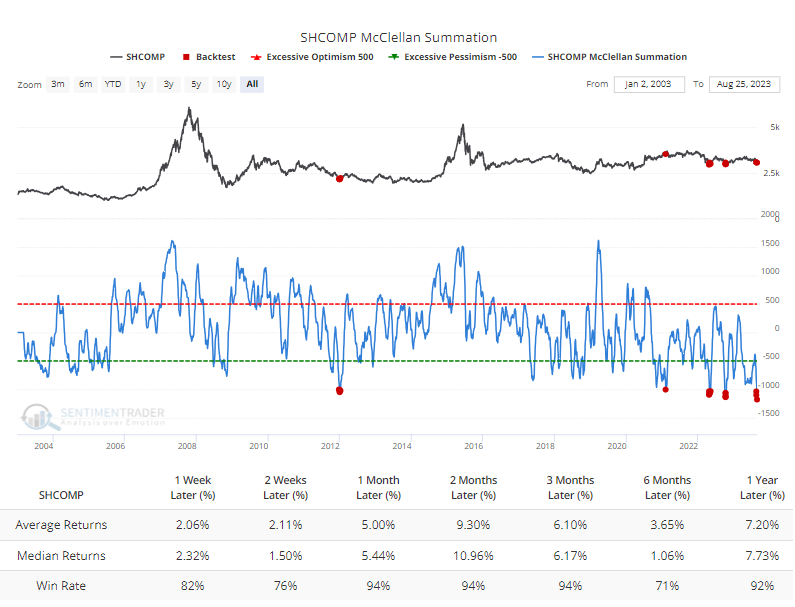
The persistent and severe selling pressure pushed the McClellan Summation Index for the Shanghai Composite to a record low in recent days. The Backtest Engine shows that after the few other times it crossed below -1000, the Composite had already suffered the worst of its losses for a while.
If we look at the index's forward returns after all days when the Summation Index was below -1000, there was only one loss over the next two months, in February 2021. That was kind of a weird one anyway, because the index was just coming off multi-year highs with severe internal deterioration, while this time the index has been melting for months, more like the other instances.
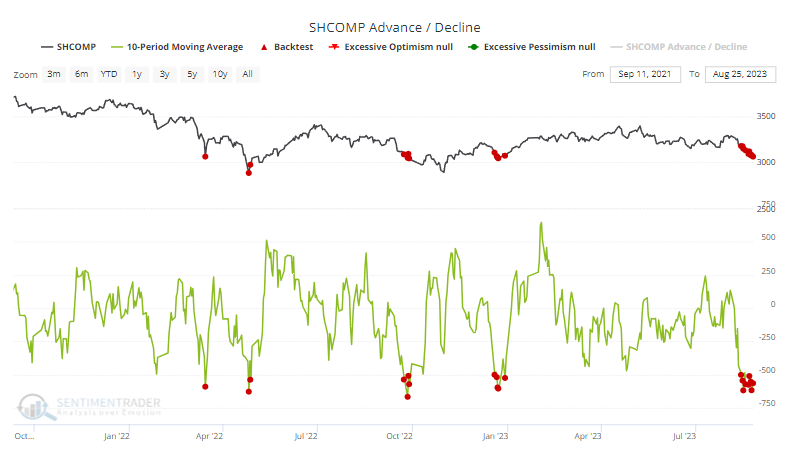
We can see just how severe and pervasive the losses have been lately by the advance/decline figures. Over the past ten sessions, an average of more than 500 more stocks in the Shanghai Composite declined than advanced. Just considering other instances since the market peaked in 2021, it rebounded each time after the others got this bad.
The Backtest Engine shows that even during this protracted bear market, the Shanghai rebounded each time over the next two months.
It's hard to be optimistic on any market when it is nigh on impossible to read anything with a positive spin. That's definitely the case for Chinese stocks in recent weeks, with a level of pervasive negativity perhaps never seen before. Selling pressure in the stocks has been heavy, though many breadth indicators aren't showing the level of panic of past lows. That could be either a good thing (stocks are holding up better than they should) or a bad one (sellers have not yet been washed out). A few indicators show historic extremes, which have preceded rebounds after similar behavior, but it's not a consensus.
About TradingEdge Weekly...
The goal of TradingEdge Weekly is to summarize some of the research published to SentimenTrader over the past week. Sometimes there is a lot to digest, and this summary highlights the highest conviction or most compelling ideas we discussed. This is NOT the published research; rather, it pulls out some of the most relevant parts. It includes links to the published research for convenience, and if you don't subscribe to those products, it will present the options for access.