
TradingEdge Weekly for Oct 4 - Broad momentum, utilities surge, S&P and gold winning streaks

Key points:
- The rally in stocks has broadened out, with the equal-weight S&P 500 and Russell 2000 showing impressive one-year gains
- A big drop on the first day of Q4 has been a good sign for the rest of the quarter
- The S&P 500's monthly winning streak is impressive and shows compelling evidence for bulls
- Almost all cyclical industries are above almost all their moving averages, a good sign for stocks
- Breadth of gains among stocks on the Hang Seng is historic
- Gold's 37 new highs in the past year suggest more gains before a meaningful reversal
- Utility stocks have been electric, but have trouble holding momentum
- The unfavorable seasonal window for soybeans has ended
A much broader surge
The 252-day rate of change for the equal-weighted S&P 500 cycled from below -15% to above 25%. Dean showed that similar price momentum upswings produced a 100% win rate for the equal-weighted index over the next year.
Two indexes that typically demonstrate strong price momentum early in bull markets but lagged during the 2022-23 shift from bear to bull have triggered positive long-term price momentum signals. Those indices, the equal-weighted S&P 500 and the Russell 2000, saw their respective 252-day rate of changes cycle from below -15% to above 25%.
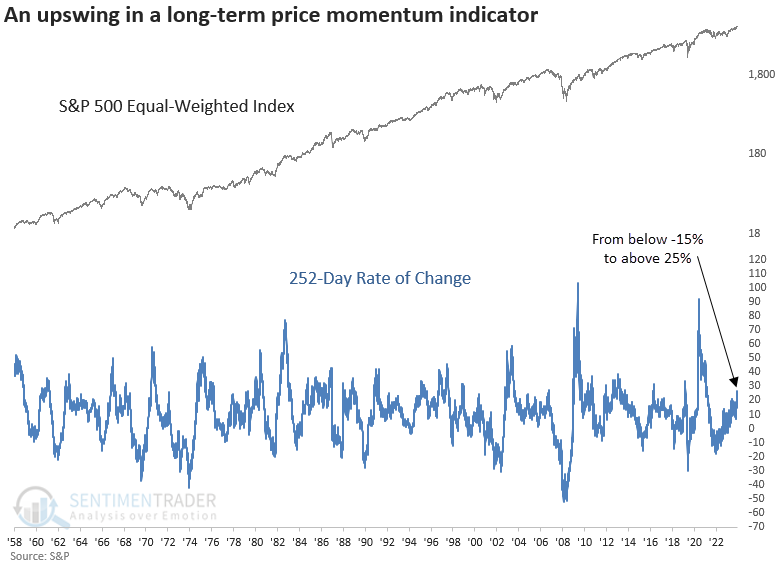
Whenever the 252-day rate of change for the equal-weighted S&P 500 index cycled from below -15% to above 25%, the index that weights each stock equally rose over the following year every time, indicating that positive price momentum tends to persist.
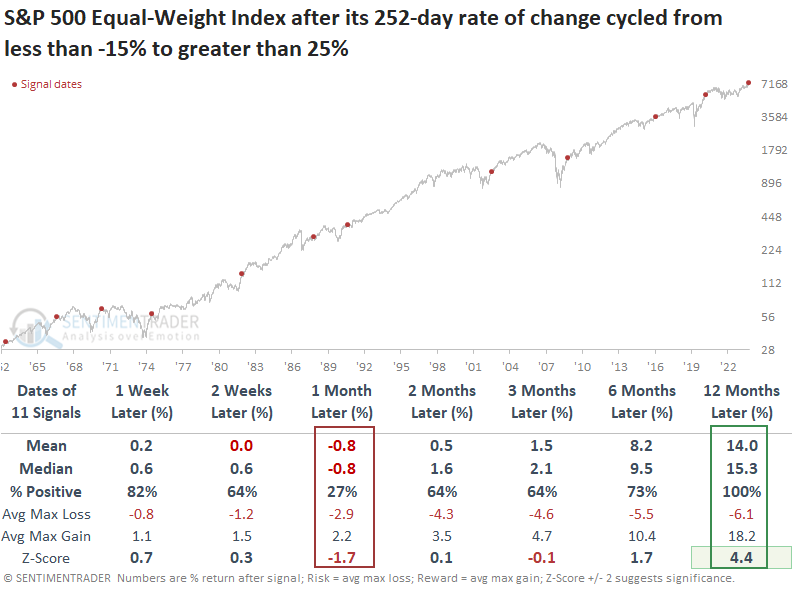
Following similar precedents, the equal-weighted S&P 500 index experienced only two maximum losses exceeding -10 %, both in the 1970s. The cap-weighted S&P 500 rose 100% of the time over the following year.
For only the 11th time since 1979, the Russell 2000, a popular small-cap stock index, also saw its 252-day rate of change transition from below -15% to above 25%.
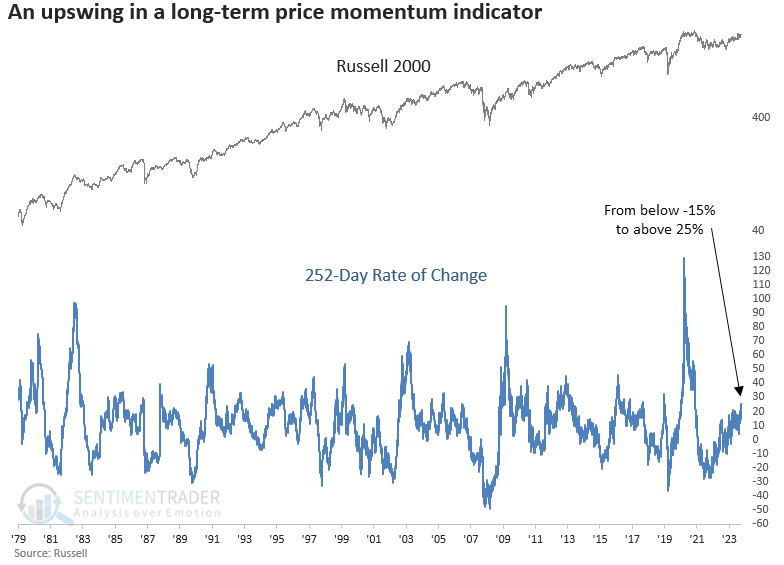
The Russell 2000, much like the equal-weighted S&P 500, saw a muted near-term outlook following bullish long-term price momentum signals, yet it advanced 90% and 100% of the time over the next six and twelve months.
First-day blues?
The first trading day of October has seen a large decline in the S&P 500 about 16% of the time. Jay noted that historically, this has not been a bad thing for stocks.
We will define a "bad" day as a day when the S&P 500 Index declines by -1% or more (it just missed it this year). In 69 years since 1955, the first trading day of October has had a "bad" day eleven times, or 16% of the time. If the S&P 500 loses -1% or more on the first trading day of October, we will buy the index at the close of that day and sell at the close of the last trading day of the year.
The chart below displays the hypothetical growth of $1 invested in the S&P 500 from the close of the first trading day of October through the end of December if the first trading day of October was down -1% or more.
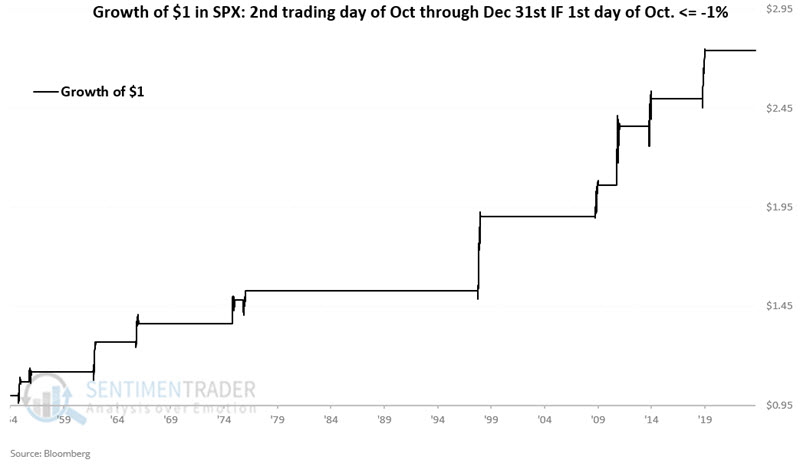
The S&P rose 100% of the time, averaging nearly +10% through year-end.
Again, it just barely missed the cut this year, but the concept holds that a bad first day of the quarter had no ill effects for the rest of the year - it was more of a contrary indicator.
An impressive winning streak
Jay further noted that the S&P 500 Index has closed higher during 8 of the first 9 months of 2024 and for the last five consecutive months.
The chart below highlights those times in the Post-WWII era when the S&P 500 Index closed higher during eight of the first nine months of the year (i.e., through the end of September).
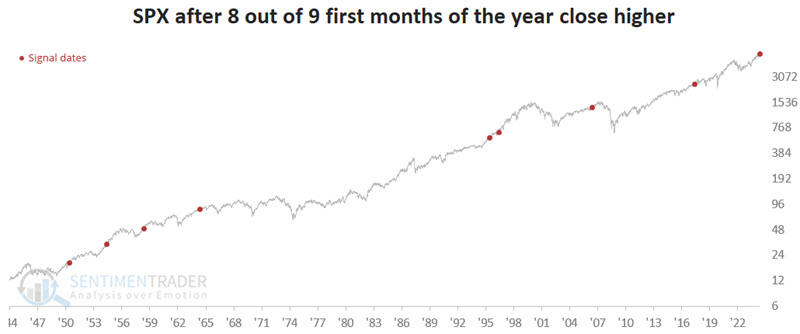
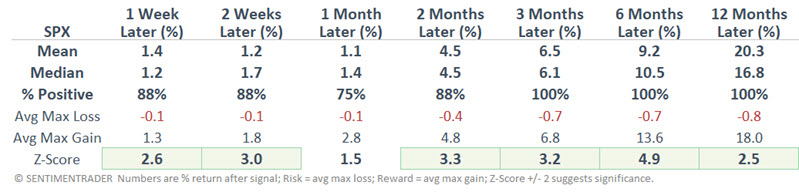
The key points in the table above are the high Win Rates and favorable z-scores across almost all timeframes. This does not guarantee a higher market in the months and years ahead, but it does serve as a reminder to give the bullish case the benefit of the doubt.
The S&P 500 registered a monthly loss during April 2024. Since then, it has registered five consecutive higher monthly closes. Intuitively, this causes many investors to presume that the market may be due for a pullback.
However, the chart below highlights those times when the S&P 500 closed higher for the fifth consecutive month, following a down month.
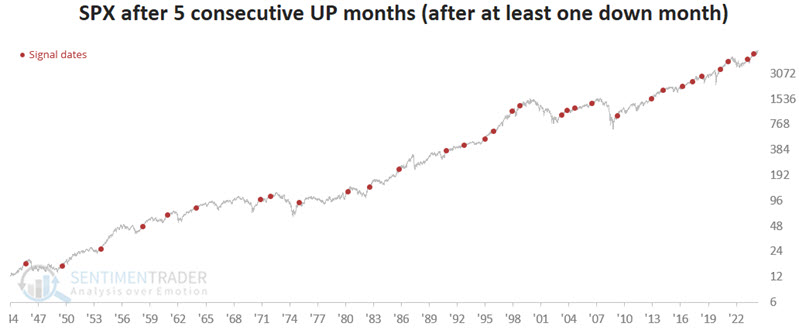
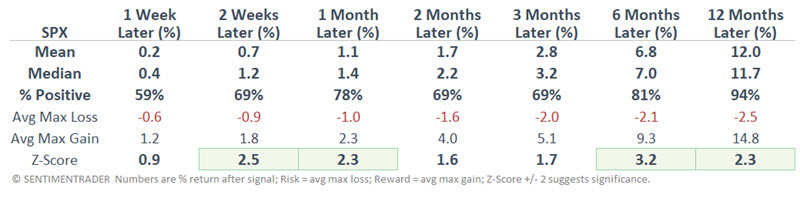
One caveat is that Median Returns are not spectacular. Nevertheless, the Win Rates (especially for six and twelve months) and decent z-scores again suggest that long-term investors continue to give the bullish case the benefit of the doubt.
Cyclical surge
Over 90% of cyclical industries are trading above their respective 10, 20, 50, 100, and 200-day averages. Dean showed that similar trends for economically sensitive stocks preceded solid returns and consistency for the S&P 500.
For the first time in over six months, 90% of cyclical sub-industry groups simultaneously closed above their respective 10, 20, 50, 100, and 200-day moving averages. This broad-based strength signals a resurgence in bullish trends, typically associated with sustained market rallies.
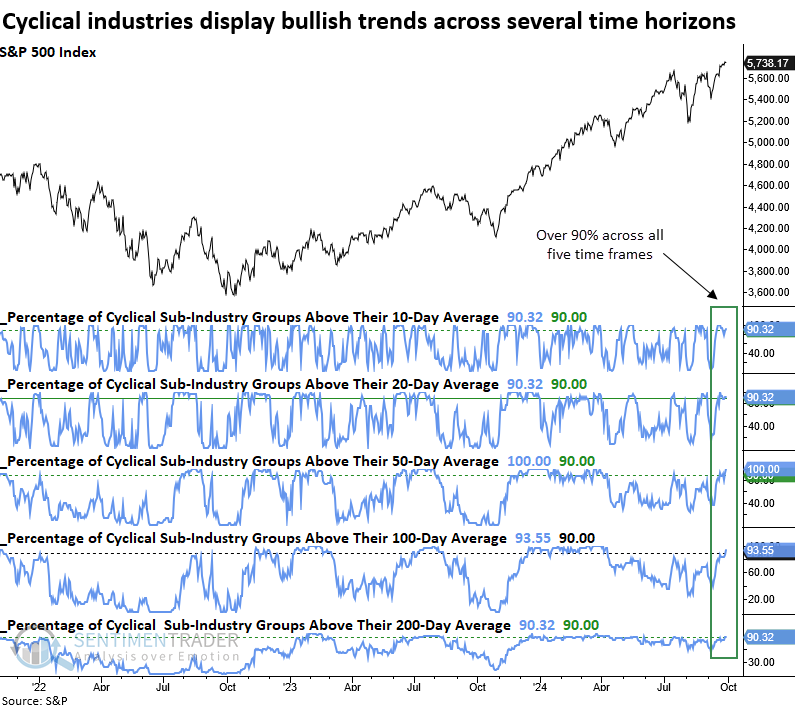
Since 1950, a 90% or higher reading across all five moving average horizons has never been observed at the peak of a significant bear market.
When 90% of cyclical sub-industry groups close above their respective 10, 20, 50, 100, and 200-day moving averages for the first time in six months, and the S&P 500 is within 2% of a five-year high, the world's most benchmarked index displayed solid returns and consistency across all time horizons.
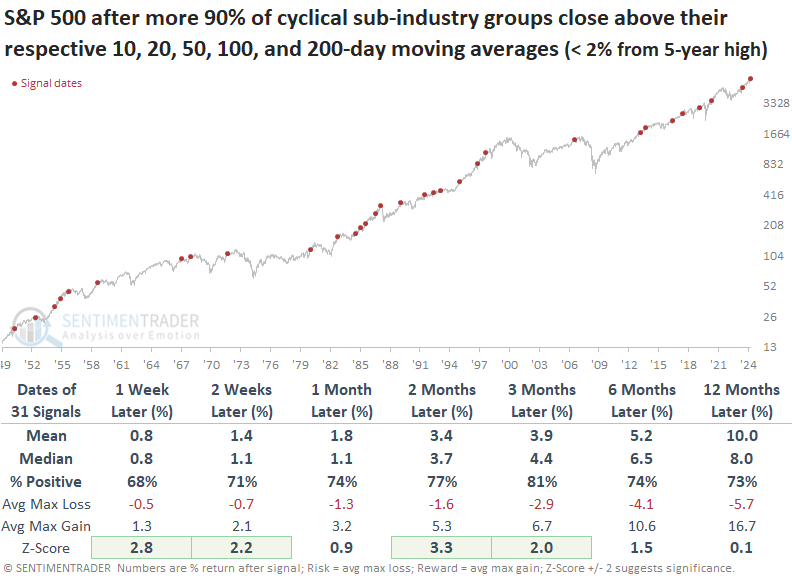
Following similar precedents, the S&P 500 experienced only one maximum loss exceeding -10%, and that instance was associated with the 1987 stock market crash. Growth-oriented sectors generally outpaced the S&P 500 over the subsequent year.
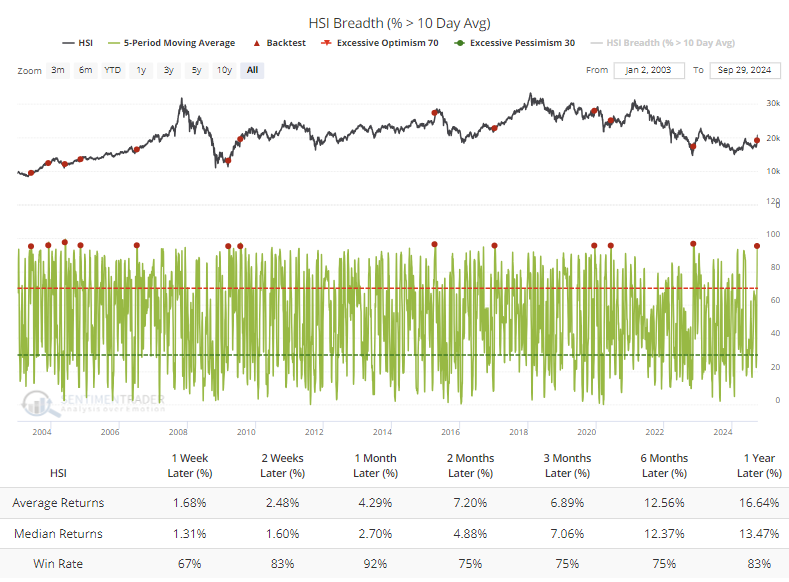
Green shoots in China
Since China had once again become the most hated market in the world in February, they've surged, purged, and then surged again. All of a sudden, they went from uninvestable to must-have.
The surge in the indexes was driven by across-the-board buying. For only the third time in more than twenty years, more than 70% of stocks in the Hang Seng traded above their volatility-driven Bollinger Bands. It's the same scenario when looking at the surge in stocks that reached an overbought condition - the current reading is the highest in history.
An average of more than 95% of stocks in the index were trading above their 10-day average during the week, the 2nd-most in four years. The only reading that exceeded the current one was the initial push from the November 2022 panic. In the month following other 5-day breadth surges, the Hang Seng continued to rally essentially every time.
Extending the time frame a little longer, there were more than three advancing stocks for every decliner during the past two weeks, again the highest in 25 years. Other times the ratio exceeded three-to-one, the Hang Seng struggled with gains over the next month, but the losses were small and preceded gains in the weeks and months after that.
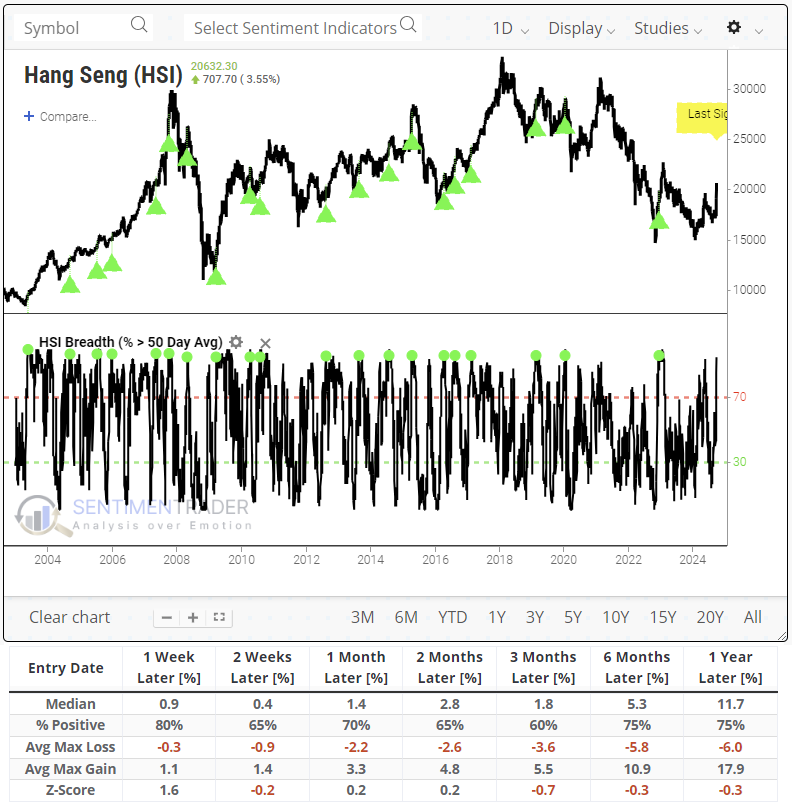
Lengthening the time frame still further, the percentage of stocks trading above their 50-day moving average cycled from below 15% to above 95%. Five failures among the signals occurred when the Hang Seng witnessed meaningful and protracted losses in the months ahead, but that means there were fifteen signals that either didn't see any losses or dips that were relatively minor and/or quickly erased.
On a still-longer time frame, the percentage of stocks above their 200-day averages cycled from fewer than 15% to more than 85% and the McClellan Summation Index has cycled from below -1250 to above 0. Unlike most global equity indices, the Hang Seng shows mixed returns when those long-term indicators cycle like this. There is no particular pattern to the returns, though every one since the pandemic has led to further gains over the next couple of weeks.
Our research during the periodic panics over the last couple of years showed a high likelihood of higher prices over a multi-year time frame, and that remains the case. Most of the Chinese stock indexes show a pattern of higher highs and higher lows, and sentiment has turned for the better. The stocks are still cheap on an absolute and relative basis, even after their week-long surge, but holders should recognize the risk of sharp and sizable pullbacks along the way.
Gold's many new highs
Despite a jump on renewed geopolitical tensions, gold didn't quite make it to another record high on Tuesday. Even so, it remains oh-so-close and on the cusp of adding to its 37 new highs in the past year, similar to a stretch in early 2020.
During the past 50 years, there haven't been many streaks like this, with most of them confined to the great bull runs of the late 1970s and early 2000s.
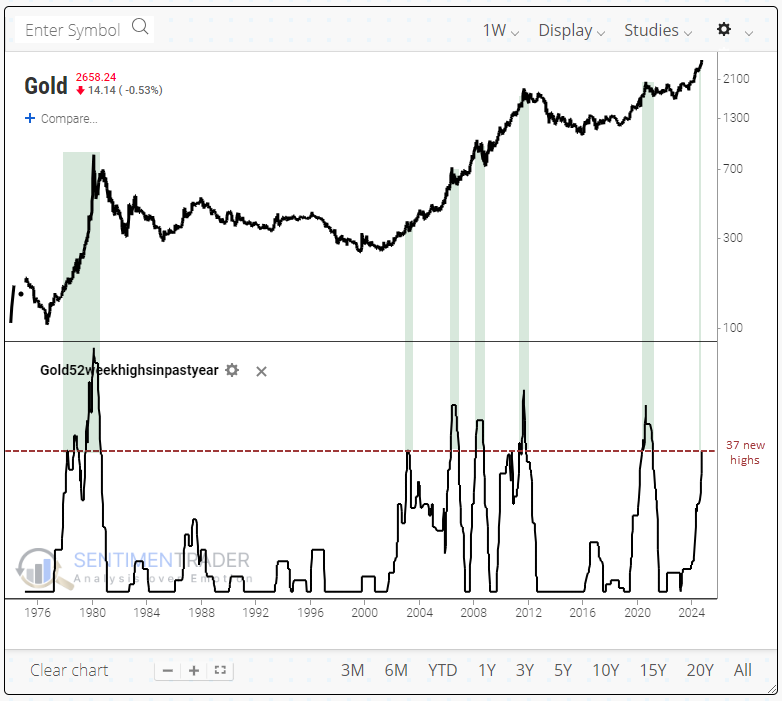
It's hard to tell from the chart, but by the time gold reached 37 new highs in a year, it was at or near a peak a couple of times, leading to double-digit drawdowns. As seen in the table below, that was more of an exception than a rule. It shows gold's returns once it reached its 37th 52-week high over a rolling 252-day period.
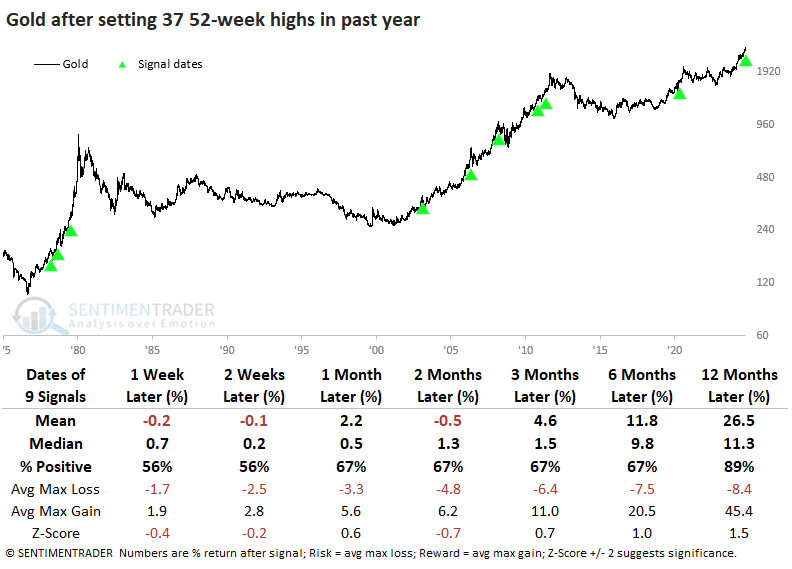
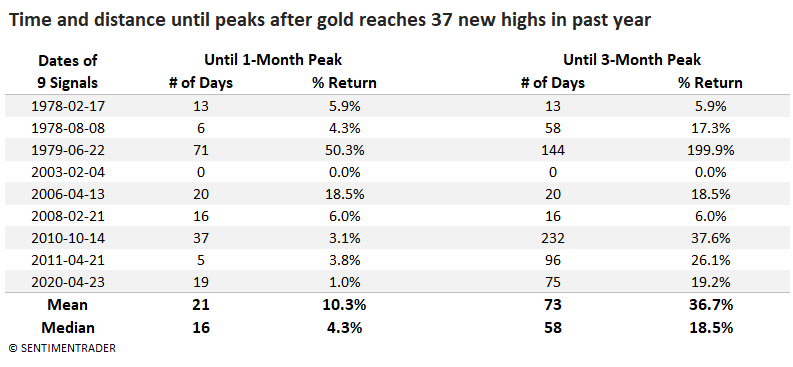
The table below shows how long it took and how much gold rallied before it carved out a 1-month and a 3-month peak. Gold rallied a median of 16 days and an additional +4.3% before it reached a one-month peak. Most of those were temporary peaks, however. It took gold a median of 58 trading days and a further +18.5 % gain before it reached a more meaningful three-month peak.
While the 2003 instance is troubling, the overall suggestion for gold investors is that there should be more gas in the tank before a substantial pullback. There are an innumerable number of trend-following systems to help determine when that exit signal might occur, but using a simple 50-day moving average proved to be an okay heads-up that the momentum had run its course.
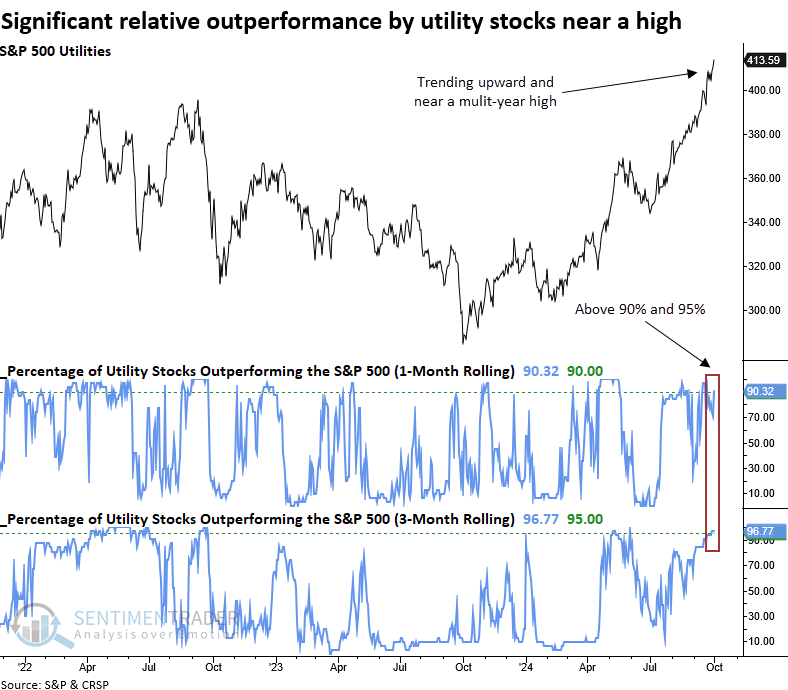
Utilities have been electric
Market breadth and relative performance indicators for utilities have reached a critical juncture. Dean noted that similar conditions suggest investors should be mindful that the sector could reverse to the downside.
The sector has reached a critical crossroads as several indicators suggest the group is overextended to the upside. One of those indicators is the percentage of S&P 500 Utility sector stocks trading within 5% of a 252-day high, which reached 96%. As illustrated in the following chart, readings above 95% produced annualized returns of -20% for the sector.
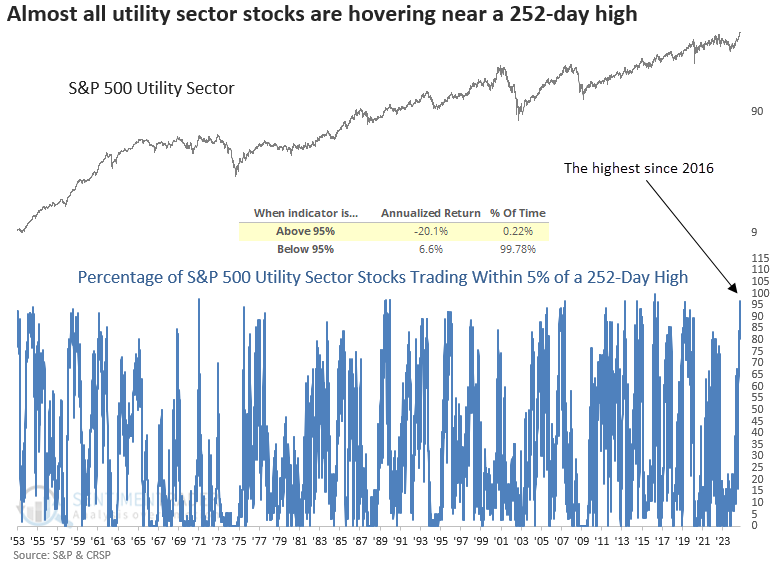
Whenever the percentage of S&P 500 Utility sector stocks trading within 5% of a 252-day high surpassed 95%, the extreme overbought condition was likely to mark the end of a favorable period for the utility sector. The situation was especially dire in the near term, with the sector declining 89% of the time in the subsequent month.
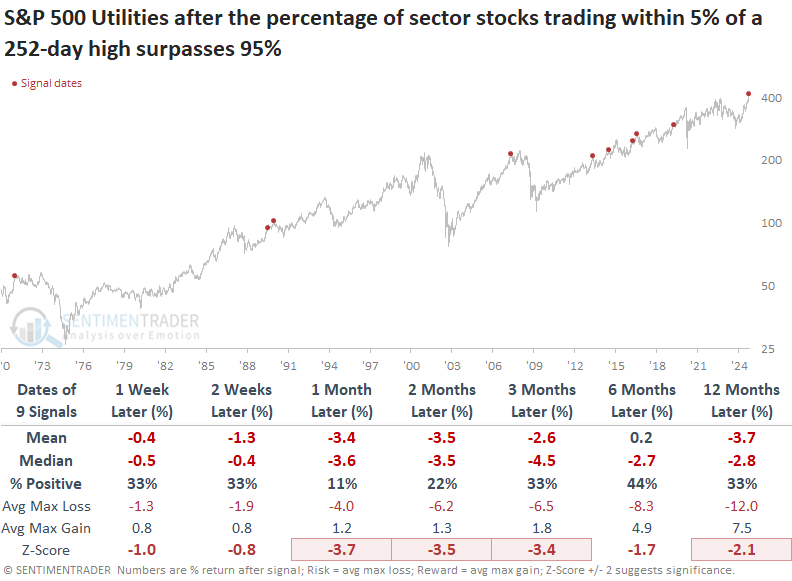
The average and median maximum loss exceeded the maximum gain across all time horizons, underscoring that risk overshadowed any potential reward.
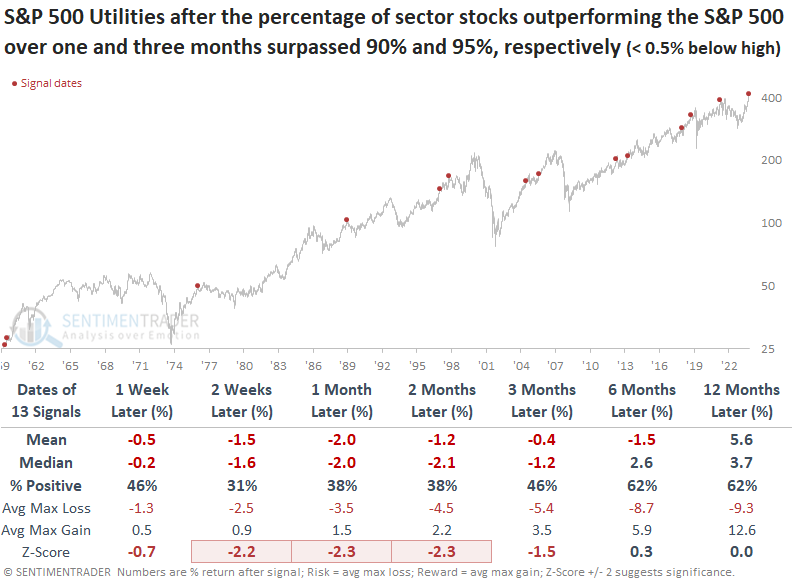
For only the 14th time since 1960, the percentage of S&P 500 Utility sector stocks outperforming the S&P 500 over one and three months surpassed 90% and 95%, respectively, as the sector closed within 0.5% of a 3-year high.
Following similar periods of relative outperformance by utility stocks, the S&P 500 utility sector tended to decline over the subsequent three months, with several time frames exhibiting significantly worse returns than random returns over the study period.
Setting sights on soybeans
Soybeans have experienced extreme price weakness in recent years. That said, Jay noted that the annual seasonal trend for soybeans now suggests that the worst may be over.
The chart below displays the annual seasonal trend for soybean futures. Note that there are essentially two distinct periods:
- Favorable from Trading Day of Year (TDY) #191 to TDY #131 of the following year
- Unfavorable from TDY #131 to TDY #191
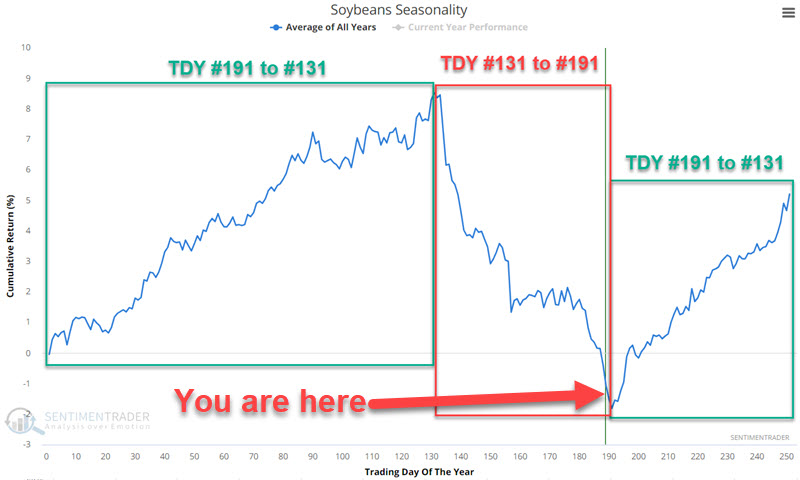
The unfavorable periods were positive only 25% of the time, with a median loss nearly double the median gain, and with an overwhelming tendency for larger losses versus large gains.
A favorable seasonal period begins at the close of TDY #191 and extends through TDY #131 of the following year, which starts at the close on 2024-10-03. The chart below displays the hypothetical $+(-) achieved by holding a long position in soybean futures only during these periods every year starting in 1937.
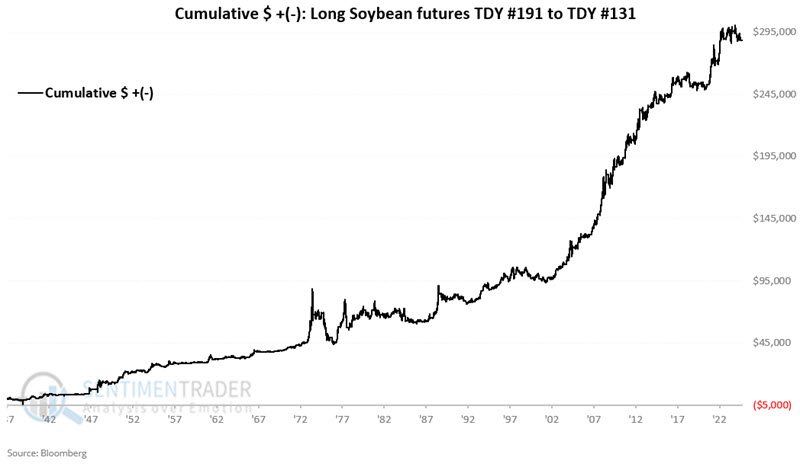
The favorable periods were positive 75% of the time, with a median gain more than twice as large as the median loss. The contract gained more than +$5,000 twenty-five times versus losing more than -$5,000 only four times.
Traders who wish to play the soybean market but do not want to trade futures contracts can buy shares of the Teucrium Soybean Fund ETF (ticker SOYB) just as they would buy shares of any stock or ETF.
About TradingEdge Weekly...
The goal of TradingEdge Weekly is to summarize some of the research published to SentimenTrader over the past week. Sometimes there is a lot to digest, and this summary highlights the highest conviction or most compelling ideas we discussed. This is NOT the published research; rather, it pulls out some of the most relevant parts. It includes links to the published research for convenience, and if you don't subscribe to those products, it will present the options for access.