
TradingEdge Weekly for Oct 27

Key points:
- This was a most unusual first year for a bull market
- More sectors are falling into bear markets
- The S&P 500 was stuck between widely-watched moving averages but failed to hold its 200-day
- More and more NYSE stocks are failing to hold their 200-day averages
- Fewer stocks in the S&P 500 are holding above their 200-day average while the index has only corrected mildly
- Maybe seasonality will help since stocks have already rallied
- Plus, we're still in the "mid-decade bulge"
- And we have an upcoming 5-day Power Period
- A couple of oversold signals for the Tech sector
- Basic Materials stocks have been hit hard
- The Gold/S&P 500 Ratio now favors gold
A most unusual first year
We've passed the one-year market of the October 2022 bottom, and there has been a drastic split between winning and losing sectors and factors, unlike pretty much any other bottom since 1928.
Technology, Communications, and Growth stocks are leading the returns since last year while pulling up the rear are Utilities, Consumer Staples, and Small Caps. The first group kind of makes sense; the latter group less so.
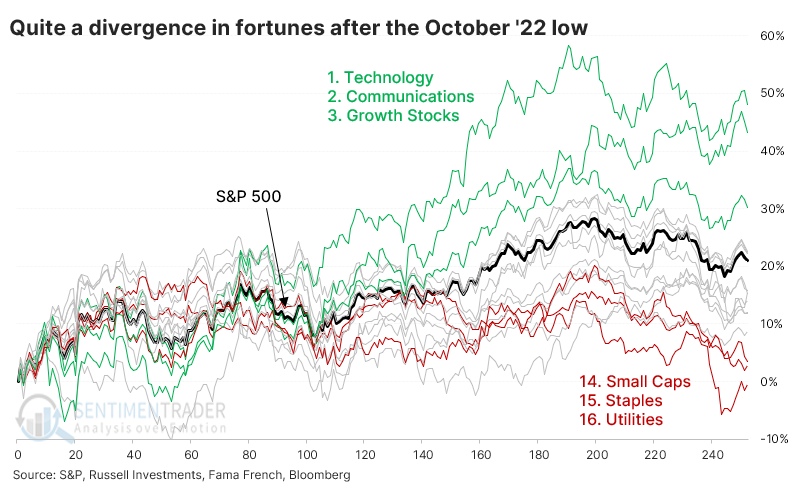
This rally has not been typical. There hasn't been a one-year rally from a one-year low that looked quite like the mix we've seen this time around. We'll get back to that later.
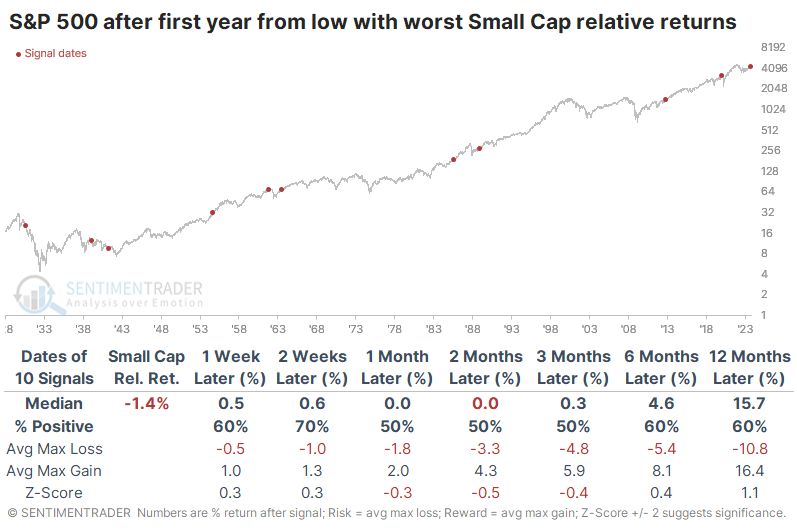
First, let's focus on Small Caps because that's been an increasing focus since they slid to lower lows last week. In the year since the 2022 bottom, Small Caps underperformed the S&P 500 by more than -17%, the 2nd-worst ever next to 1930. No other year even comes close.
That 1930 signal was a woeful sign for forward returns. And, generally, when Small Caps showed the worst relative returns compared to the S&P in the first year following a bottom, future returns in the S&P weren't all that great. They weren't terrible, either, though.
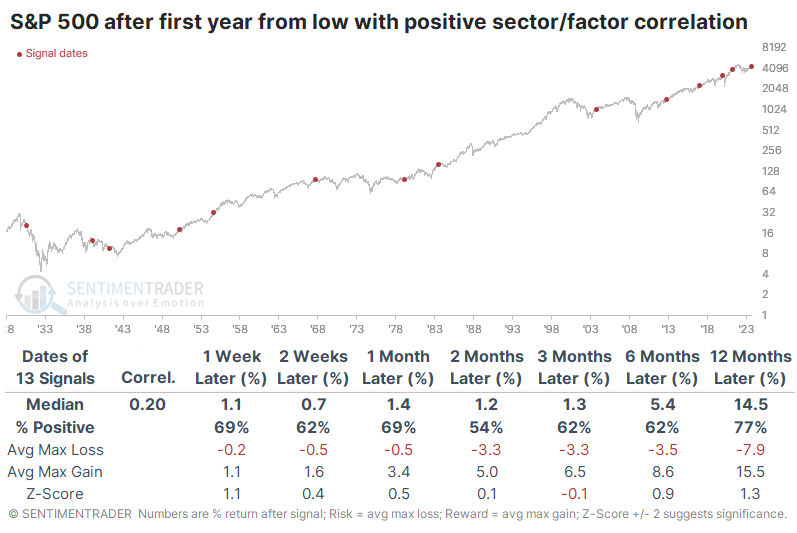
Taking a broader view, we looked at all major sector and factor returns over the past year and looked at the correlation to other sector and factor returns in the first year following 52-week lows since 1928.
The table below shows the S&P 500's returns following the first anniversary of rallies that showed the highest correlations to the past year. Most of them were pretty weak, though the troublesome 1930 comparison reappears. Other than that signal, most of the others led to generally higher prices without much in terms of drawdown. The 2019 precedent, which had the highest correlation, did get interrupted by the pandemic.
After the one-year rallies with sector and factor returns least correlated to the past year, the S&P 500's forward returns were pretty good - better in the short- and medium-term than in the table above, though more recent decades showed worse returns.
Sector bear markets are increasing
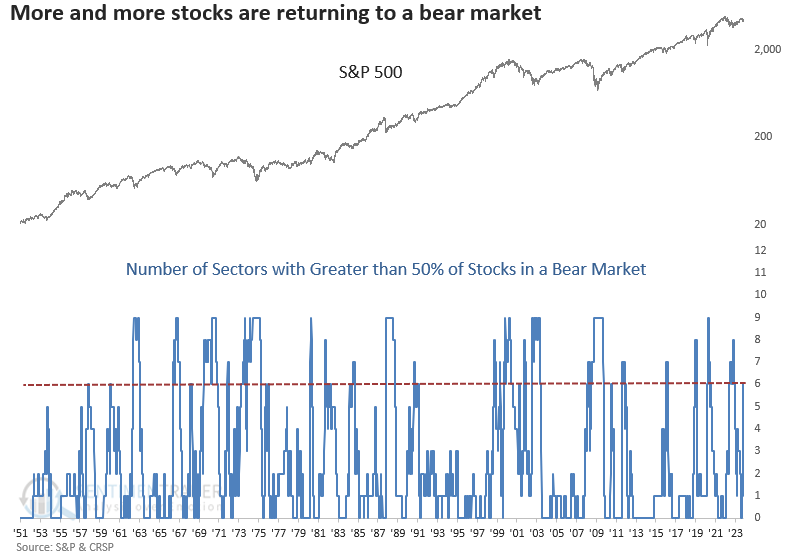
Dean showed that the number of sectors with more than 50% of their stocks in a bear market increased to six. Similar conditions indicate a market that's approaching an oversold status, setting the stage for a bounce.
With the S&P 500 declining from its 1-year high, more and more stocks are joining the bear market ranks, highlighting the structural weakness under the surface of the world's most benchmarked index. For the first time since the 2022 bear market, six out of nine sectors have over 50% of their stocks down more than -20% from a 52-week high.
When six sectors show 50% or more of their stocks in a bear market, the S&P 500 is somewhat soft over the subsequent month, with below-average win rates in the two and four-week horizons. And, within the first month, the S&P 500 was lower at some point in 18 out of 25 cases. After the bottoming process, the world's most benchmarked index tends to bounce at the two-month horizon. Except for extended bear markets, results are reasonably solid a year later.
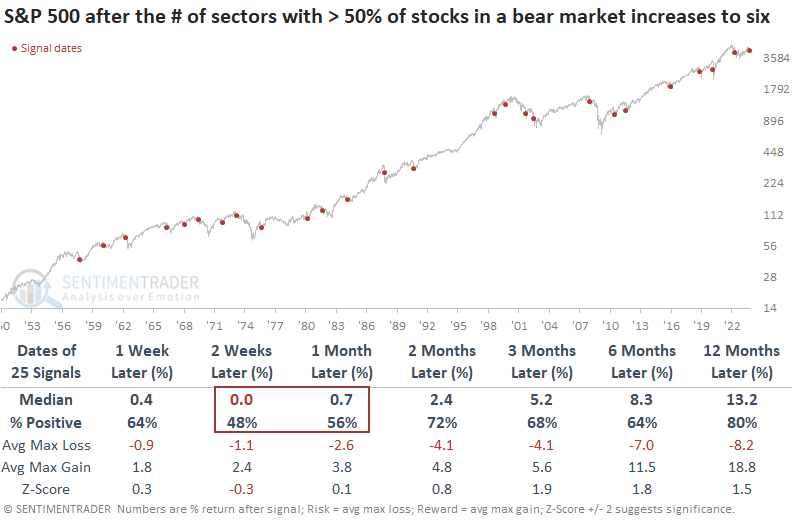
After the count reached six, nearly half of the signals hit their lowest point within a month, and slightly over two-thirds did so within three months. Nevertheless, for cases where the signals bottomed in the first month, the average and median losses extended to an additional -5.15% and -3.34% until the S&P 500 reached its final low.
Furthermore, it's worth noting that the most recent alert came at a time when the S&P 500 was down only -7.95% from its one-year high, representing the smallest drawdown from a peak. Usually, when the sector count expands to six groups, the S&P 500 is roughly -13% below the high. So, the mega-cap stocks within the S&P 500 are hiding the structural weakness under the surface of the index.
The S&P was stuck, then failed
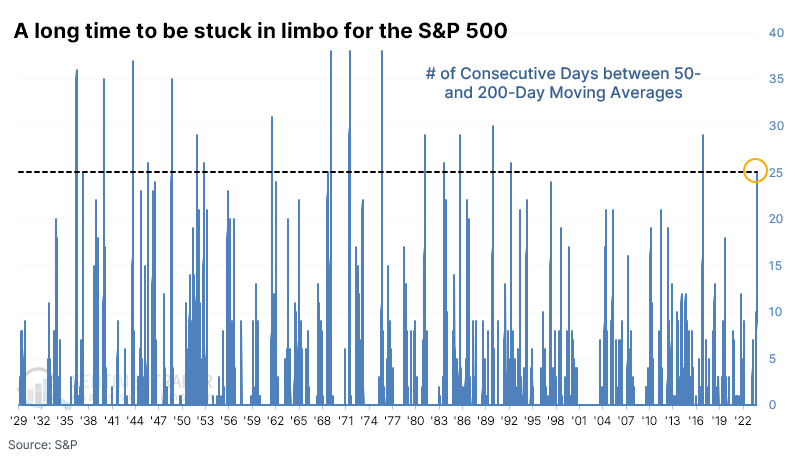
The most important equity index in the world just came unstuck. After spending over a month gyrating between its two most-watched trend-following gauges, the S&P 500 finally fell below its 200-day moving average.
Before that late loss, the index had been trading between a falling 50-day moving average and a rising 200-day moving average for 25 trading sessions. The stretch of 25 sessions between its 50- and 200-day averages is long. Since 1928, there haven't been many times when investors were so undecided between the medium- and long-term trends. It was the 2nd-longest such streak in 30 years.
The table below shows every time the S&P spent 25 sessions stuck between its moving averages since 1928. It mostly resolved higher over the short- to medium-term, but not always. And when it didn't, it wasn't necessarily a death knell for the uptrend. When it knifed below its 200-day average in 1937, it was a sign of bad things to come for investors, but other poor initial reactions in 1952, 1971, and 1985 all preceded rebounds over the next 2-3 months.
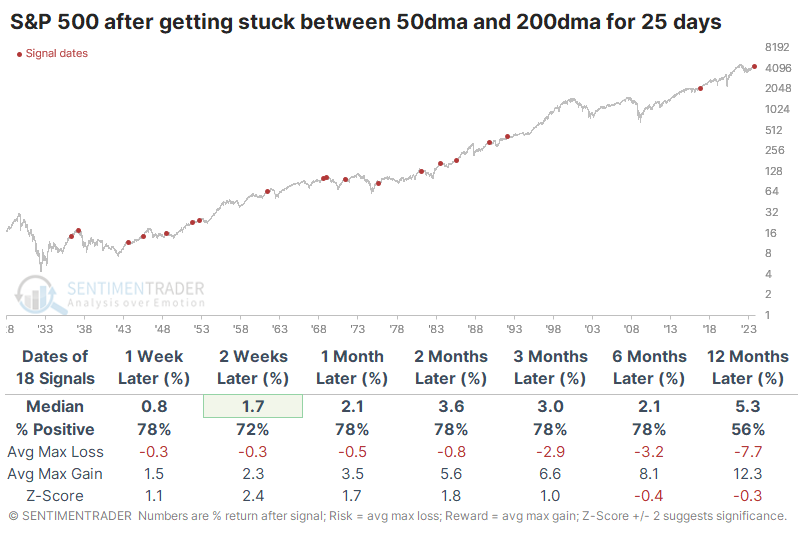
Since it became a 500-stock index in 1957, there was only one loss over the next three months, which was minor and quickly erased. However, several medium-term rallies failed, leading to negative one-year returns. The median return and max loss over the next year were troubling, but again, this was after medium-term rallies.
When the S&P fell below its 200-day average for the first time in six months, it also wasn't a consistent signal that the end was nigh. Over the next two to three months, the index rose 70% of the time, with about twice the average max gain than the average max loss. A caveat here is that since 2010, it has been much more of a crap shoot.
More stocks are failing to hold their 200-day average, too
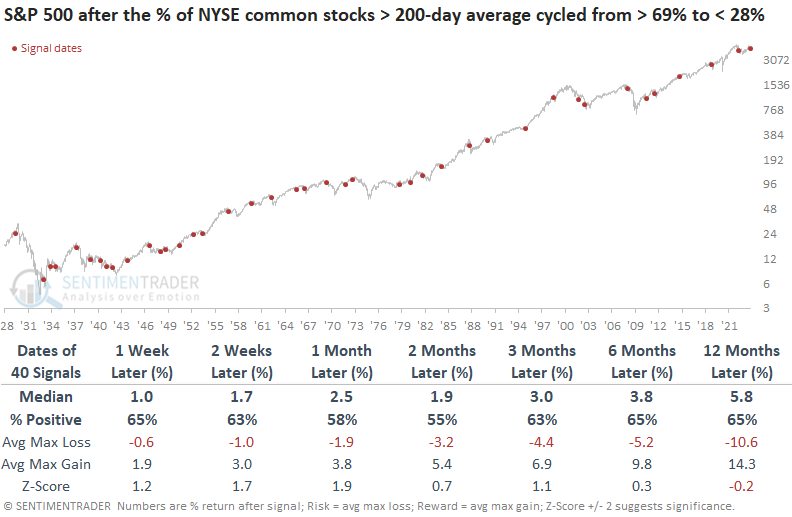
The percentage of NYSE stocks above their 200-day average cycled from above 69% to less than 28%. Dean noted that similar shifts in long-term uptrends led to an S&P 500 rally, but the results were lackluster.
Recent developments have seen long-term uptrends suffer a significant decline. On Tuesday, the percentage of NYSE commons stocks above their 200-day average fell below 28%, a level reached only 17% of the time since 1928.
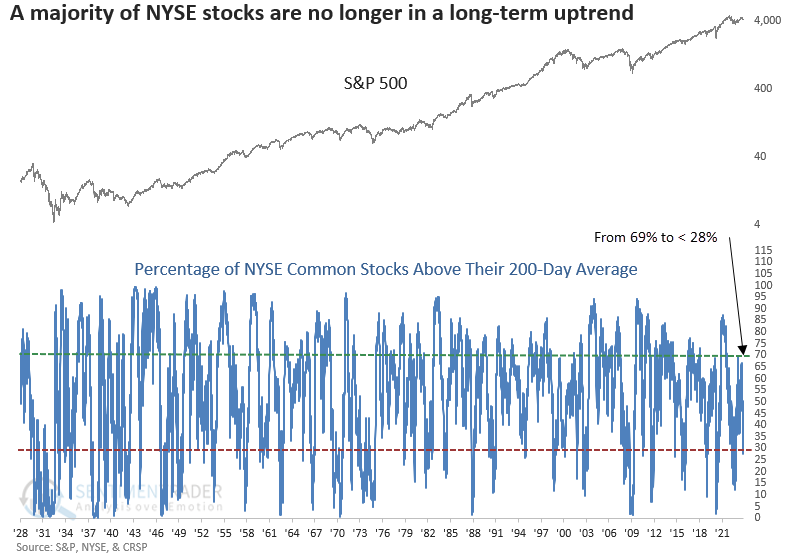
When the percentage of NYSE common stocks trading above their 200-day average cycled from greater than 69% to less than 28%, the S&P 500 typically saw a rally. However, the resulting returns, win rates, and z-scores were unimpressive, mirroring the typical outcome when a breadth-based indicator declines into an oversold condition. Since 1962, 16 out of 22 precedents showed a negative return at some point in the first two months.
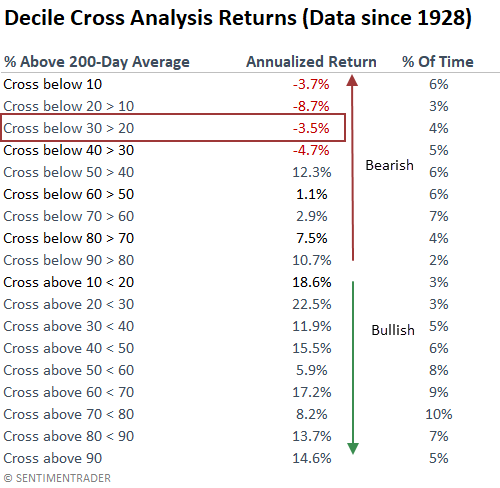
Generally, annualized returns tend to be bearish when a breadth-based indicator declines toward oversold territory. Conversely, when it starts to rise from the oversold condition, returns see a notable improvement.
Dean further looked at instances when recovery signals like we saw in December showed weak follow-through like the most recent signal. The implication was that the average stock may struggle over the medium-term.
Poor participation under the surface
Dean also noted that the percentage of S&P 500 stocks above their 200-day average declined below 27% while the S&P 500 remains less than 10% below its 252-day high. Similar precedents led to lackluster results for the S&P 500 over the following six months.
This type of divergence between the index and its member stocks has only occurred 16 other times since 1928.
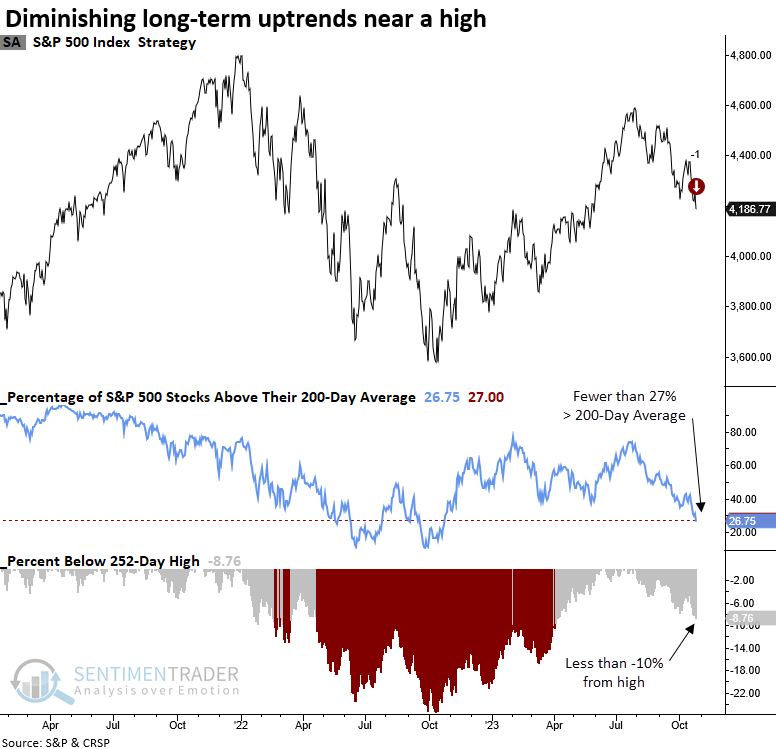
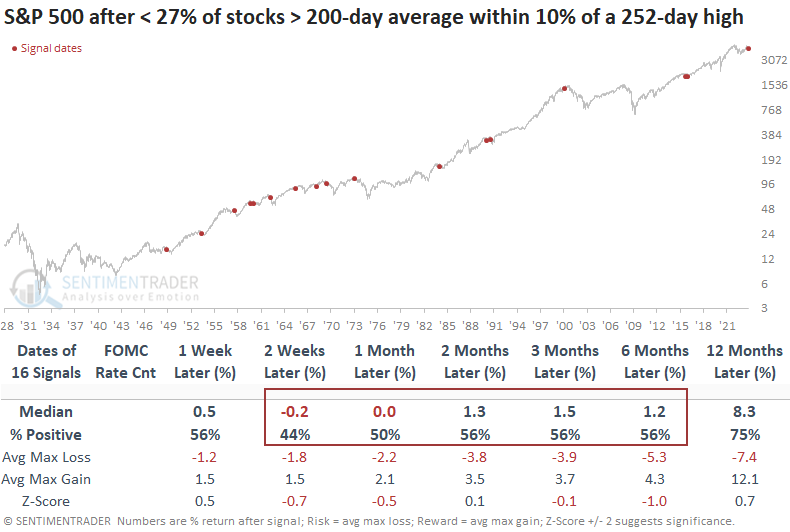
Whenever the S&P 500 hovers within 10% of its 252-day high and less than 27% of its constituent stocks are trading above their 200-day averages, the world's most widely followed index typically encounters difficulties in the subsequent six months. Over that same time frame, the average max loss exceeded the average max gain in all but one period.
In 11 out of 16 cases, the Federal Reserve was increasing its target rate. Tightening cycles typically weigh on interest rate-sensitive stocks, resulting in a narrowing of market breadth. This time is no different.
Similar to the NYSE analysis table above, the annualized returns for the S&P 500 often exhibit less favorable returns when the percentage of stocks above their long-term average declines in oversold territory.
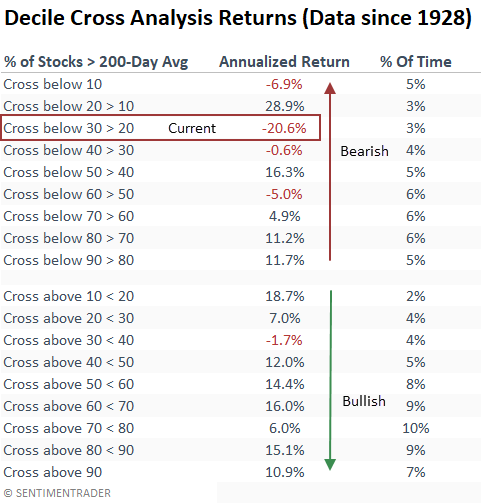
The current decile cross displays the worst annualized return outlook of any zone.
Perhaps seasonality will help
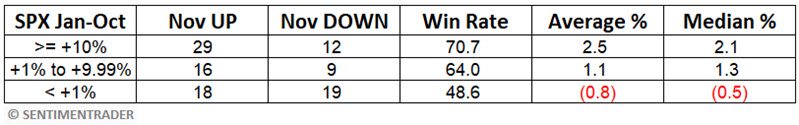
Jay noted that there appears to be some correlation between January through October market performance and performance during November. History suggests that investors root for an October S&P 500 close of 4,223.45 or higher.
The table below looks at November returns in the S&P since 1920 depending on the index's performance during the first ten months of the year. Summarizing results is pretty straightforward. A January-October return of:
- Over +10% has tended to be favorable for November
- +1% to +9.99% tended to be moderately favorable for November
- Less than 1% tended to be unfavorable for November
The table below summarizes the November S&P 500 performance.
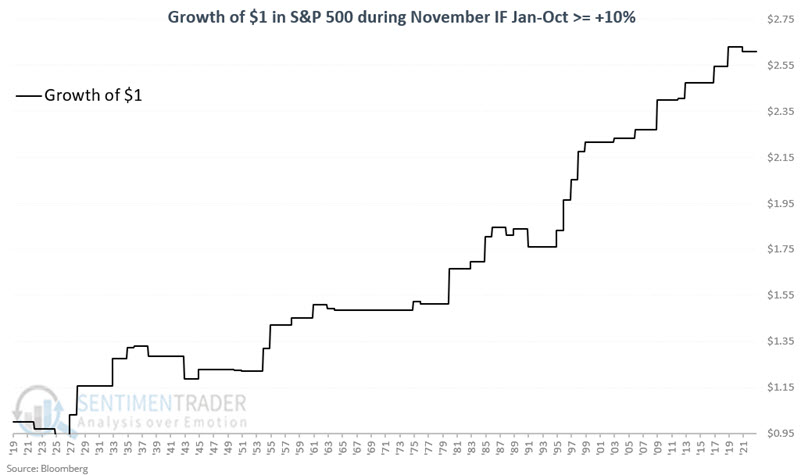
The chart below displays the growth of $1 invested in the S&P 500 Index only during November if the S&P 500 Index showed a year-to-date gain of +10% or more through the end of October.
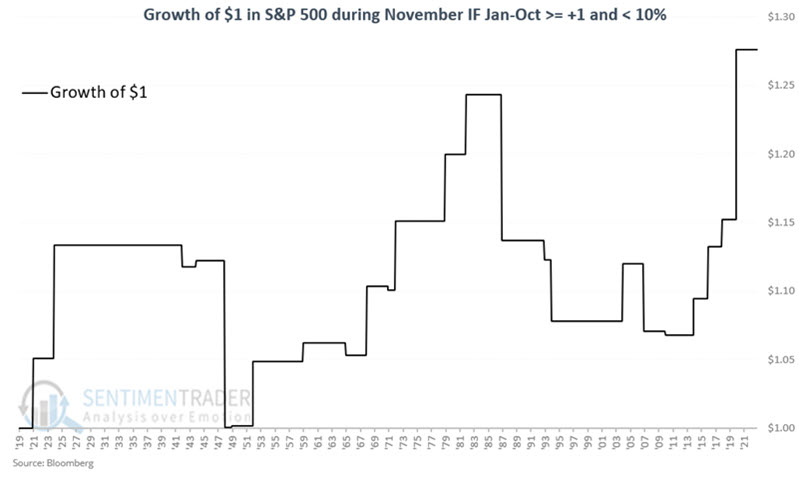
The chart below displays the growth of $1 invested in the S&P 500 Index only during November if the S&P 500 Index showed a year-to-date gain of +1% to +9.99% through the end of October.
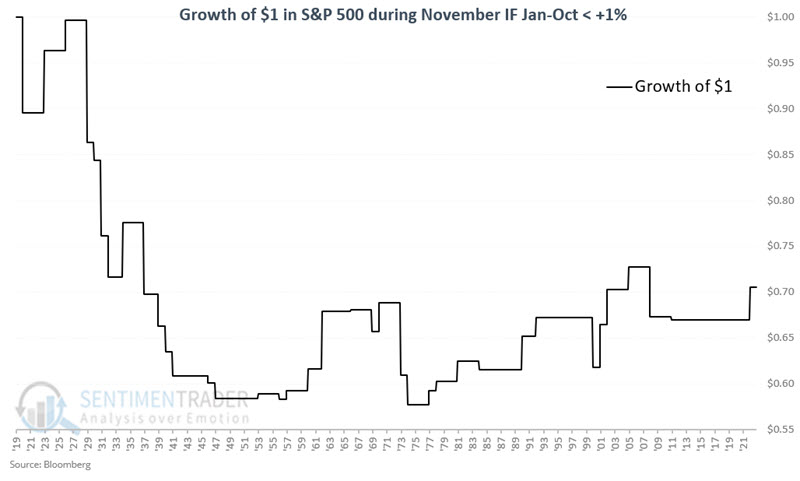
The chart below displays the growth of $1 invested in the S&P 500 Index only during the month of November if the S&P 500 Index showed a year-to-date return of +1% or less through the end of October.
To close, let's take things one step further and add December returns to the mix. Jay's tweet below displays the growth of $1 invested in the S&P 500 Index during November AND December if the S&P 500 Index showed a year-to-date return of +10% or more through the end of October.
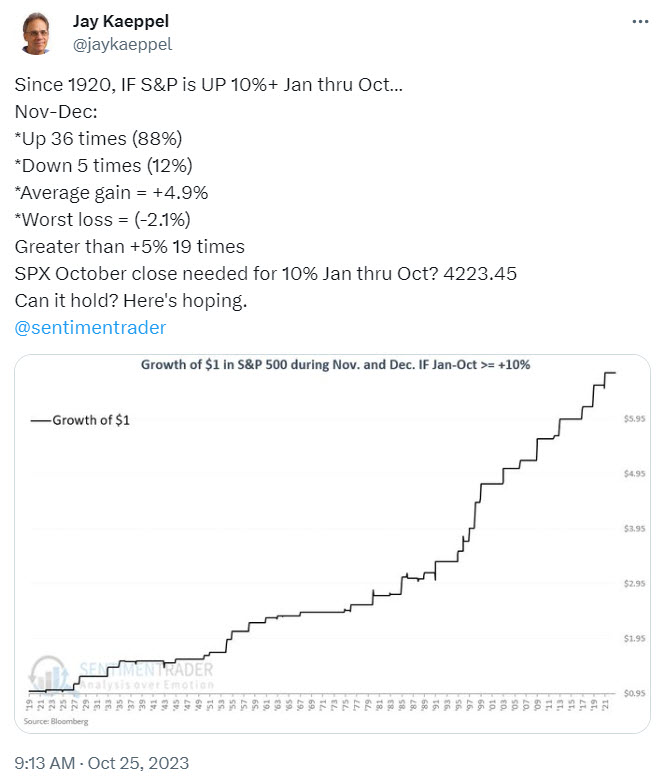
These results add to the suggestion that the end-of-the-year performance tends to be favorable when the overall market has shown significant strength during the first ten months of the year.
NOTE: The S&P 500 would need to close on October 31st at 4,223.45 or higher to register a 10% January through October gain.
We're still in the "mid-decade bulge"...
Jay further noted that "The Mid-Decade Bulge" is the tendency for stocks to perform well from late in "Year 2" into early "Year 6".
The period we will examine spans from the end of September of Year "2" through the end of March of Year "6". The chart below displays the growth of $1 invested only during these 42 months every decade starting in the 1920's. Through 2023-10-25, $1 invested in the S&P 500 only during the favorable 42 months of each decade grew to $124.28, or +12,328%.
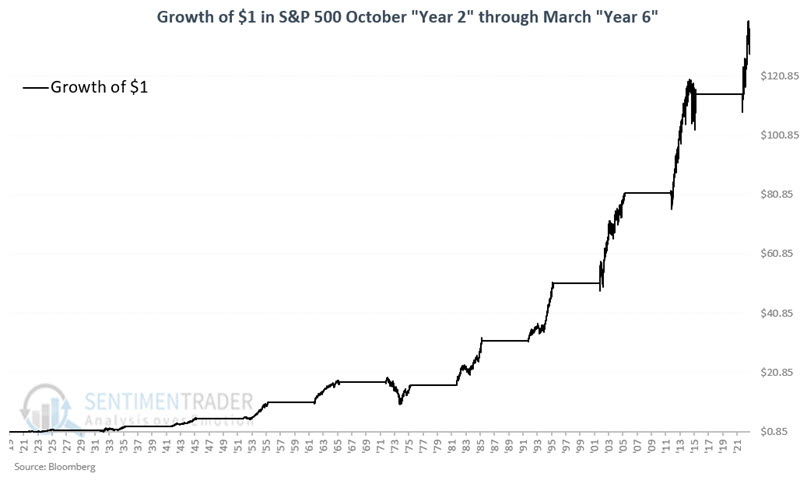
In 9 out of 10 decades, this period showed a gain and the average gain was +63.2% or an annualized gain of +15.0%. One decade (the 1970s) suffered a significant bear market, with a peak-to-valley drawdown of -43.7%. The average maximum drawdown from the entry date (September 30th of Year 2) was -12.1%, with a median drawdown of -5.5%.
When we look at that equity curve versus the growth of $1 for "All Other Months," the latter hardly even registers. This illustrates the importance of trying to make hay in the market during the Mid-Decade Bulge.
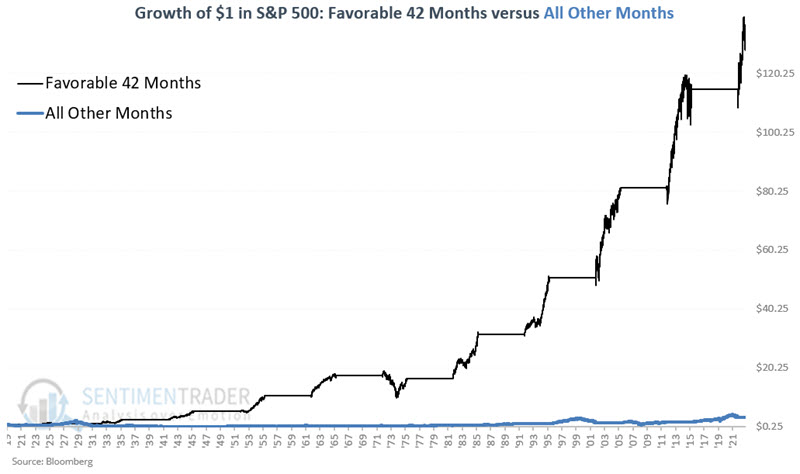
While the seasonal pattern highlighted above is strong - and persistent - the performance in the 1970s reminds us that no seasonal pattern can be relied on 100%. Nevertheless, the +12,328% return during the favorable 42 months of each decade compared to the +258% return for the other 78 months of each decade reminds us of the importance of giving the bullish case the benefit of the doubt to whatever degree possible between now and 2026-03-31.
...and the Power Period
A 5-day period encompassing late October into early November has shown a long-term tendency to be favorable for stocks, according to Jay. This pattern is shaping up as a very contrarian play this year.
The period we will examine is the 5-trading day period that extends from the last two trading days of October through the first three trading days of November. For 2023, this period will extend from the close on 10/27/2023 through the close on 11/3/2023.
The chart below displays the cumulative growth of $1 invested in the S&P 500 Index (price-performance only) every year during the five days described above, starting in 1949.
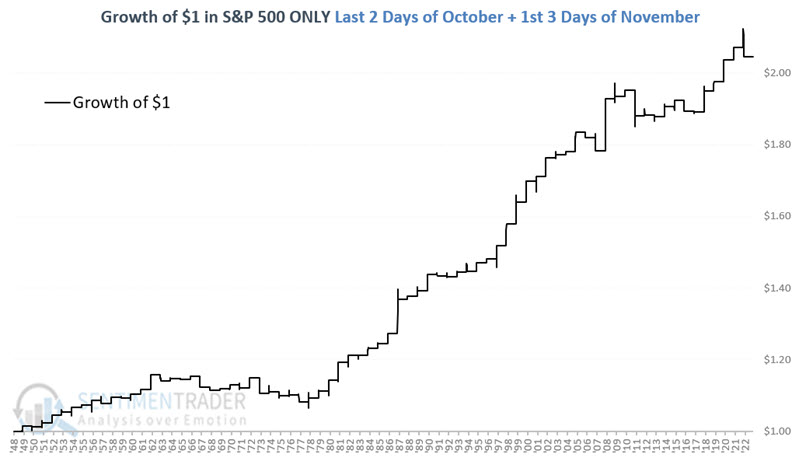
The good news is that the S&P 500 has shown a gain during this period in roughly 3 out of every four years over the past 74 years, and the average and median gain was larger than the average and median loss. Large gains (defined as 3% or more over the five days) outnumbered large losses by a whopping 14 to 2 ratio. If we expand the count to include gains or losses of plus or minus 2% or more, the ratio is 26 up years to 6 down years.
The largest 5-day losses occurred in 1973 (-5.07%) and 1967 (-3.35%). In 2022, the first day of these five days saw the S&P 500 shoot higher by 2.5%, only to reverse sharply lower over the next four days and end with a 5-day loss of -2.30%.
Maybe Tech is oversold enough?
Jay showed that the stock market continues to flash signs of an oversold condition; the concern is whether the primary trend can remain favorable.
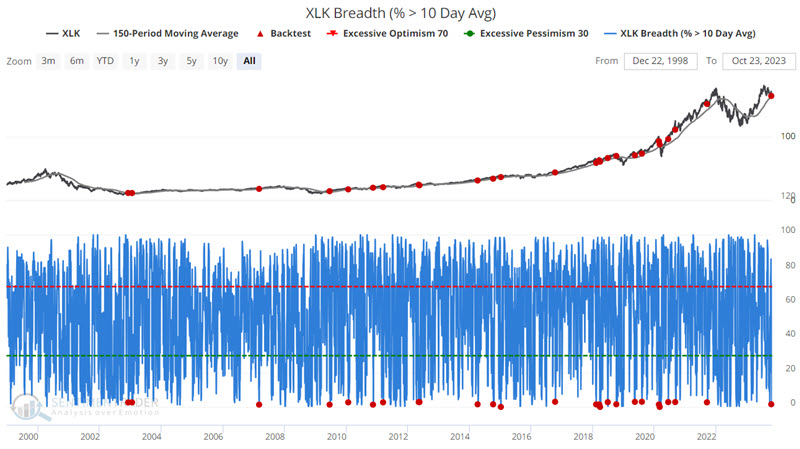
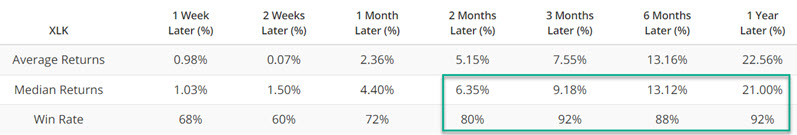
Breadth in the Technology sector just triggered a potential sign with only 3% of stocks in the Technology Select Sector SPDR Fund ETF (ticker XLK) trading above their 10-day moving average. The chart below highlights those dates when this dropped below 3 for the first time in 5 days while ticker XLK was above its 150-day moving average. Three months later, XLK was higher 92% of the time.
Another indicator, the HiLo Logic Index, was created by Norman Fosback in 1979. Intended to observe "split" market conditions, it looks for times when there are many 52-week highs AND 52-week lows among securities on the exchange. When there are a lot of both, the market is severely split between winners and losers, and it tends to be negative for stocks. When there is a very low number, the market is heavily one-sided, which tends to be a positive for stocks.
The chart below highlights those dates when the 5-day average of the NASDAQ High/Low Logic Index crossed below 0r.605 for the first time in six months while the Nasdaq 100 Index was above its 150-day moving average.
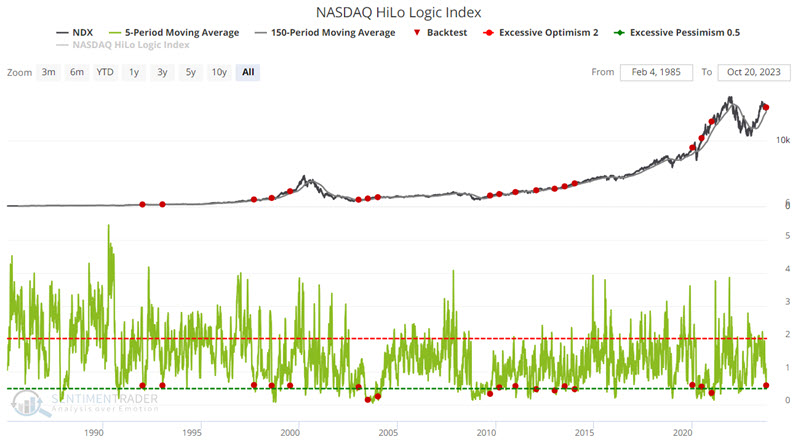
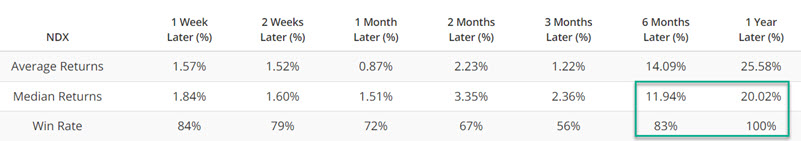
The good news is that the twelve-month Win Rate is 100%, with a Median Gain of 20%. The bad news is that it is always a mistake to assume that a historical 100% Win Rate implies that any new signal will automatically be followed by smooth sailing. For the record, the Nasdaq 100 Index is still 2% below its level of the last signal date in early October.
Basic Materials have been hit hard
Thanks to some significant declines in the stocks of companies that focus on the underbelly of the economy, the Basic Materials index has given back all of its year-to-date gains.
Declines in recent sessions have been especially severe, and it has caused every stock in the index to fail. Every stock in the Basic Materials sector has failed its short-term trend, below its 10-day moving average.
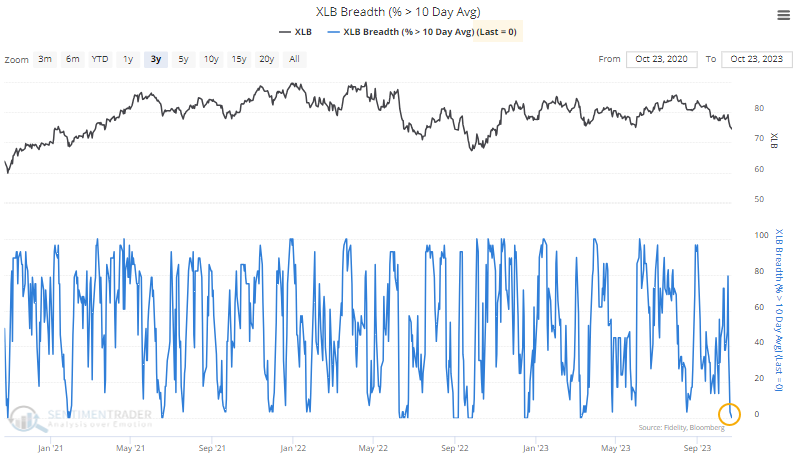
It's the same with medium-term trends - every stock is below its 50-day moving average. This is rare - we don't often see every stock in short- and medium-term downtrends. Over the past 70 years, it has happened only a handful of other times.
The table below shows every time since 1952 when this happened. While the last signal was not a great buying opportunity, with more than a 9% drawdown within a month, they all showed positive medium- to long-term returns.
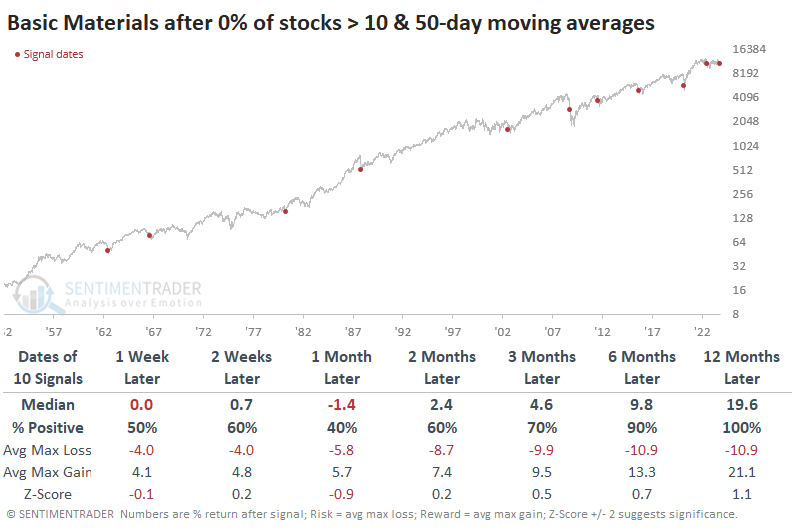
If we ignore distinct instances and just look at every single session when this was the case - when every stock was in a short- and medium-term downtrend - then all 35 days sported a positive one-year return. Most of them were within weeks of an investable bottom, with the 2008 financial crisis being the primary exception.
Potential trouble in these raw material stocks didn't spill over into the broad market, though again, this is except the 2008 meltdown. Outside of that notable outlier, the S&P 500 index sported a positive return every time from 3-12 months later. More impressively, the 2008 signal was the only one that saw the S&P decline more than -10% at any point within the following year.
Gold versus stocks now favors the former
Jay noted that one iteration of the Gold/S&P 500 Ratio just tipped favorably for gold.
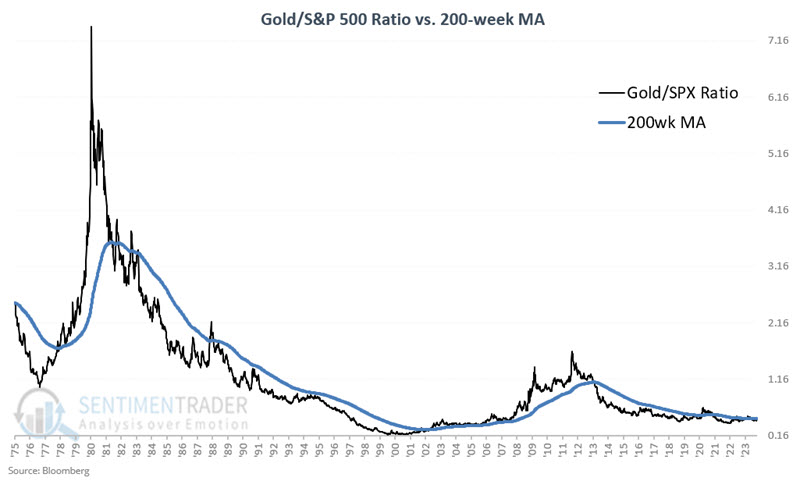
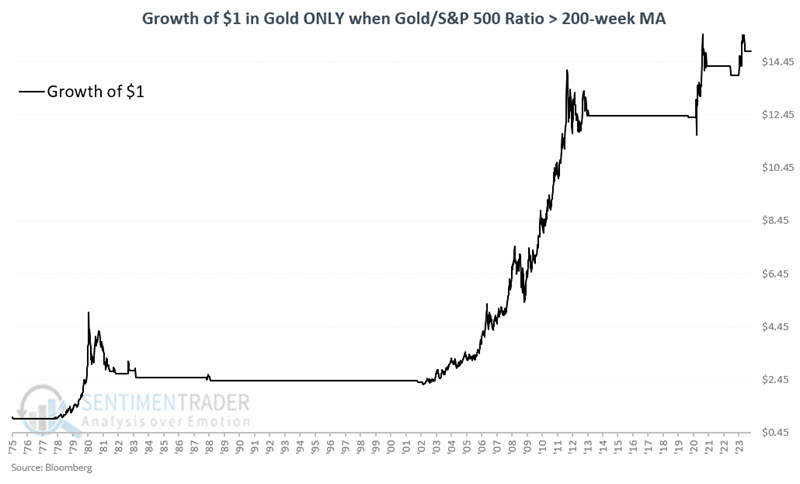
The Gold/SPX Ratio is derived by dividing the weekly closing price for gold by the weekly closing price for the S&P 500 Index. The chart below displays the ratio since 1975. Comparing the weekly reading to the 200-week moving average creates a long-term trend-following indicator.
- When the ratio is above the 200-week moving average, the indicator is considered favorable for gold
- When the ratio is below the 200-week moving average, the indicator is considered unfavorable for gold
The Gold/SPX Ratio has once again closed back above the 200-week moving average. As a result, this indicator is once again deemed favorable for gold bullion.
Let's look first at "favorable" periods. The chart below displays the hypothetical growth of $1 invested in gold bullion only when the Gold/SPX Ratio was above its 200-week moving average since 1975. The cumulative gain has been +1,386.4%.
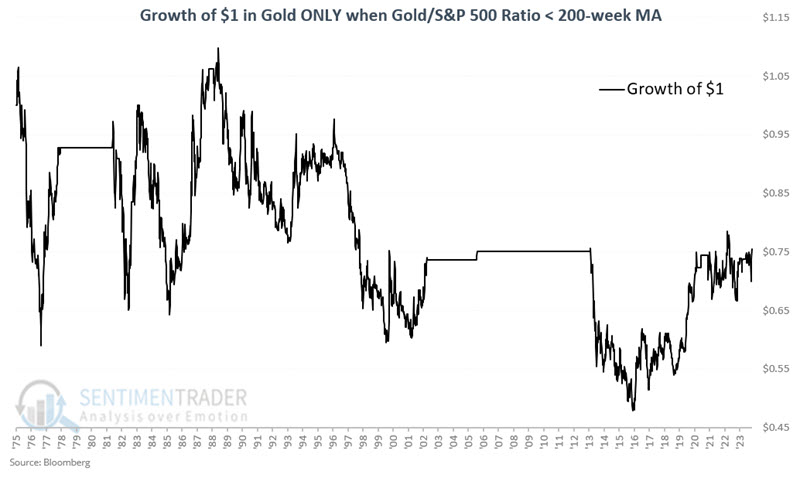
The chart below displays the hypothetical growth of $1 invested in gold bullion only when the Gold/SPX Ratio was below its 200-week moving average since 1975. The cumulative loss has been -25.4%.
So, does the latest signal from the Gold/SPX Ratio guarantee that "Happy Days are here again" for gold? Not at all. It does, however, a solid addition to the bullish side of the weight of the evidence ledger.
About TradingEdge Weekly...
The goal of TradingEdge Weekly is to summarize some of the research published to SentimenTrader over the past week. Sometimes there is a lot to digest, and this summary highlights the highest conviction or most compelling ideas we discussed. This is NOT the published research; rather, it pulls out some of the most relevant parts. It includes links to the published research for convenience, and if you don't subscribe to those products, it will present the options for access.