
TradingEdge Weekly for Oct 25 - Super S&P streaks, gold runs, homebuilding stock system

Key points:
- A historic run without back-to-back losses
- The S&P 500 has levitated above average for nearly a year
- Why seasonality suggests taking a look at the equal-weight version of the S&P
- The S&P is now in a positive short-term turn-of-the-month window
- Detailing a 2-factor model for homebuilding stocks
- Gold miners have enjoyed a major move
- Gold's run above its 200-day average has lasted for over a year
- The dollar has (mostly) positive seasonality ahead, but questions remain
BTFD streak
The index serving as the most widely-used benchmark in the world is having a historic run of its own. Over the past 30 sessions, the S&P 500 has not suffered the ignominy of back-to-back down days. NOTE: This ended (barely) on Tuesday.
A month without consecutive down days may not sound like much, but it is. In the index's history, it has rarely gone this long without at least small sessions of back-to-back losses. The current streak ranks among the very best since 1928.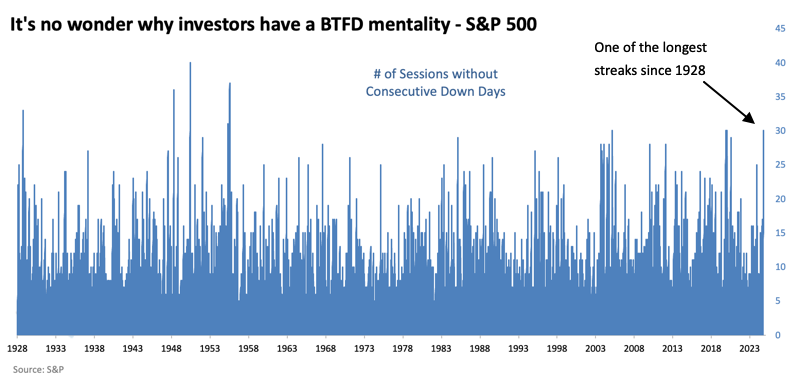
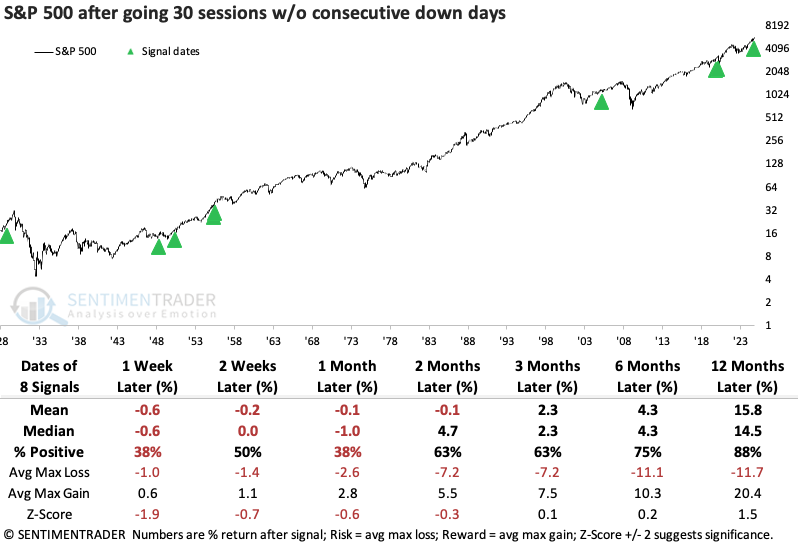
The table below shows the S&P's forward returns after the other times investors showed such a willingness to "Buy The F***ing Dip." Over the next month, only one signal, way back in 1928, showed a gain both two and four weeks later. However, other than the pandemic-interrupted signal in 2020, any selling was minor and temporary. Over the next year, only one precedent was a loser, and that was the only signal that did not trigger when the S&P was trading near a multi-year high.
On the more tech-heavy side of the ledger, the Nasdaq Composite has had its own impressive brush with BTFD. Going 32 days without consecutive losses has been a compelling sign of persistent positive sentiment. It suffered one tiny loss over the next six months out of a dozen tries and was never in negative territory over the following year. The risk/reward ratio was tilted heavily in favor of reward.
Good returns on the Nasdaq were good for other stocks, too. The S&P also witnessed only a slight loss over the next six months (a smaller one than the Nasdaq, even) and was also higher a year later every time.
Longer-term streaks are impressive, too
The S&P 500 has now closed above its 200-day average for 242 consecutive sessions. Dean noted that similar win streaks saw the S&P 500 rise 85% of the time over six months.
As shown in the chart below, the S&P 500 delivers an annualized return of 9.8% when the win streak count surpasses 242 sessions. Conversely, when the streak resides below 242 days, the index yields an annualized return of 8.1%.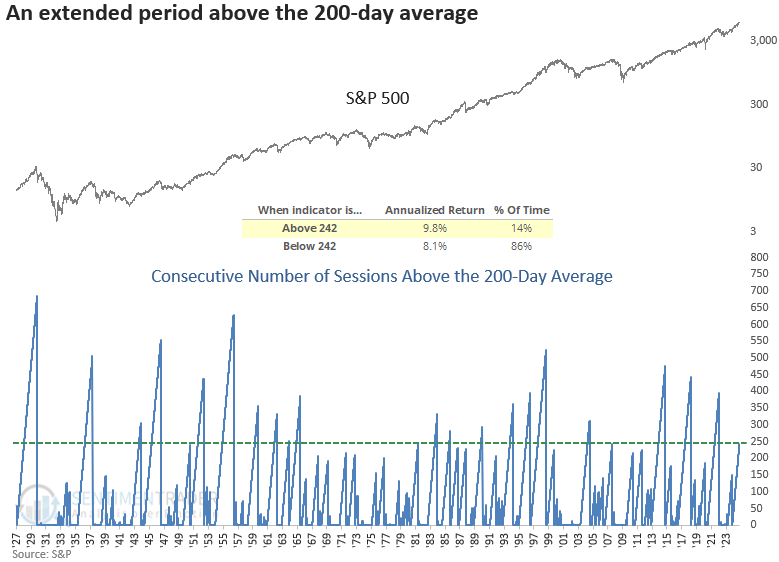
Whenever the S&P 500 closed above its 200-day average for 242 straight sessions, with the index less than 3% below a record high, the world's most benchmarked index rose 85% of the time over the ensuing six months. Although none of the time horizons showed significance compared to random returns, the consistency observed from two weeks to 12 months easily surpassed historical norms.
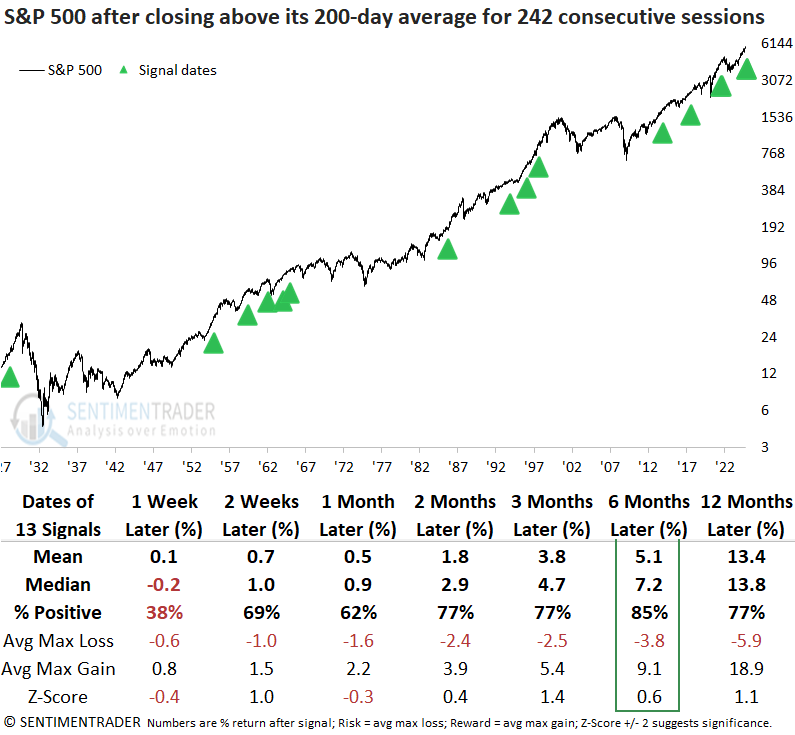
Over the subsequent six months, the S&P 500 experienced just one instance of a maximum loss exceeding 10% and only two precedents surpassing that same downside risk over the following year.
As of the close on October 18, 2024, four out of five market breadth indicators showed more robust participation than the average of all other signals, indicating a more favorable backdrop for the S&P 500 than in previous periods.
A good time for the average stock
Since early 2023, the cap-weighted S&P 500 index has significantly outperformed (+50%) the equal-weighted version (+24%). Jay highlighted a couple of longer-term tendencies that suggest keeping an eye on the unweighted index.
Let's buy and hold the S&P 500 Equal Weight Index for 252 trading days after it has rallied 35% from a low for the first time in over a year. The chart below displays the hypothetical growth of $1 (on a logarithmic scale) invested this way. The most recent signal occurred back on 2024-07-24. Since then, the SPXE has advanced +7.8%.
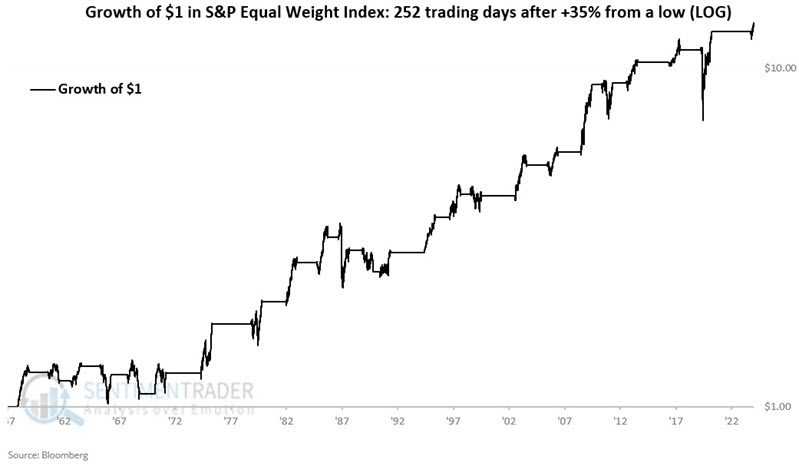
A continuation following a 35% advance from a low is not a sure thing (75% Win Rate). However, long-term results skew strongly to the favorable side (Median Win +16.4%, Median Loss -7.1%, and moves of 15% or more skew positive 11 to 0).
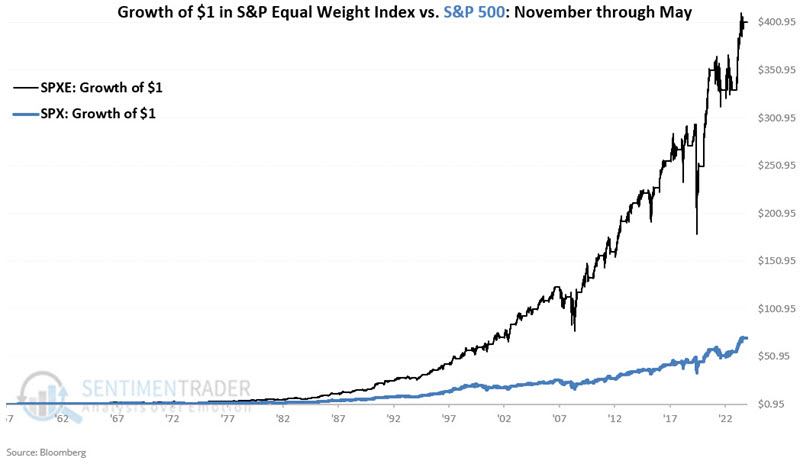
The relationship between the S&P 500 and the S&P 500 Equal Weight Index has a calendar quirk. Over the years, the equal-weight version has significantly outperformed the original cap-weighted index from November through May and underperformed from June through October. The chart below displays the hypothetical growth of SPXE vs. SPX only during November through May, starting in late 1957.
The chart below displays the hypothetical growth of SPXE vs. SPX only from June through October.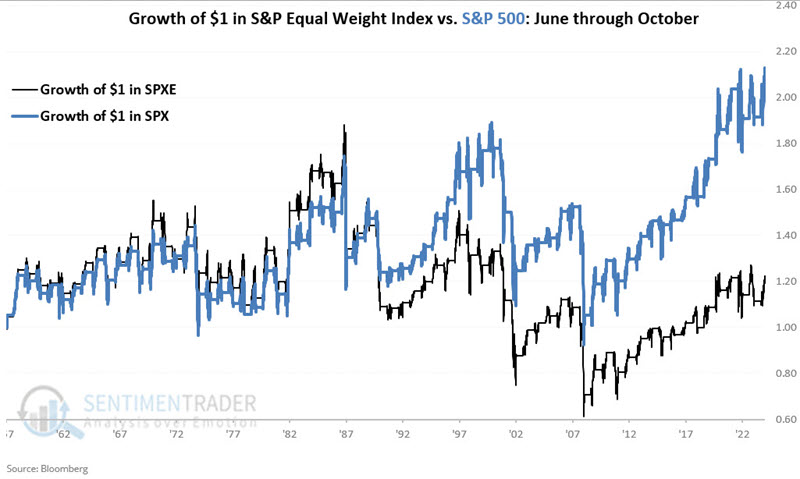
Now, let's consider combining momentum and seasonality into more of a trading approach. If the S&P 500 Unweighted Index rises 35% from a low, we will hold a long position for 252 trading days. If the current month is November through May, we will hold the S&P 500 Unweighted Index but if the current month is June through October, we will hold the S&P 500 Index.
The chart below displays the hypothetical growth of $1 utilizing the rules above.
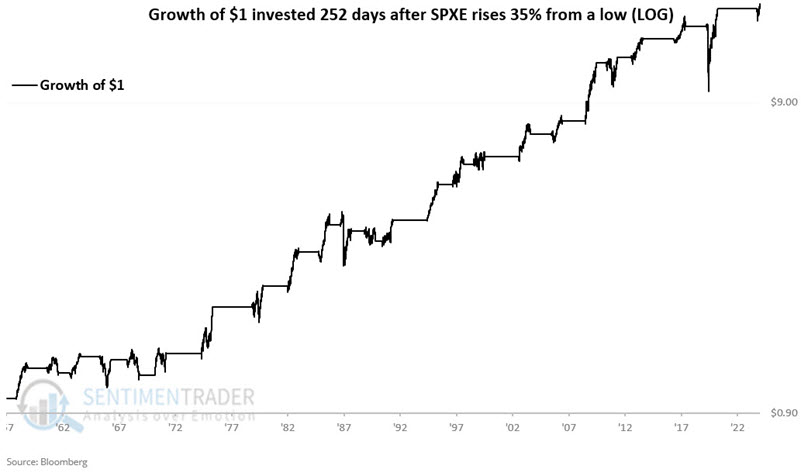
These "trades" resulted in a 79% win rate, an average gain about five times larger than the average loss, and gains of +12% or more fourteen times versus losses of -12% or worse zero times.
Strategies involving the S&P 500 cap-weighted and equal-weighted indexes can be emulated with ETF. The most heavily traded is the SPDR S&P 500 Trust (ticker SPY). The most prominent ETF for trading the equal-weight version is the Invesco S&P 500 Equal Weight ETF (ticker RSP).
A narrower window
Jay further noted that a particular trading window during late October/early November is approaching for the capitalization-weighted S&P 500.
The period we will look at encompasses the last four trading days of October and November's first three trading days. For 2024, this period extends from the close on 2024-10-25 through the close on 2024-11-05. We will start our test in 1950 using daily closing price data for the S&P 500 Index.
The chart below displays the hypothetical growth of $1 invested only during this period every year starting in 1950.
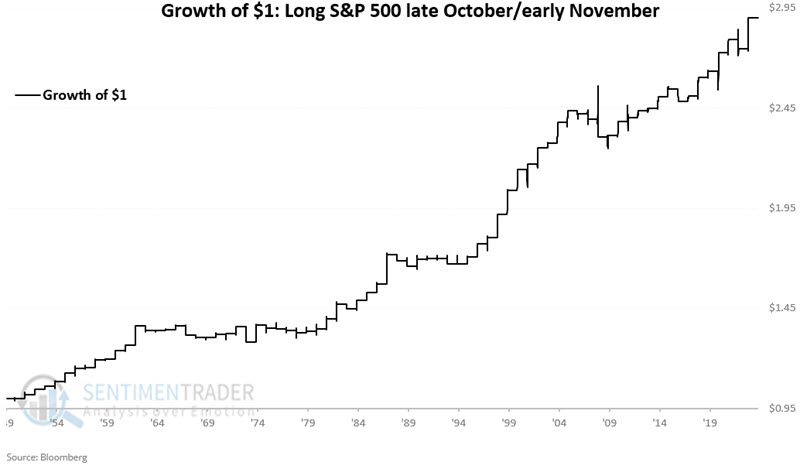
These windows showed a gain 72% of the time, with an average gain twice as large as the average loss. There were 18 years with a gain larger than +3% versus only two years with more than a -3% loss.
A two-factor model for homebuilding stocks
The housing market in the U.S. has been struggling, but homebuilding stocks have gained roughly 147% over the past 28 months. Jay detailed a simple two-factor model that suggests the potential for even more gains ahead.
We will consider two indicators, giving each equal weight, starting 1972-05-31. We will use the S&P 1500 Homebuilders Index (SPHB1500) to measure performance.
At the end of each month, we compare the closing level of the 10-year treasury yield (ticker $TNX) to its own 6-month exponential moving average. If the 10-year yield is below its average, it is favorable for homebuilders.
The chart below displays the hypothetical growth of $1 invested in SPHB1500 only when the indicator is favorable. Since 1972, $1 has grown to $1,661, albeit not without some significant drawdowns along the way.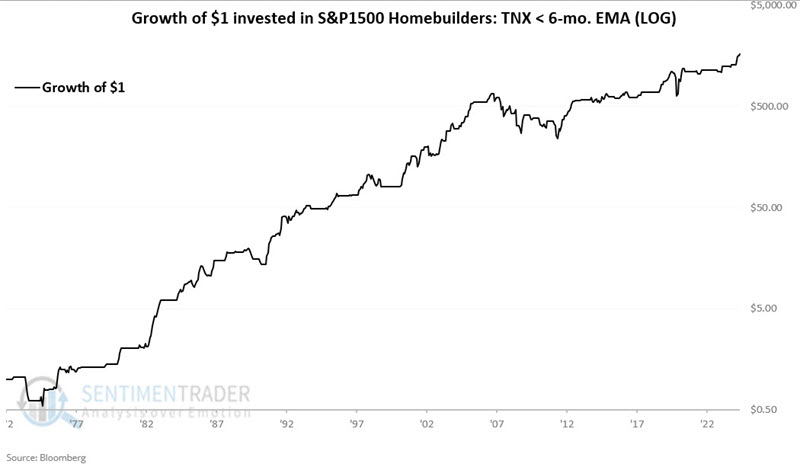
In contrast, since 1972, $1 has declined to $0.02 when the 10-year yield is above its 6-month average.
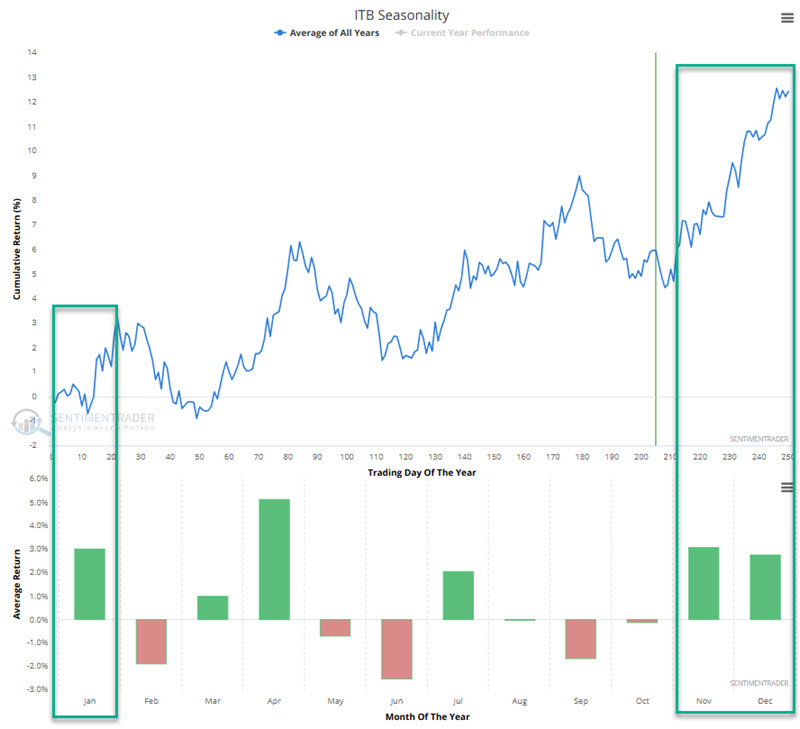
Homebuilders have a long history of demonstrating price strength during November, December, and January, so we will incorporate this as another indicator. This phenomenon is reflected in the annual seasonal trend chart for the iShares US Home Construction TF (ticker ITB) below.
Let's add the two indicators together. On any given day, the model can read 0, 1, or 2. We will refer to this total as HBSum. The model is:
- If the 10-year Treasury yield is below its 6-month exponential moving average, the model adds +1, otherwise 0.
- If the month is November, December, or January, the model adds +1, otherwise 0.
Following is the growth of $1 in SPHB1500 when the HBSum model is:
- 2 (both indicators favorable) = $22.40
- 1 (one or the other indicator is favorable) = $389.04
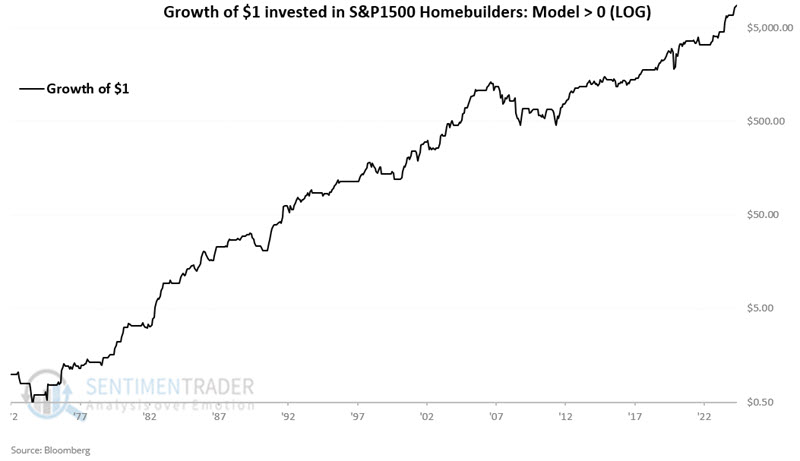
- > 0 (one or both of the indicators are favorable) = $8,716.38
- 0 (neither indicator is favorable) = $0.0035
Buy-and-hold would have returned $30.44. So, the best course for investors was when the model was above zero. Below, we can see the growth in homebuilders when that was the case.
There should be no illusions that this is an "easy money, you can't lose" trading system for homebuilder stocks. The chart below displays the maximum percentage drawdown for our two-factor model (black line) versus the maximum drawdown using a buy-and-hold approach (blue line).
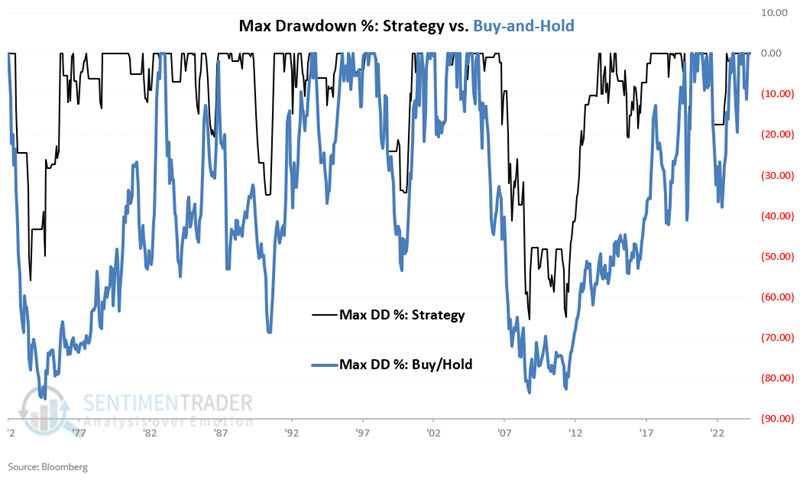 The interest rate factor detailed above turned favorable at the end of June 2024. The bad news is that barring a decline in the 10-year treasury yield in the days ahead, that factor will turn neutral at the end of October. The potential good news is that November 1st marks the start of the seasonally favorable November through January period, so the two-factor model will remain favorable at least through the end of January 2025.
A major move in gold miners
Gold has been putting in the performance of a decade. And the companies that mine the metal have, for the most part, tagged along for the ride.
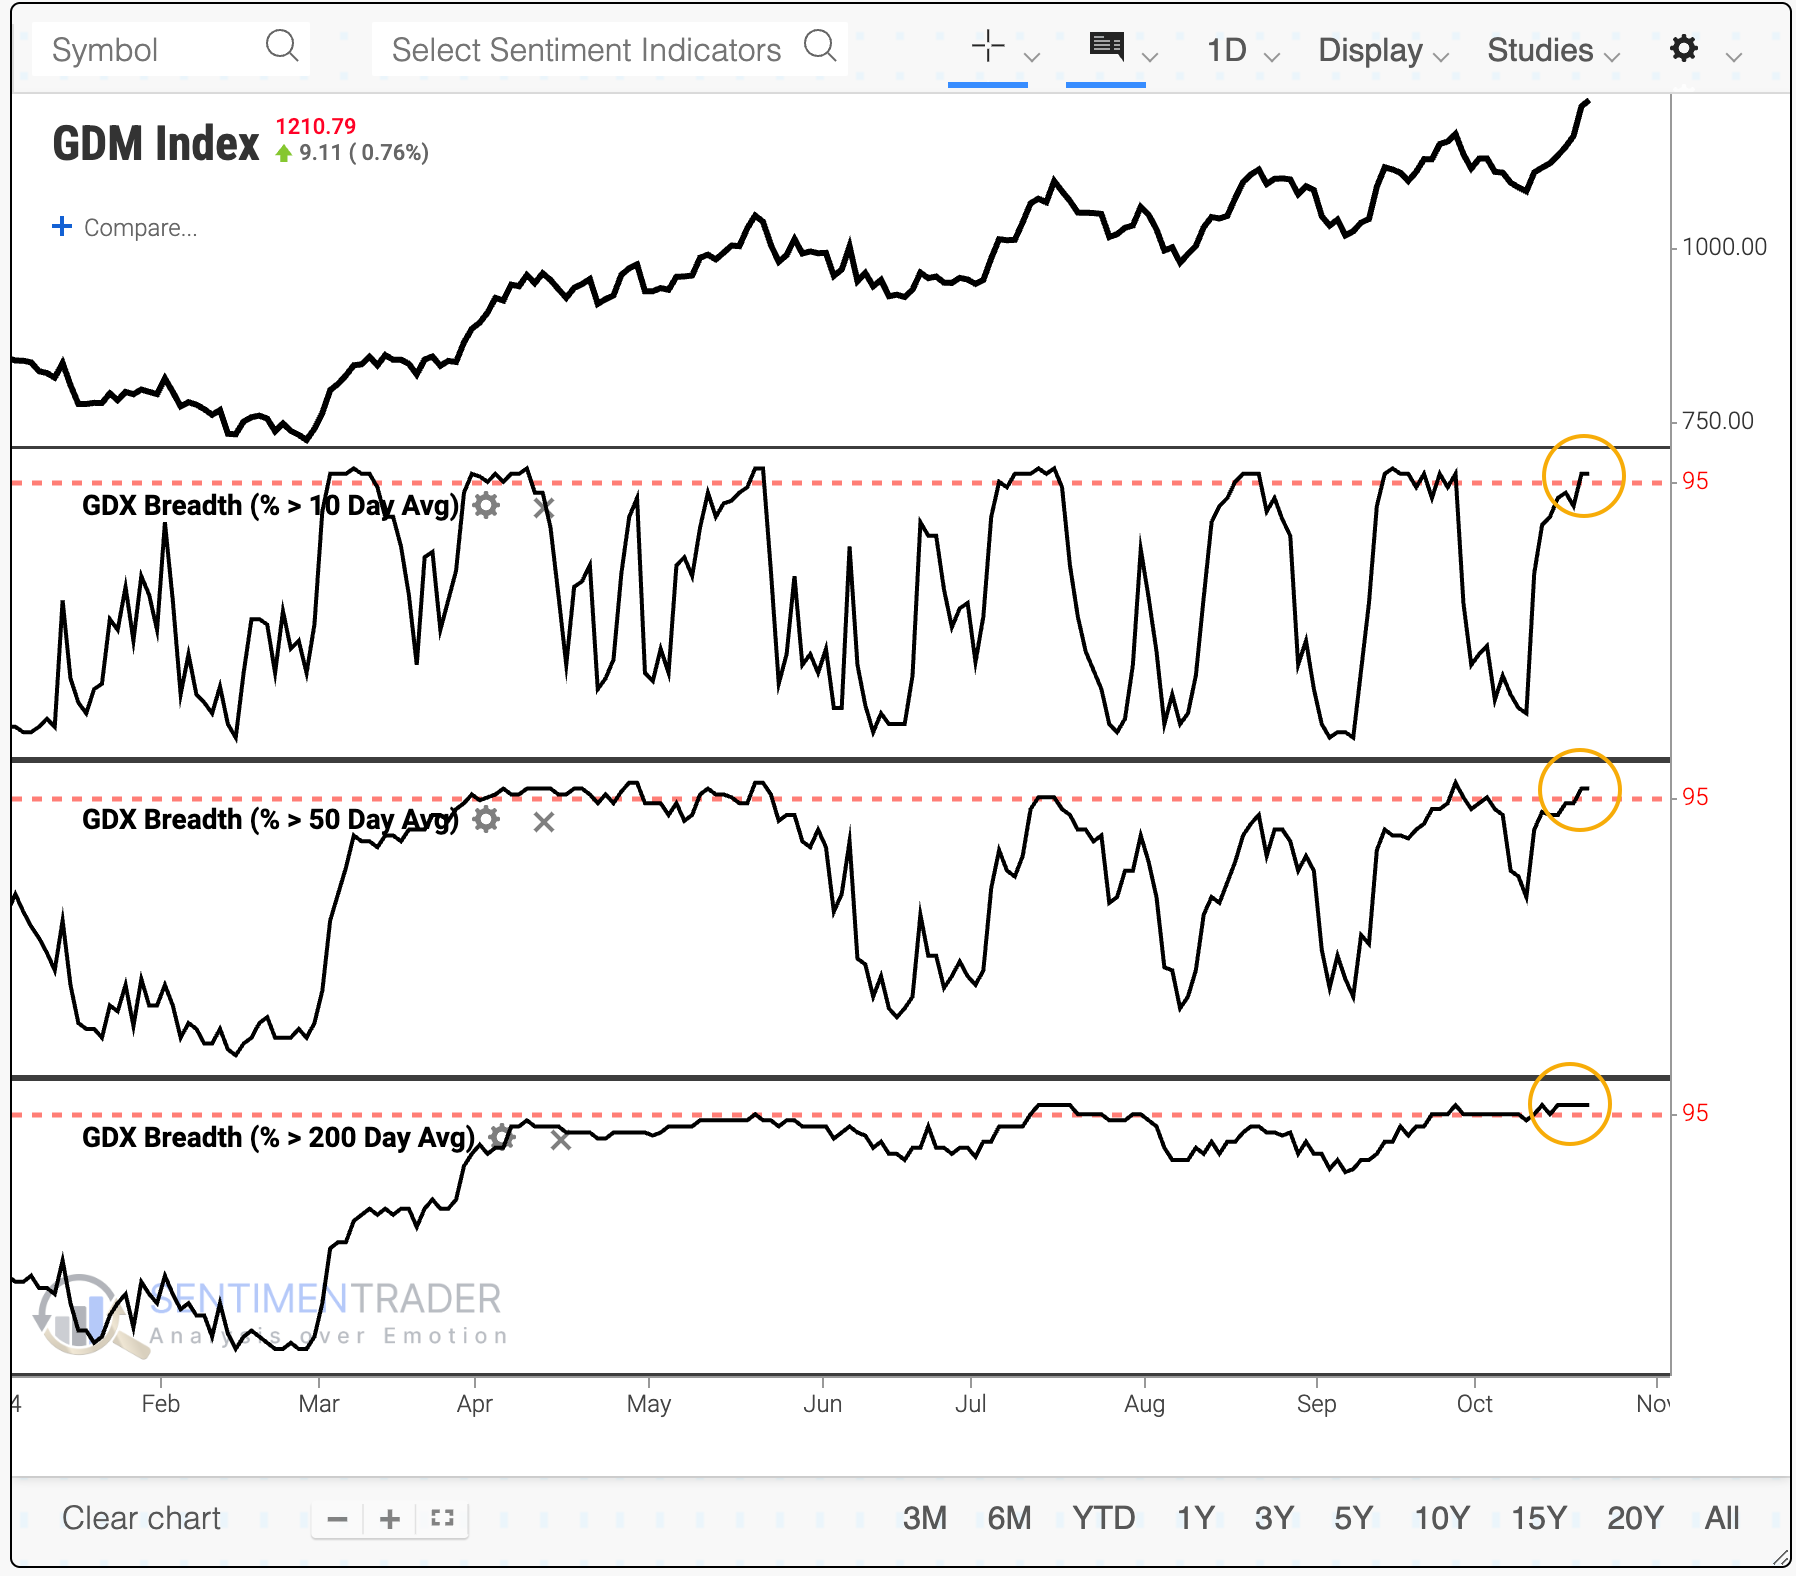
Virtually every gold miner is now trading above its 10-day moving average, showing a short-term boost in widespread buying interest. It's not just the short-term, though - almost all of them are also above their 50-day and 200-day averages.
So many widespread uptrends across so many of these stocks have been a good sign for the sector over the following month, but that was pretty much it, at least consistently. Other time frames showed weak average returns with wide variability.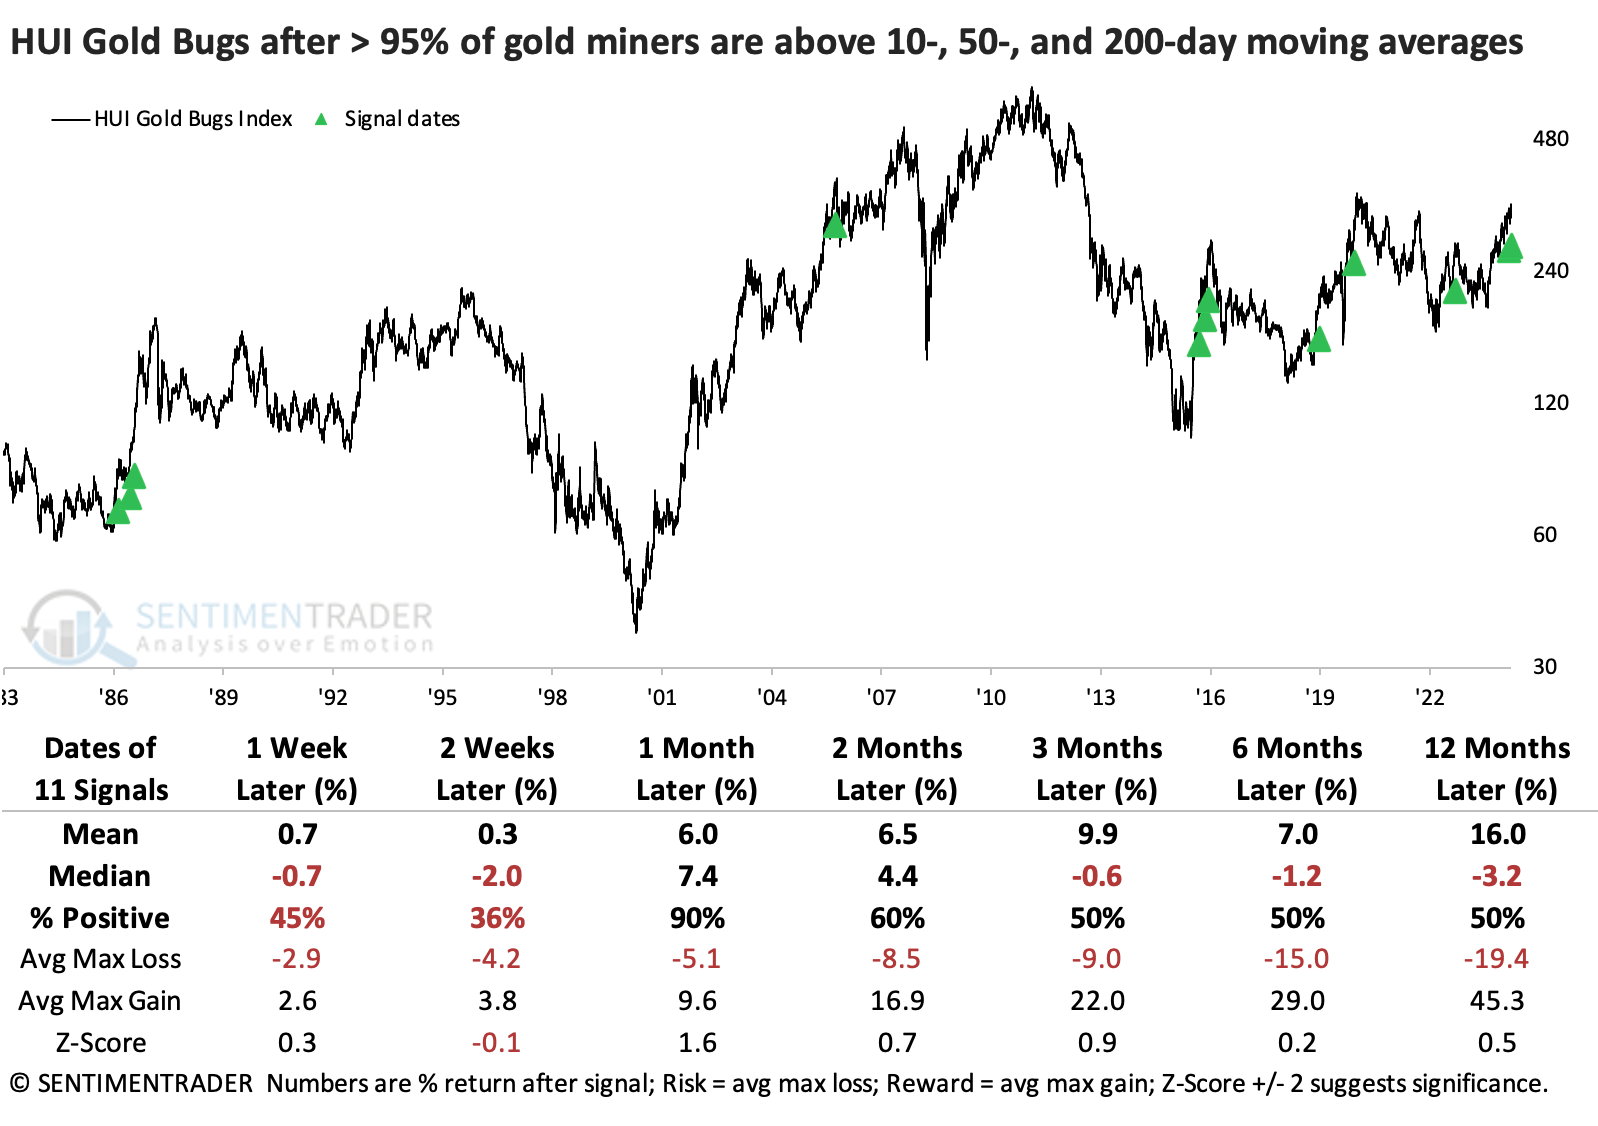
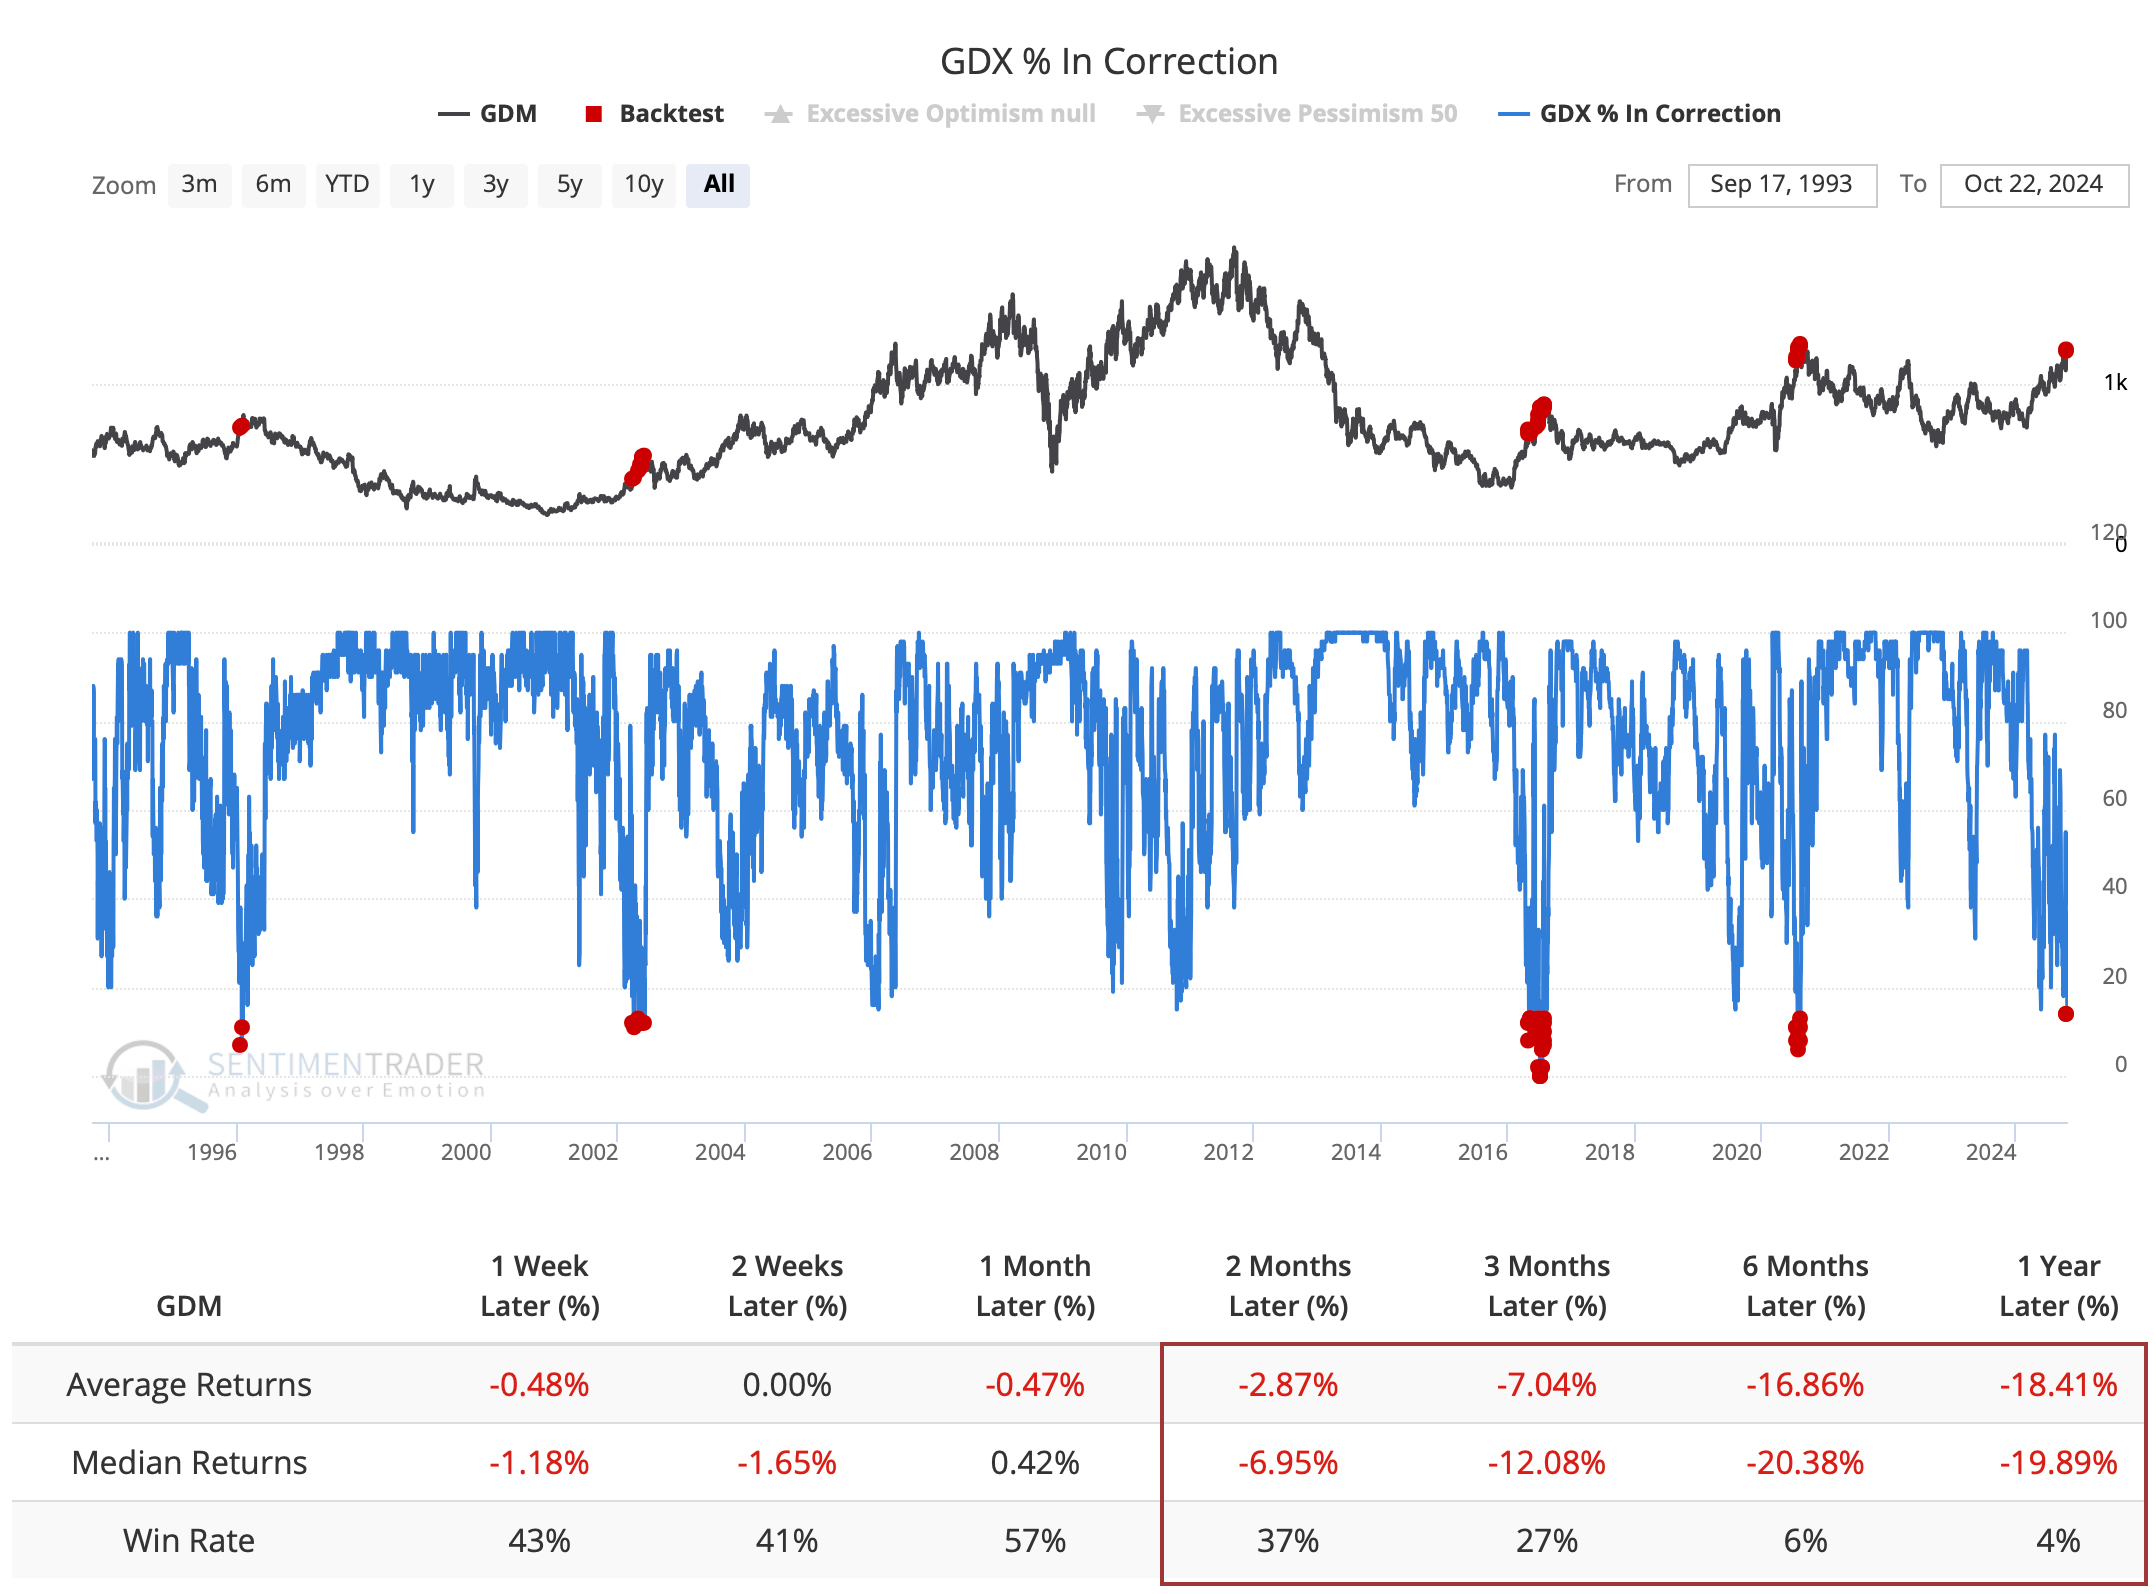
The rally over the past week pulled many of these stocks out of correction territory. Now, fewer than 15% of the stocks are beyond that threshold. As we see so often in this group, similar recoveries have not been encouraging. Returns were poor across every time frame and got progressively worse the further out we looked.
An average of fewer than 20% of gold miners have been in bear markets over the past 150 sessions, among the lowest in 30 years. All three times this average got this low, miners peaked. Even when it got below 25%, peaks were the norm.
With so many of the stocks relatively close to their highs, it makes sense that we'd see a jump in the number of them actually reaching new highs, which we have. More than half of them recently hit a new high on the same day. Again, returns were poor after so many of them hit a new high together.
When it comes to gold itself, sentiment has become highly optimistic. A 10-day average of the Gold Optimism Index just crossed above 80%, which has preceded some tough times for miners.
Gold bugs need to hope this time is different from virtually every other instance over the past 30 years.
A persistent gold rush
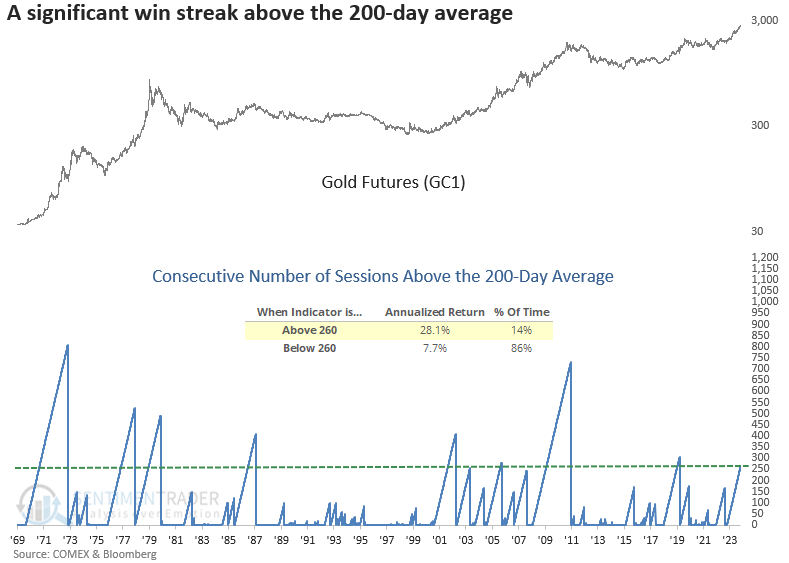
Gold has now closed above its 200-day average for 260 consecutive sessions. Dean showed that similar win streaks saw Gold futures rise 100% of the time over six and twelve months.
Although we'll only know in hindsight whether Gold is in a secular or cyclical uptrend, the case for a sustained advance gained further credence now that the precious metal closed above its 200-day moving average for 260 consecutive sessions. The previous signal occurred in January 2020, and Gold rallied 23.8% over the subsequent year.
While the sample size is small, whenever Gold futures closed above its 200-day average for 260 straight sessions, the precious metal rose 100% of the time over the ensuing six and twelve months. Additionally, the six-month horizon showed significance relative to random returns.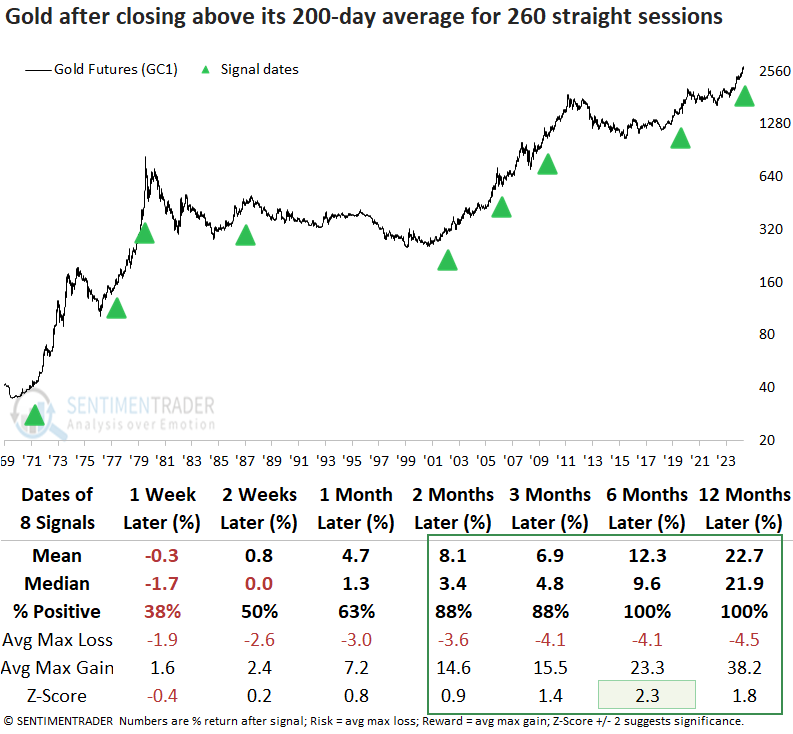
Over the subsequent six and twelve months, Gold futures experienced just one instance of a maximum loss exceeding -10%.
The Gold BUGS Index (HUI) tended to follow the precious metals lead, rallying 100% of the time over the subsequent twelve months. The upward trajectory could be volatile despite a bullish outlook. In the six- and twelve-month windows, maximum losses of over -10% occurred in 5 out of 8 cases.
When Gold displays a persistent uptrend like now, Silver tends to tag along, rallying 88% of the time over the following year. However, like gold miners, the path to higher prices was volatile.
The S&P 500 and most sectors displayed a negative outlook over the next three months, potentially suggesting some macro factor influenced Gold, which heightened concerns among stock investors.
Dollar seasonality
The U.S. Dollar has been rallying, and seasonality remains favorable - sort of. But Jay noted that a seemingly unrelated indicator is flashing a warning sign for the year ahead. This sign is unfavorable for the dollar BUT favorable for commodities as an asset class, particularly the grain markets.
The dollar has bounced sharply off the September 2024 low. This is not entirely surprising, given the dollar's seasonal pattern in the chart below. There appears to be a potential continued upside.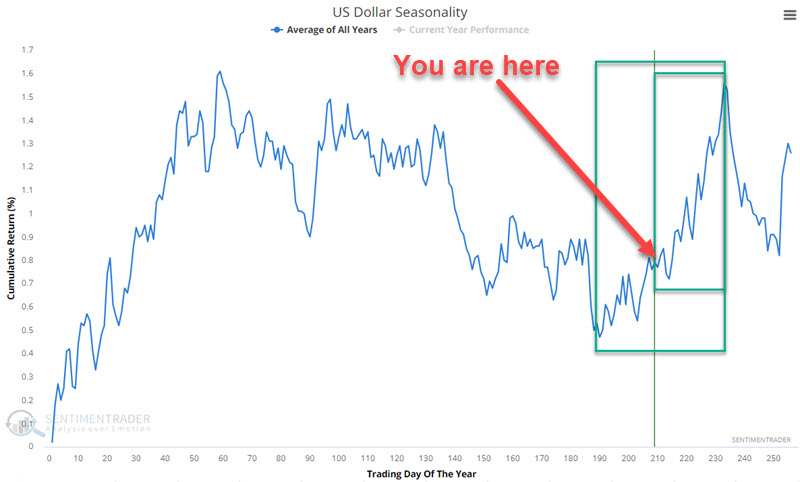
If we look at historical performance from the current trading day of the year (#209) through TDY #233 (i.e., the smaller green box in the chart above), we get some mixed results. The chart below displays the hypothetical growth of $1 in the dollar only from TDY #209 through #233 every year since 1985.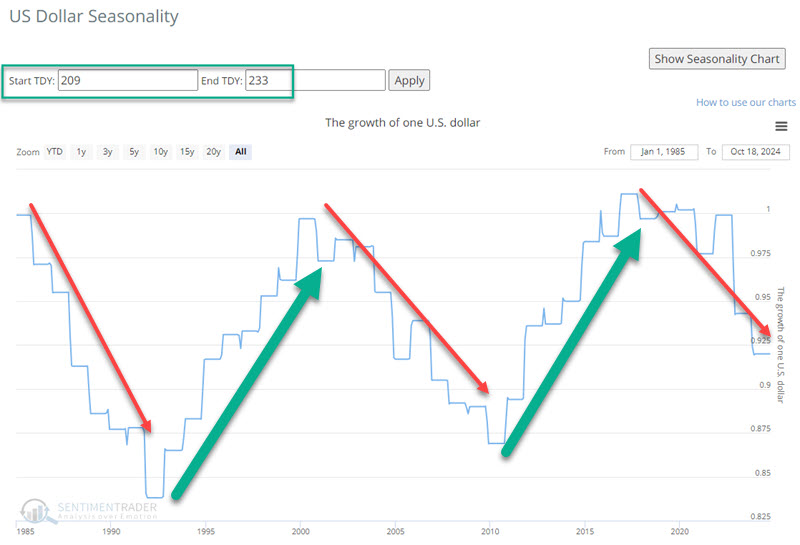
Notice the tendency for performance to be good or bad for several years at a time - and the downtrend in recent years. As long as price action remains strong, it makes sense to look favorably on the U.S. Dollar based on the favorable seasonal trend. At the same time, a trader long the dollar might consider a fairly tight trailing stop to lock in accumulated profits.
Historically, the gold and the U.S. Dollar have trended to trade inversely. However, the last several months have been a huge exception. The chart below highlights all dates when our Gold Optix indicator was above 80% while the U.S. Dollar was above its 100-day moving average.
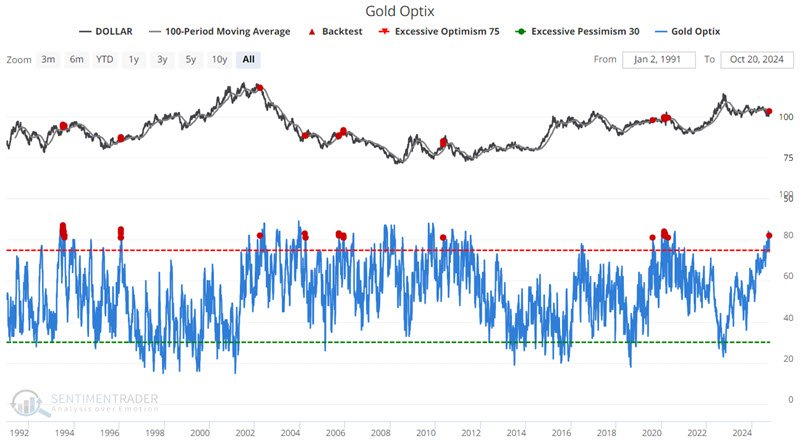
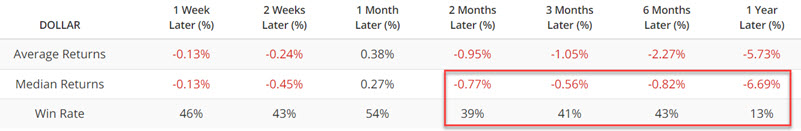
Results are subpar (negative Median Returns and Win Rates below 50%), particularly one year later, with a Win Rate of just 13% for the dollar. So again, at the moment, for the U.S. Dollar, the operative phrase is "Hope for the best, prepare for the worst."
Jay further noted that a comprehensive commodity index has tended to show extremely strong and consistent returns after the same signals in the chart above.
About TradingEdge Weekly...
The goal of TradingEdge Weekly is to summarize some of the research published to SentimenTrader over the past week. Sometimes there is a lot to digest, and this summary highlights the highest conviction or most compelling ideas we discussed. This is NOT the published research; rather, it pulls out some of the most relevant parts. It includes links to the published research for convenience, and if you don't subscribe to those products, it will present the options for access.