
TradingEdge Weekly for Oct 21 - Sentiment washout, breadth volatility, sector seasonal tendencies

Key points:
- With another surge in put buying and similar behavior, sentiment models are washed out
- Even the Big Money is almost the most bearish its been in decades
- We can thank extreme volatility in underlying breadth, which has spiked to a historic level
- High-yield bonds have struggled, too, which is a headwind for stocks
- Small-cap stocks are entering a positive seasonal window, with some oversold backup
- Small-caps tend to do relatively better than large caps after periods with a strong dollar
- Tech stocks triggered an Optimism Index reversal buy signal
- Why Utility stocks could bounce
- Commodities are now entering a seasonal soft spot
- That won't help coffee, which has plunged to a new 52-week low
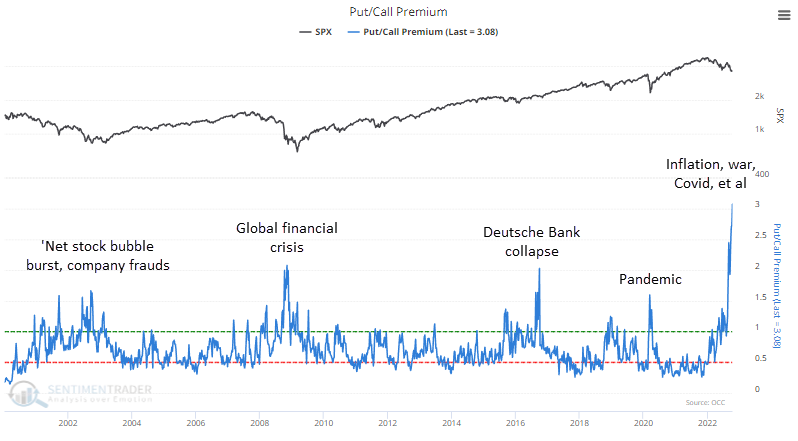
More record put buying helps push models to washed-out extremes
Last November, investors were riding high. On November 10, we looked at four sentiment models, all confirming extreme optimism.
After the latest gut-wrenching week, we mostly see the opposite condition.
One of the primary drivers of extremes in these models is behavior among options traders. Last week, for the first time in recorded history, retail traders spent three times as much on buying puts to open as calls to open. Even during the worst crises of the past 22 years, the fear was never so great that traders spent twice as much on puts.
Extremes aren't just prevalent in the options market, however. For the past month, more than 40% of our indicators have been in excessive pessimism territory. The Backtest Engine shows that the S&P 500 rose in the month following similar behavior all eight times.
If we circle back to the models mentioned in November, the four we looked at in November are updated below.
1. Dumb Money Confidence: 26% (pessimism)
2. Panic/Euphoria: 21% (panic)
3. Fear/Greed: 26% (fear)
4. Bear Market Probability: 81% (optimism)
At the end of last week, the composite of the four models slipped below 25%, in the bottom 4% of all days since 1999. When it was below 25%, the S&P 500 annualized return was+22.1%, versus -6.6% when the composite was at the opposite extreme.
Bear Market Probability is the least-appropriate model to include in the composite because it incorporates mostly fundamental and economic data, like the unemployment rate and yield curve, that are only tangentially related to investor sentiment. If we remove that model from the composite, Friday's reading was in the bottom 2% of all days since 1999.
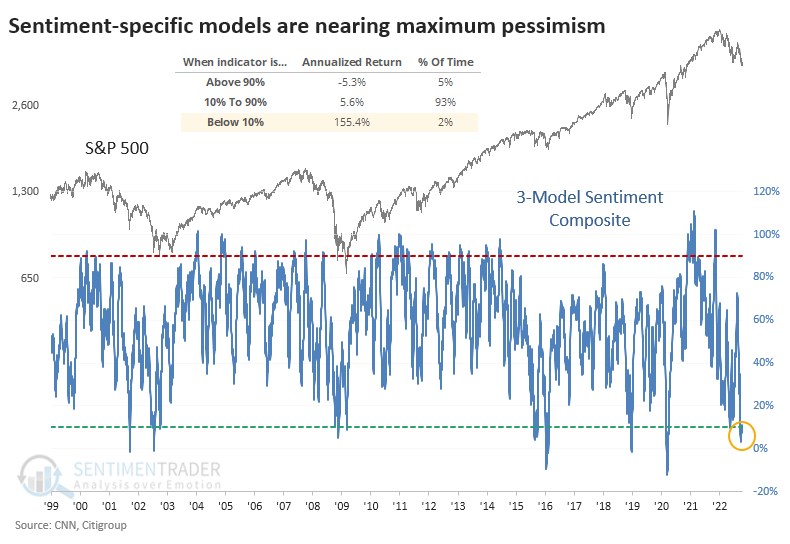
The 20-day average of the three-model composite has dropped below 11% for only the third time. The others were 2002-07-05, 2016-01-26, and 2020-03-19, after which the S&P gained at least +20% at some point within the next year, with no decline exceeding -7.4% after any of them.
The Big Money has almost never been more bearish
There are always two sides to the coin; while others are selling, some intrepid (or foolhardy) souls are doing the opposite. At extremes, the two groups tend to be diametrically opposed to each other, and there are compelling signs that we've been seeing that, with Smart Money Confidence pinned above 70% for a month.
Not all "smart money" indicators are showing optimism, though, and not all indicators that we think should be considered smart money genuinely are. One of those is the semi-annual Barron's survey of the Big Money. These are large money managers with hundreds of billions under management. But like we've seen repeatedly over the years, they can collectively suffer group-think just like the rest of us.
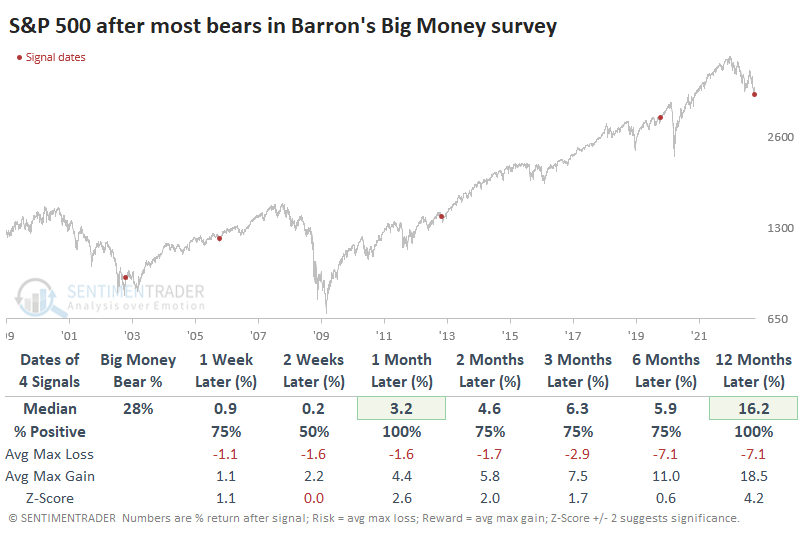
The latest survey, which concluded in early October, showed a surge in bearish managers. The summer decline moved a lot of folks out of the neutral camp, and most of those decided the negative trend was here to stay. The only survey with (slightly) more bears was from the fall of 2019, when 31% of managers expected stocks to fall.
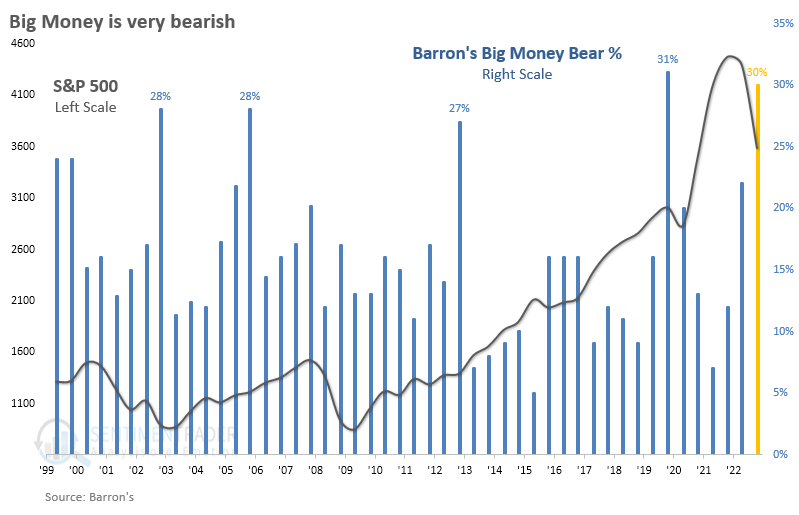
There are few precedents of so many bears, given the tendency for money managers to be optimistic, the twice-yearly nature of the survey, and the inherently limiting function of looking at extremes.
Nearing a record level of all-or-nothing days over a two-month stretch
During a bear market, it's not surprising to see many days with less than 20% of volume on the NYSE flowing into advancing securities. But there have also been many days with Up Volume holding above 80%, as shorts scrambled to cover shares and some lesser version of FOMO took hold.
The total number of extreme days in the past two months has now accounted for more than half of all trading days, a remarkable accomplishment that ranks among the most volatile in 60 years.
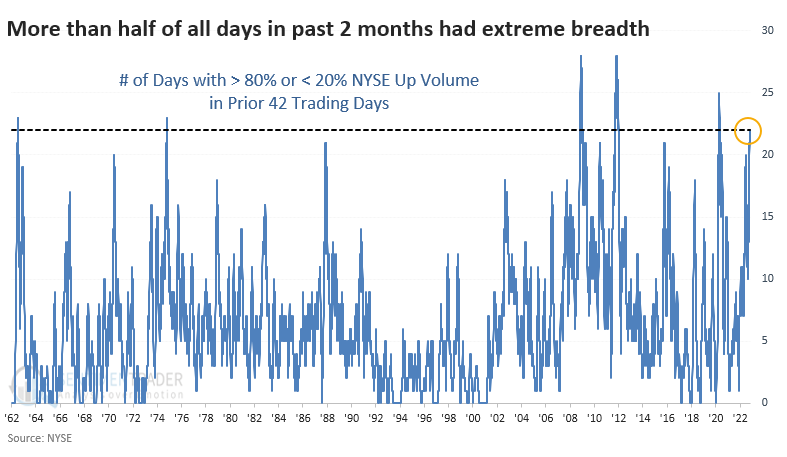
Heavy volatility should be expected during bear markets. When it gets to this level of investors whipping from one side to the other on more than half of all days, those bear markets were about over. The S&P 500 showed at least a 20% gain the following year every time.
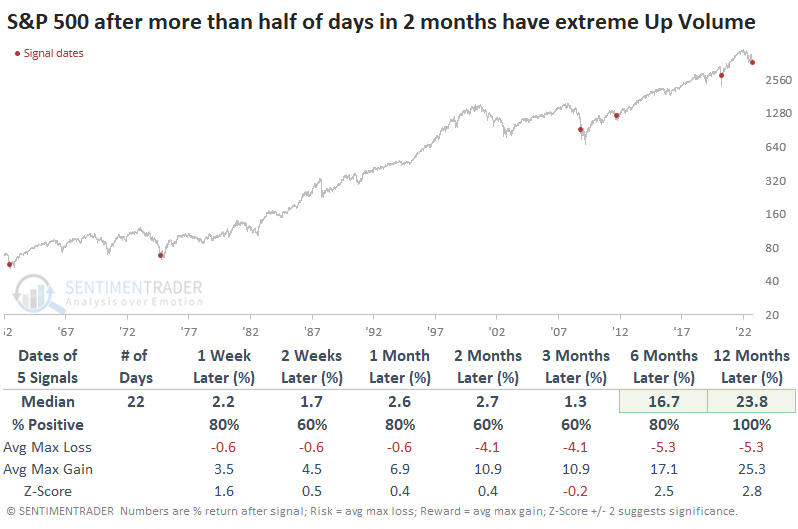
Conditions like we're seeing now are so unusual that it breeds tiny sample sizes. The sample size doubles if we relax the parameters to exactly half of days with extreme volume flows. The one-year median return dipped a bit, but a year later, all the signals still showed a positive return.
Watching high-yield bonds for clues about risk appetite
High-yield bonds are issued by companies with below-average credit ratings. The business prospects for these companies are often impacted by the same economic factors that affect the overall stock market.
They are also impacted by changes in interest rates - another factor that strongly influences stock market performance. As a result, Jay showed that the action of high-yield bonds can be a valuable harbinger of what's to come for stocks.
The chart below displays the High-Yield Bond Bond Cumulative A/D Line along with its 200-day moving average.
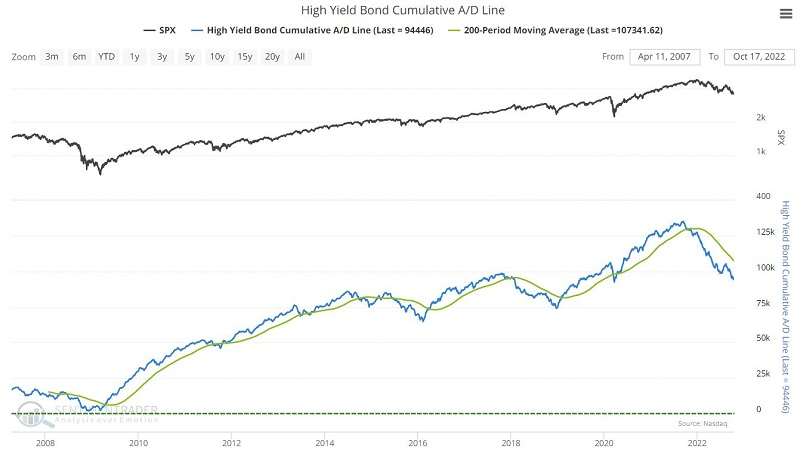
When the high-yield A/D line was above its 200-day average, the return in the S&P 500 has been impressive, returning +338.4%. When the high-yield A/D line was below its 200-day average, the return in the S&P 500 has been miserable, returning -30.6%.
The number of high-yield bonds making new 52-week highs versus those making new 52-week lows is another useful breadth measure impacting stocks.
When the high-yield NH - NL indicator was above its 200-day average, the S&P 500 returned +326.0% since 2005. When the high-yield NH - NL indicator was below its 200-day average, the S&P 500 returned -28.9%.
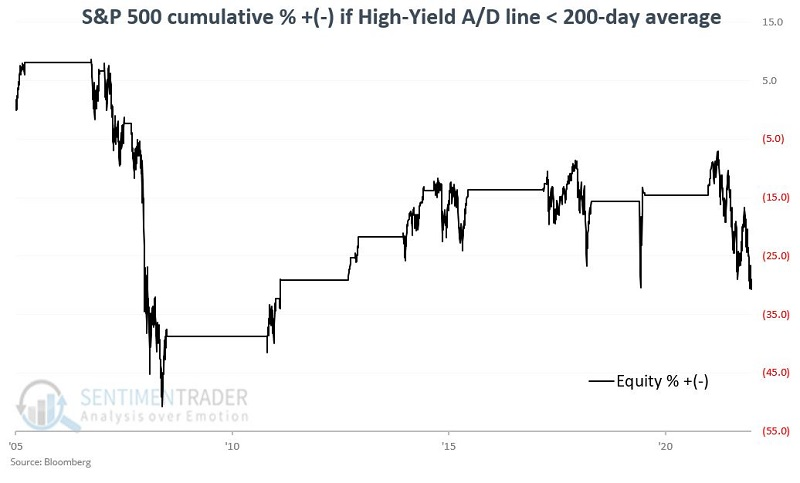
The chart below displays the cumulative percentage return for the S&P 500 if either the High-Yield Bond Bond Cumulative A/D Line is above its 200-day moving average OR the High-Yield Bond NH-NL indicator is above 0 (in black) and if both of them are below average (in blue).
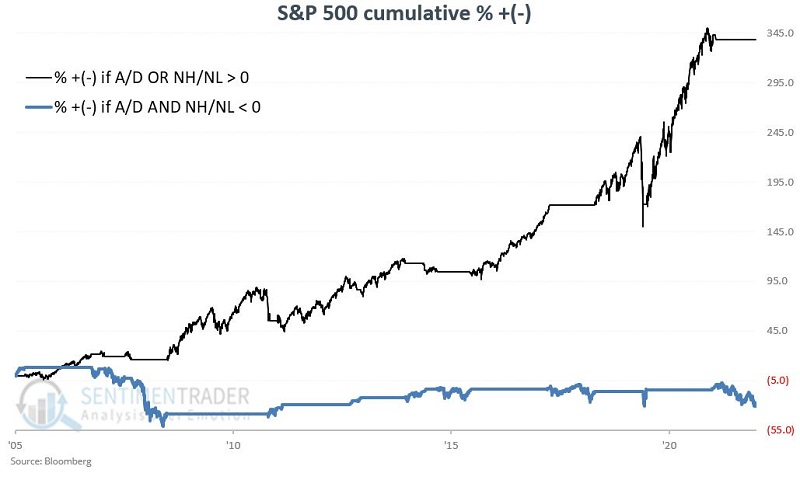
Since 2005, the S&P 500 has registered the following:
- A gain of +380.3% if EITHER indicator is bullish
- A loss of (-36.7%) if BOTH indicators are bearish
These results confirm that high-yield bond performance is a valuable confirmation indicator for stock investors.
Small-cap stocks are entering a good seasonal window with some tailwinds
Jay noted that small-cap stocks are entering their best time of the year, and a bevy of breadth indicators should give them even more support.
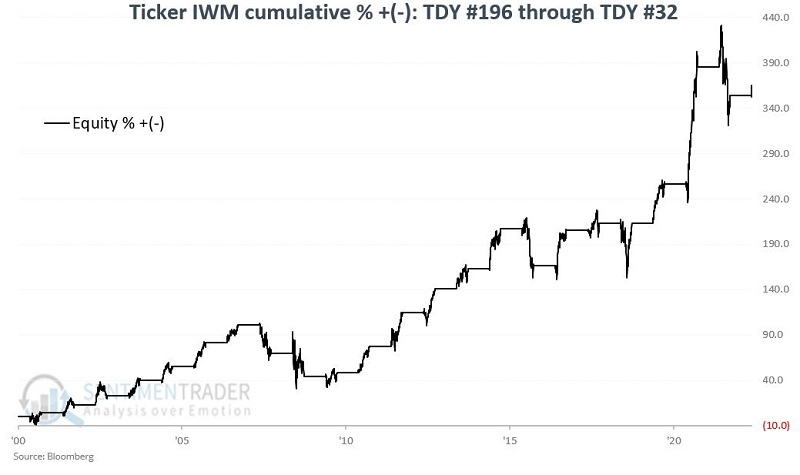
The iShares Russell 2000 ETF (IWM) has just entered a seasonally favorable period that extends from the close on Trading Day of Year (TDY) # 196 through TDY #32 of the following year. This period began on the close of October 12 and will run into early February 2023.
The chart below shows the cumulative percentage return for IWM if held only during these seasonal stretches.
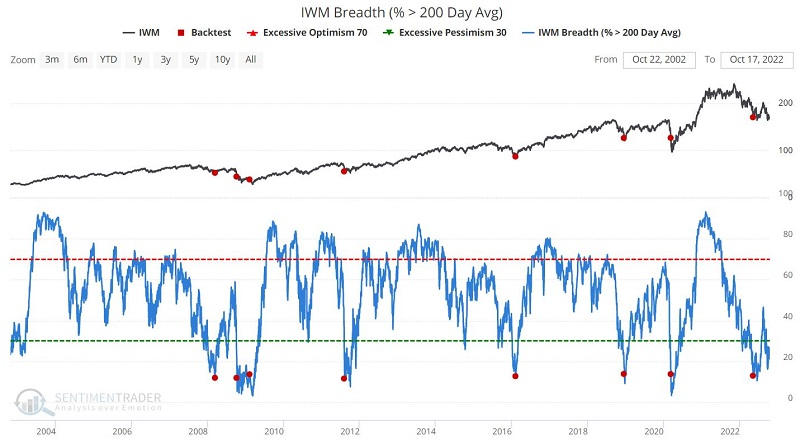
In addition to a seasonal tailwind, there have been some major breadth extremes among small-cap stocks that triggered recently.
The chart below displays those times when the percentage of IWM constituent stocks above their 200-day moving average dropped below 14% for the first time in four months. The table summarizes subsequent IWM performance. Signals tend to be early, but three, six and twelve-month results are compelling. It triggered earlier this summer, so we're in the favorable part of its historical tendency.
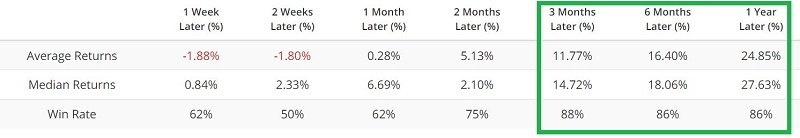
The signals from all three indicators have typically been followed by favorable price action over the next twelve months. As always, past performance does not guarantee positive results this time around. But they do offer some solid confirmation.
The strong dollar may (relatively) help, too
More and more magazines are highlighting the "unstoppable" nature of the dollar. Opinions vary on the implications, but there is one group that most agree would stand to benefit - small-cap stocks, according to a Wall Street Journal article this week.
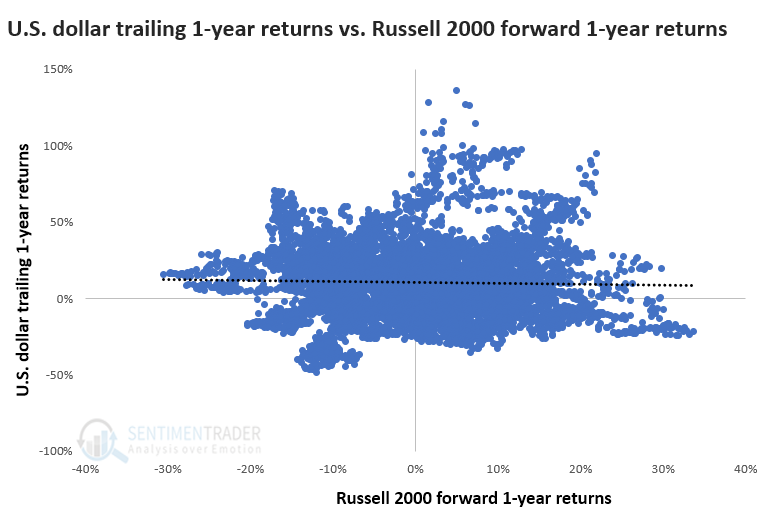
The one-year rolling correlation of daily percentage changes between the Russell 2000 and the U.S. Dollar Index is at its 3rd most negative level in history, so the relationship hasn't held lately. We're not as much concerned with past performance as future performance. The scatter plot of one-return trailing returns in the dollar versus future one-year returns in the Russell 2000 shows no correlation.
The inconsistency hits home if we look at a heat map of returns in the dollar versus small-cap stocks. The chart below shows 20 buckets of one-return returns in the dollar. The current return of more than +20% puts our current situation in the 20th bucket.
The Russell's average returns from about 20 days through 250 days forward are all red, meaning the lowest (or almost the lowest) out of the 20 buckets. The best returns (most consistent green shading) occurred in the first bucket - the worst one-year trailing returns in the dollar. The Russell also did well when the dollar suffered only modest year-over-year losses, ranking in the 6th through 9th buckets or when it was modestly strong (17th through 19th buckets).
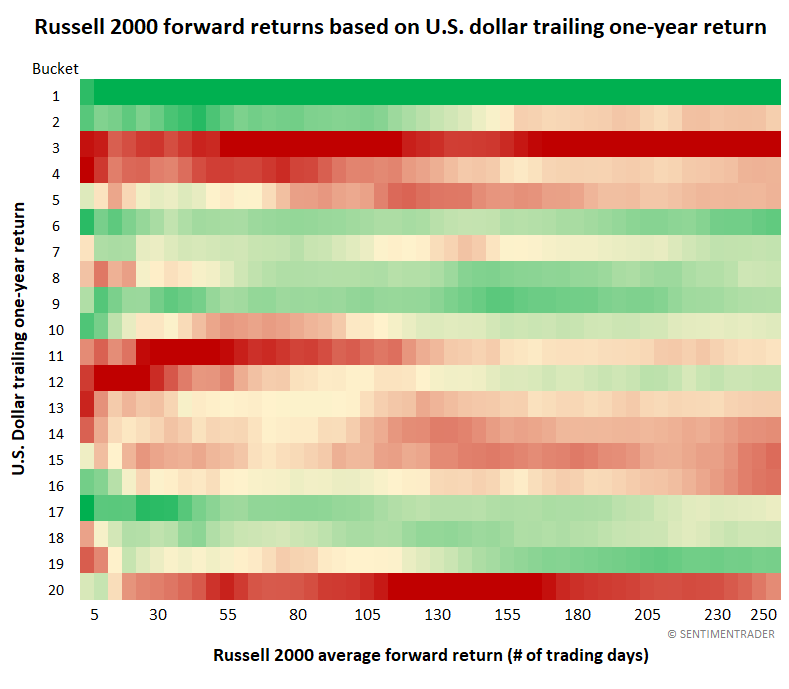
Once the one-year trailing return in the dollar reached 20% (rounded), the Russell 2000 struggled to hold gains going forward. The sample size is tiny, but three signals showed relatively large long-term losses, one a minor gain and one a large gain.
Relative to the S&P 500, small-cap stocks stood out. The Journal article alludes to this, and there is some merit. Across all time frames, the Russell 2000 outperformed the S&P most of the time, including four out of five times one and three months later.
A reversal in sentiment for tech stocks
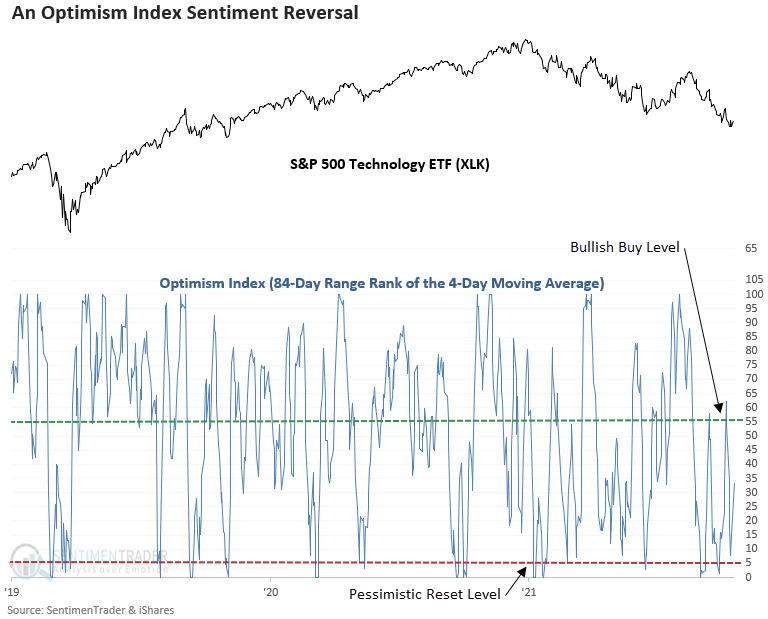
Dean highlighted the fact that technology, one of the most beaten down sectors, triggered an Optimism Index buy signal on Monday. The sector is the first and only group to initiate an alert since last week's new low in the S&P 500.
The model uses our Optimism Index to look for reversals from a very low level compared to others in recent months. Then momentum in the sector needs to turn positive to help alleviate the chances of buying into a continually declining market.
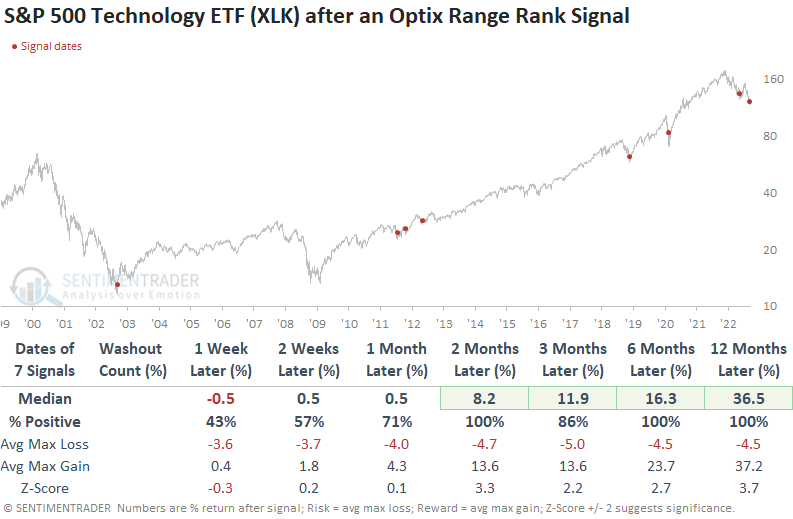
The Optimism Index trading model for the XLK ETF has generated an alert 66 other times since the creation of the Optix index in 2000. While results are solid across all time frames, the model performs better in uptrends.
Context is important. So, let's isolate Optimism Index signals for the Technology sector that triggered an alert when the Composite Washout Model signal count was >= 50%, which is the case now.
While the sample size is small, the results look excellent across medium to long-term time frames. The 1-week results show that anything can happen in the near term, especially in volatile drawdown phases.
In addition, the percentage of S&P 500 Technology stocks down > 20% from a 252-day high exceeded 90% for the second time in the current bear market last week. While rare, an additional signal is a major red flag. The previous multi-signal instance occurred during the Dotcom bear market.
While results are generally favorable after more than 90% of technology stocks enter a bear market, the signal can be early, which was the case in 1962, 1970, 1973, 2008, and 2000. And, even though a second signal is rare, we must be mindful of the big-picture risk.
A potential bounce setup in Utility stocks
Utility stocks have been hit hard, and Jay showed some factors are lining up that indicate a potential bounce.
The chart below displays the annual seasonal trend for the Utilities Select Sector SPDR Fund (XLU), which tracks the S&P 500 Utility Sector Index. The fund just entered a seasonally favorable period that extends from the close on Trading Day of Year (TDY) #200 through the last trading day of the year. This period began on the close of October 18 and will run through December 30.
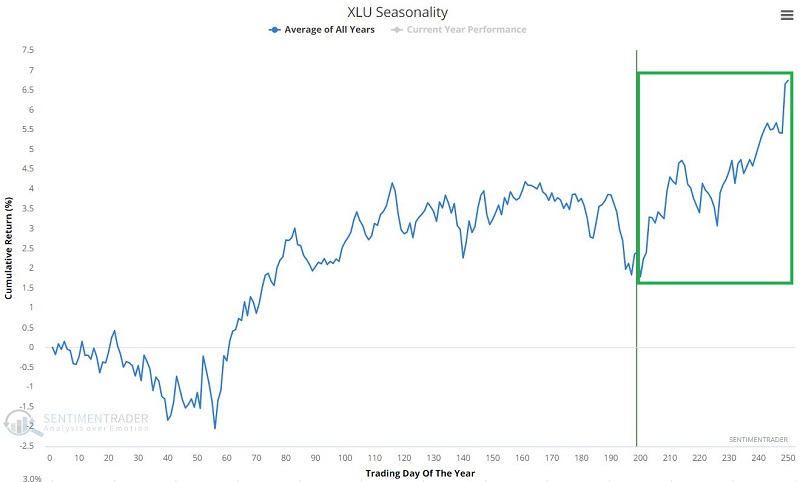
Using a different index of Utility stocks, out of the 72 years in the study period, 55 showed a gain during these seasonal stretches. Returns during the positive years averaged about double the losses during the negative years, and there were ten very large gains versus no very large losses.
The recent plunge in the utility sector set off several oversold indicators, which have historically been a harbinger of better days ahead for the sector.
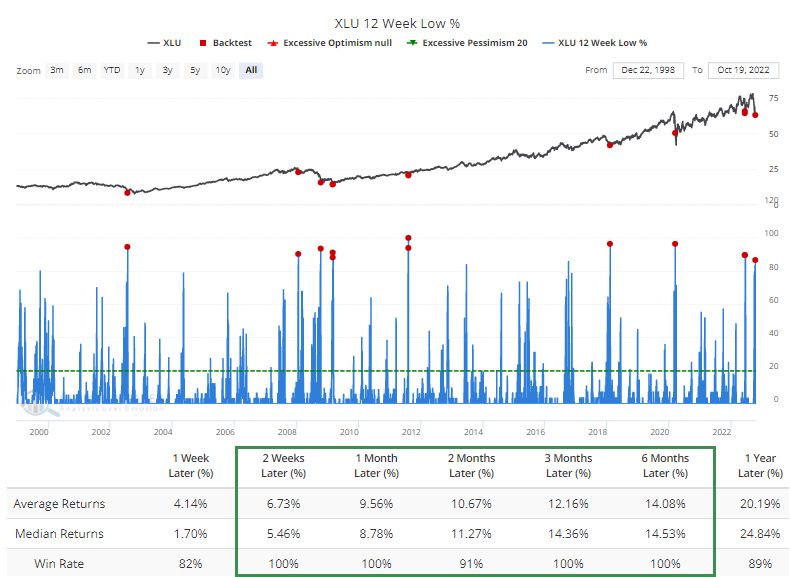
According to the Relative Strength Index (RSI), nearly 80% of utility stocks recently reached an oversold condition, which has preceded gains over the next 1-3 months 90% of the time over the past 22 years. And more than 86% of utility stocks recently plunged to at least a three-month low on the same day. That has only triggered during the worst markets, but even so, XLU sported a positive return over the medium term every time.
Lastly, there have been only three times in the past 22 years when the XLU Component Correlation rose above 0.90. Component correlation measures the degree to which the constituent stocks in a given index trend together. Extremely high readings often occur when an index is plunging sharply, and investors are dumping all stocks in the sector indiscriminately with no regard to the quality of the individual companies.
The other dates, besides the current signal, were August 2011 and March 2020, after which Utility stocks went on a tear.
Commodities tend to fall off right about now
Commodities were red-hot from mid-2020 into June 2022 but have since cooled off. Near the end of September, Dean noted the rapid deterioration in commodity trends. Jay showed that seasonality now suggests the possibility of a continuation of the recent cooling off in the commodity sector.
Each commodity has its supply and demand factors that drive price. Still, it is not uncommon for the entire commodity sector to move persistently in one direction or the other, and it has now entered the weakest time of year.
The chart below displays the annual seasonal trend for the CRB Index - an index comprised of 19 commodities.
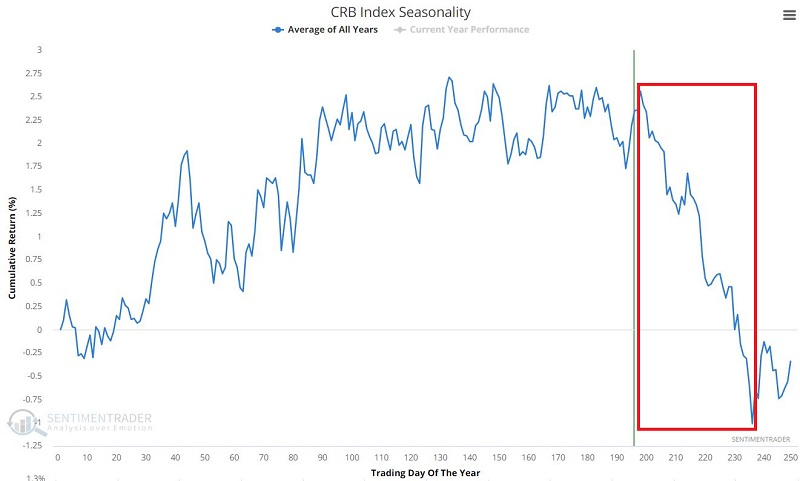
The period between Trading Day of Year (TDY) #198 and TDY #236 is clearly the most unfavorable time of year. For 2022 this period extends from the close of October 14 through the close of December 8.
The chart below shows the cumulative percentage performance of the CRB Index during this unfavorable period since 1994.
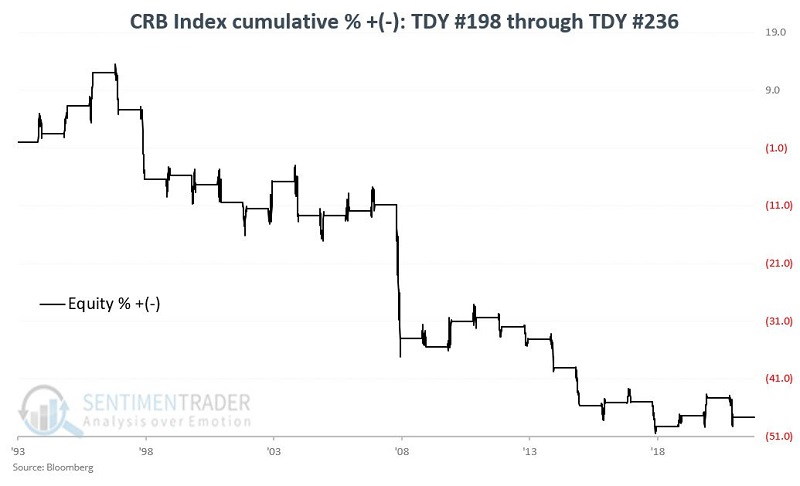
Over these 28 years, the CRB Index was positive 15 times and negative 13 times, but the up years tended to show modest gains, while the down years often suffered significant losses. It endured a loss of over -7% on six occasions; there were no gains greater than +6.3%.
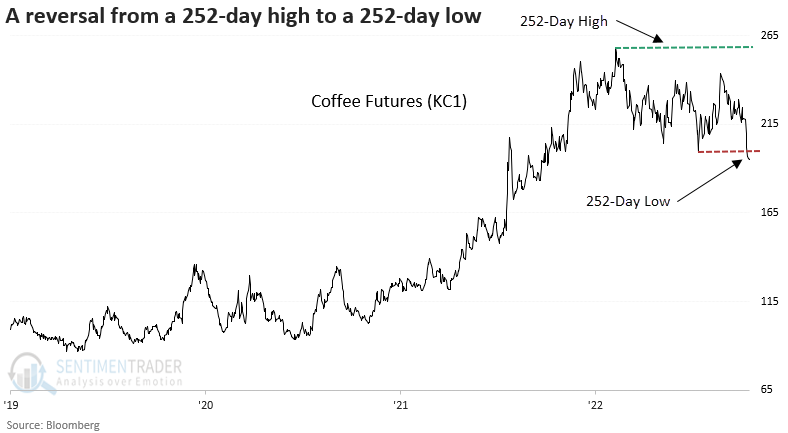
Another commodity reverses its gains as coffee falls to a new one-year low
In a previous note, Dean shared a study that suggested one should avoid buying a momentum breakout in coffee. Since the publish date, coffee futures have fallen almost 20%.
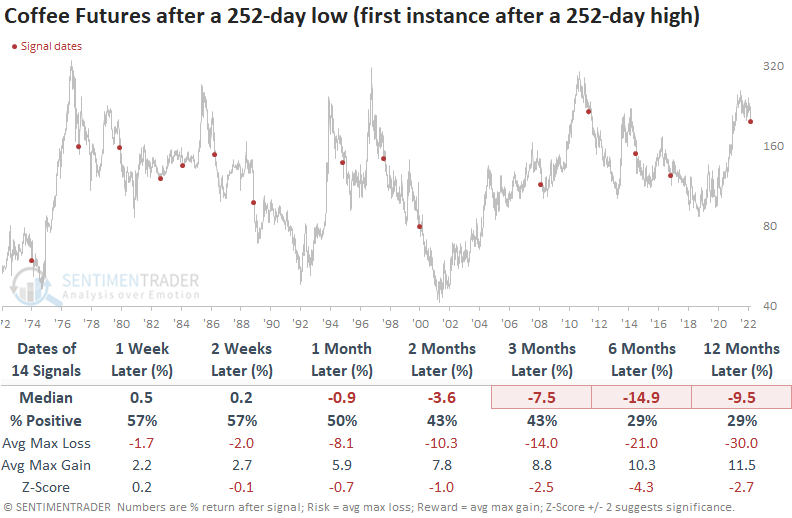
He noted that the momentum breakout bull trap is complete, with coffee closing at a new 252-day low. The low represents the first instance after a 252-day high.
The 252-day low in coffee suggests the commodity could collapse in the next 6 to 12 months, with negative returns, unfavorable win rates, and z-scores. The price pattern shows a negative return at some point in that time frame in 11 of 14 cases.
The reversal from a 252-day high to a 252-day low comes after a significant rise in coffee prices over a 2-year time frame. While rare, the breakdown in the commodity suggests a reversion to the mean.
For investors without a futures account, the iPath Series B Bloomberg Coffee Subindex Total Return ETN (JO) is an option for traditional equity-based brokerage accounts. This is not a comment on the acceptability of JO as a trading or investment vehicle; rather, it's simply to note that it is one of the few ways for non-futures traders to bet on or against coffee prices.
About TradingEdge Weekly...
The goal of TradingEdge Weekly is to summarize some of the research published to SentimenTrader over the past week. Sometimes there is a lot to digest and this summary is meant to highlight the highest conviction or most compelling ideas we discussed. This is NOT the full research that's published, rather it pulls out some of the most relevant parts. It includes links to the published research for convenience; if you don't subscribe to those products it will present the options for access.