
TradingEdge Weekly for Oct 20 - Going nowhere, bond worries, commodity signals

Key points:
- More industries are falling into a bear market
- A rolling 600-day window of S&P 500 returns jumped higher and is nearly back to even
- A warning sign from insurance on bond contracts
- There are many more long-term uptrends in Energy stocks than anywhere else
- The average emerging market stock has been pummeled
- Closed-end municipal bond funds are trading at a historic discount to their underlying value
- Netflix stock had a very big day
- A put/call ratio reversal signal in Energy
- The copper/gold ratio suggests good things for the prices of metals
- A seasonal time for caution in commodities
More industries in a bear market
Jay noted that the percentage of industries mired in a bear market is starting to flash signs of an oversold condition.
Our Industry % Indexes in Bear Market indicator shows the percentage of 23 industries that are trading more than 20% below their 52-week highs. Bull markets tend to be accompanied by low readings and vice versa. Higher readings can be potentially very bad as this action highlights a breakdown in market breadth as industry groups suffer significant declines.
Occasionally, a rise in this indicator from a low level will signal the onset of a new primary bear market - one that sees the major indexes decline -20% or more, typically over one to three years. However, historically, more often than not, a rise from a low level has accompanied a normal pullback in an ongoing bull market - and ultimately has signaled a buying opportunity.
Hence, the latest action for this indicator should be viewed not as a buy signal but as a "be prepared to buy (but also prepare to play defense if the major indexes break down further)" signal. In other words, it signals a market at a crossroads.
The chart below highlights all dates when the Industry % Indexes in Bear Market indicator crossed above 10%, and the table summarizes subsequent S&P 500 performance.
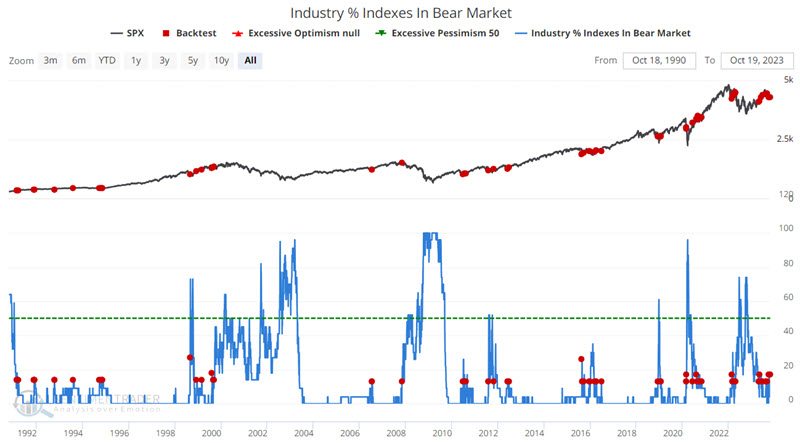
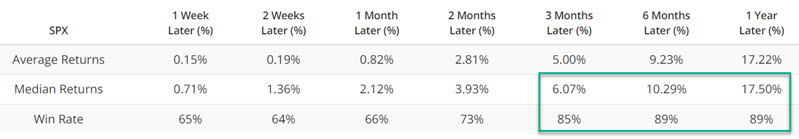
The cautionary part of this tale can be seen in 2007 and early 2022. Significant market declines followed these periods in the ensuing twelve months. Likewise, signals in early 2020 before the COVID plunge ultimately proved quite profitable but involved riding that plunge all the way down. Outside of these periods, 95% of all other signals were followed by double-digit gains for the S&P 500 twelve months later, with a median gain of 21.3%.
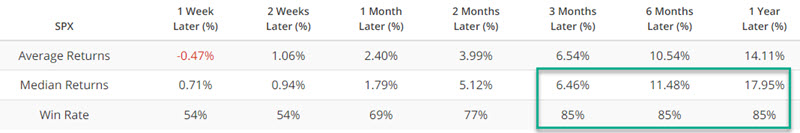
Let's filter out some of the duplicate signals in the test above. The chart below highlights those dates when the 20-day moving average for the Industry % Indexes in Bear Market indicator crossed above 10% for the first time in three months.
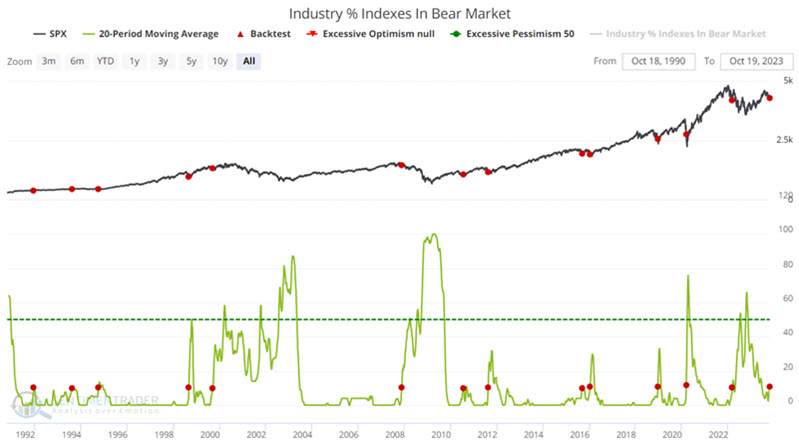
The results above again highlight the potential usefulness - and potential pitfalls - associated with using this indicator as a standalone signal generator.
The 2007 signal was brutally wrong, and the March 2022 signal would have resulted in riding the market significantly lower before the market bottomed. But the Win Rates and Median Returns for three-to-twelve-month periods remind us that pullbacks in an ongoing bull market can be highly beneficial to alerting investors with cash to invest. These numbers also remind us of the importance of giving the bullish case the benefit of the doubt.
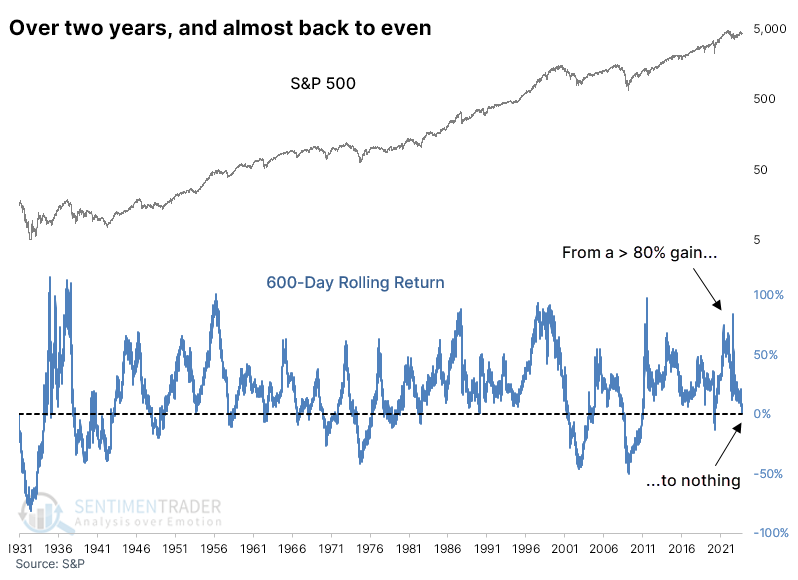
Giving it all back
Investors have been through a lot over the past two-and-something years. The big run-up to the bear market peak pushed the S&P 500's return over the prior 600 sessions to more than 80%. All that has been given back.
Before the most recent stabilization in stocks, the S&P's 600-day return had come almost all the way back to earth. Its 600-day rolling return eroded from nearly 85% to less than 1%.
Giving back gains hurts. But, investors tended to show some reflexive buying after similar cycles. The table below shows every time since 1928 when the index's 600-day rolling return cycled from above 50% to less than 1%.
Surprisingly, if it did dip into negative territory, it didn't stay there for long, at least for a while. Over the following two months, the S&P rebounded after 11 of the 12 signals, with the sole loss being small and soon erased.
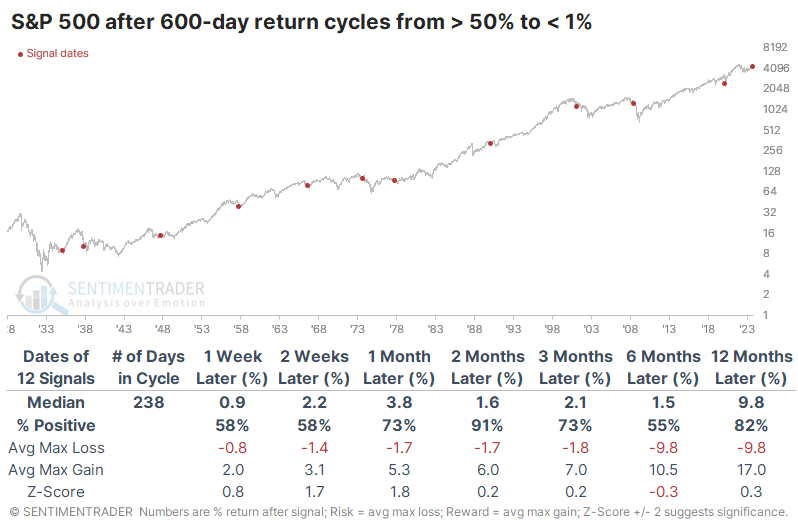
The table of maximum gains and losses across time frames shows that only 3 of the 12 signals suffered larger losses than enjoyed max gains over the next couple of months, though occurred during the midpoint of ongoing bear markets.
Defensive sectors like Staples and Health Care enjoyed some of the most consistent and robust positive returns after these cycles in the S&P. Financials, Energy, and Industrials also held up quite well, so it was an interesting hodge-podge.
A warning trend from the bond market
Jay noted that the trend in credit default swaps has reversed back to a downtrend. He discussed this more fully in late September.
The CDX Index is a "fear gauge" that measures stress in the financial markets. As such, we expect it to rise when the stock market falls and vice versa. To track the trend of the CDX Index, we use a 14-week and a 25-week exponential moving average. The chart below displays the CDX Index with its 14- and 25-week EMAs.
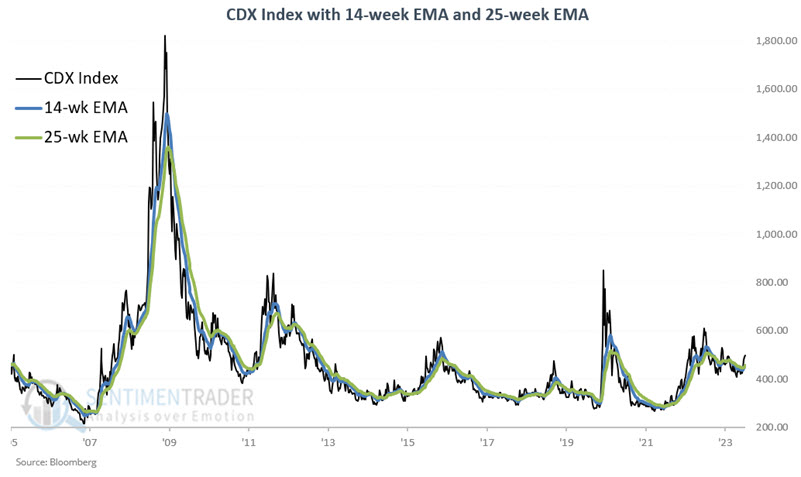
The 14-week EMA had been below the 25-week EMA since 2023-01-06 (except for three weeks from 2023-05-06 to 2023-06-02) but closed back above the 25-week EMA on 2023-10-13. The latest action removes this indicator from the bullish side of the ledger and slides it over to the unfavorable side.
Since the CDX Index was first calculated in 2005, the S&P 500 has gained +403%, while the 14-week EMA is below the 25-week EMA. The chart below displays the cumulative percentage performance (-29.5%) for the S&P 500 Index if held long only when the CDX Index's 14-week EMA is above its 25-week EMA as it is now.
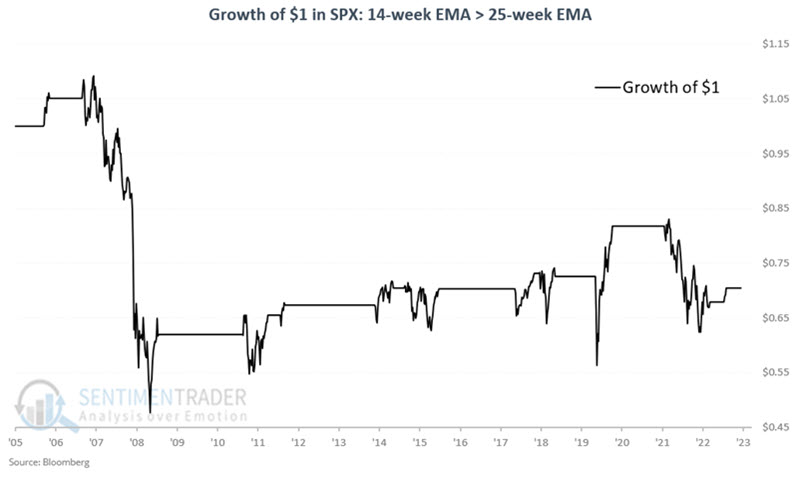
From start to finish, a number of the so-called "unfavorable" periods ended with the S&P 500 showing a net gain. On the other hand, each of these periods experienced extreme price volatility and witnessed significant, sharp downdrafts along the way. In addition, this signal nicely sidestepped large swathes of the 2008 and 2022 bear markets.
Why more uptrends in Energy than everywhere else
Dean showed that the spread between S&P 500 stocks and S&P 500 Energy stocks in an uptrend widened to a historic level. Similar divergences foreshadowed an S&P 500 rally over the next few months, but with a caveat.
While long-term uptrends in the energy sector have improved, just about every other group has seen significant deterioration. On Tuesday, the spread between S&P 500 stocks trading above their 200-day average and S&P 500 Energy sector stocks above their long-term average widened to the most substantial gap in 2023, with a reading of -53%.
Although infrequent, a substantial divergence in long-term uptrends between S&P 500 stocks and S&P 500 Energy sector stocks tends to result in unfavorable annualized returns for the world's most benchmarked index.
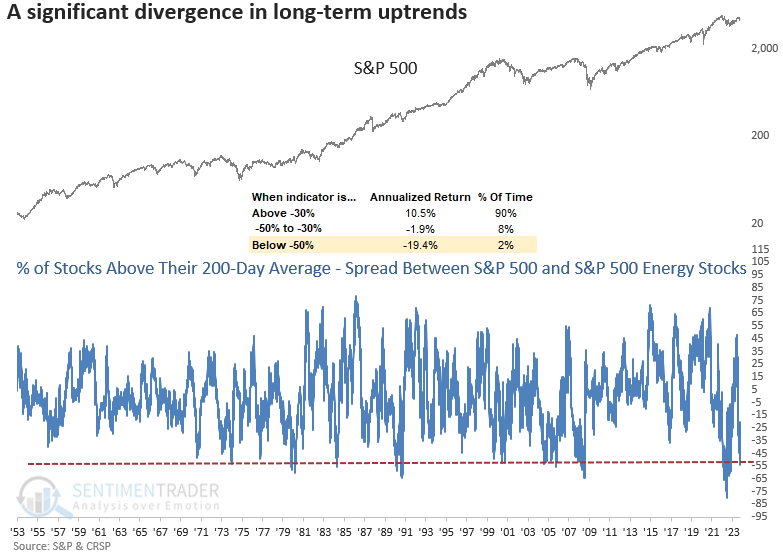
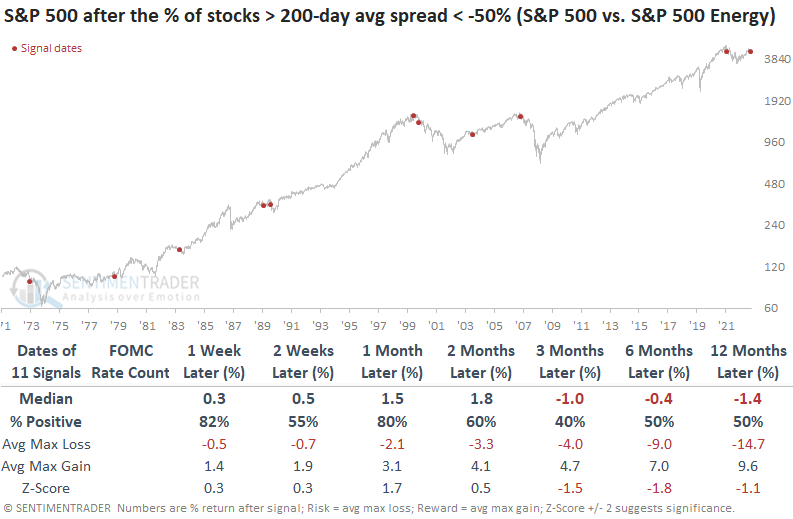
The divergence in uptrends is indicative of an oversold condition for most stocks outside of the energy sector. Therefore, it's not surprising to see the S&P 500 rally over the subsequent few months, with a decent batting average. However, we need to be mindful that several signals were triggered near market peaks or within the context of significant drawdown periods.
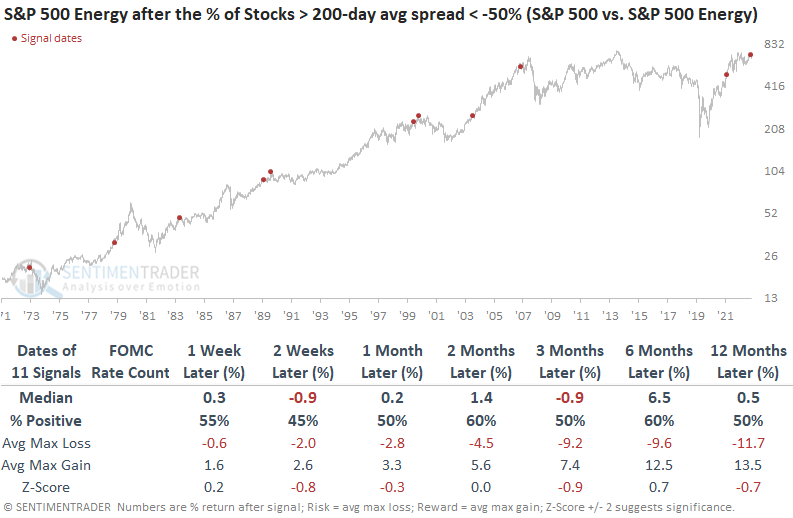
Despite a significant number of energy stocks maintaining bullish long-term uptrends, the sector somewhat struggled over the next three months, potentially suggesting investors reduced exposure to the group in favor of other beaten-down sectors.
Should the market find itself in a situation reminiscent of 2022, with a persistent spread below -50%, Technology could encounter difficulties, as historical data suggests.
The recent dip below -50% in the spread has never occurred during the initial year of a new bull market, indicating a business cycle more indicative of the mid to late stages.
Emerging markets have been slapped hard
It hasn't just been certain U.S. pockets that have suffered bouts of heavy selling pressure. Thanks to what had been an incessant uptrend in the dollar, emerging market stocks have also been sold aggressively.
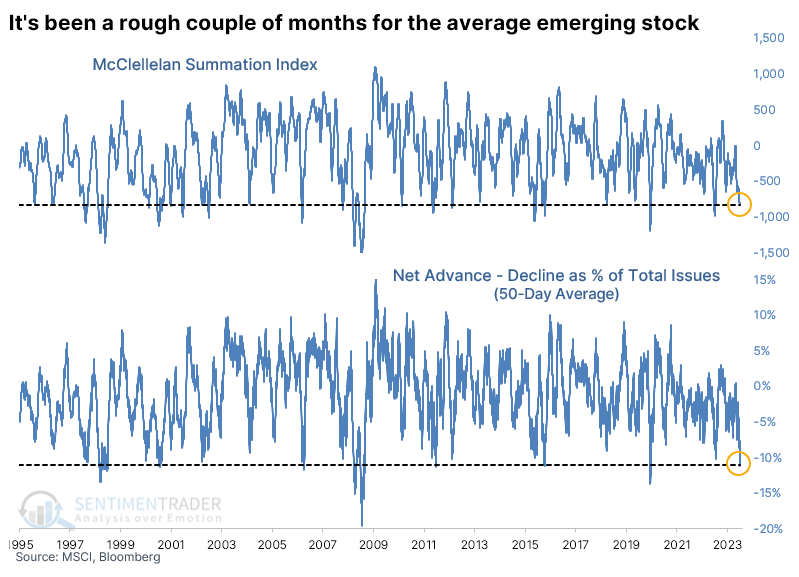
Since the MSCI Emerging Markets Index peak in February 2021, whenever breadth has turned positive over a 50-day period, rallies just about ran out of juice, if the index had managed to rally at all.
The chart below shows this 50-day average net breadth metric expressed as a percentage of the total number of stocks in the index. It has surpassed -10%, one of the most extreme figures in nearly 30 years. That woeful stretch has also pushed the McClellan Summation Index for these stocks to an extremely low level. Both indicators rank in the bottom 5% of all days since 1995.
After the 50-day net breadth indicator surpassed -10% of issues, the Emerging Markets Index tended to rally consistently for up to three months later. There was only one loss larger than -2% over the next three months, though a few morphed into painful longer-term losses. The last four signals were superb for bulls.
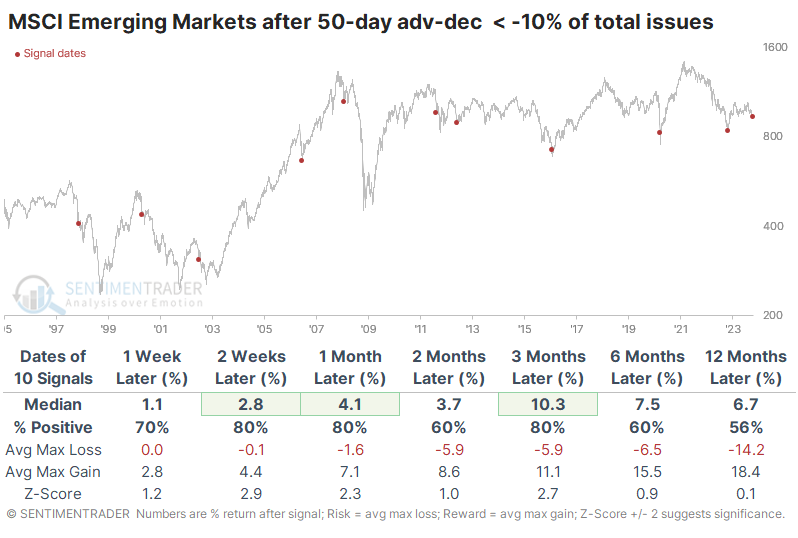
It's a similar but not quite as compelling picture when looking at the extreme in the Summation Index. Emerging markets rallied less often over the medium term, with generally lower median returns but a better risk/reward skew.
So have closed-end municipal bonds
Municipal bonds can be added to that list.
When looking at closed-end municipal bond funds, there has never been a time when they've traded so poorly for so long. A proxy index of five funds that have among the longest history (that I could find, anyway) has drawn down more than 30% from their peak. That was exceeded briefly during the 2008 financial crisis but is far beyond anything outside of that and has gone on for longer.
The funds are trading at a historically wide discount to their net asset value. The chart below shows the average premium/discount for the five funds going back to 1988.
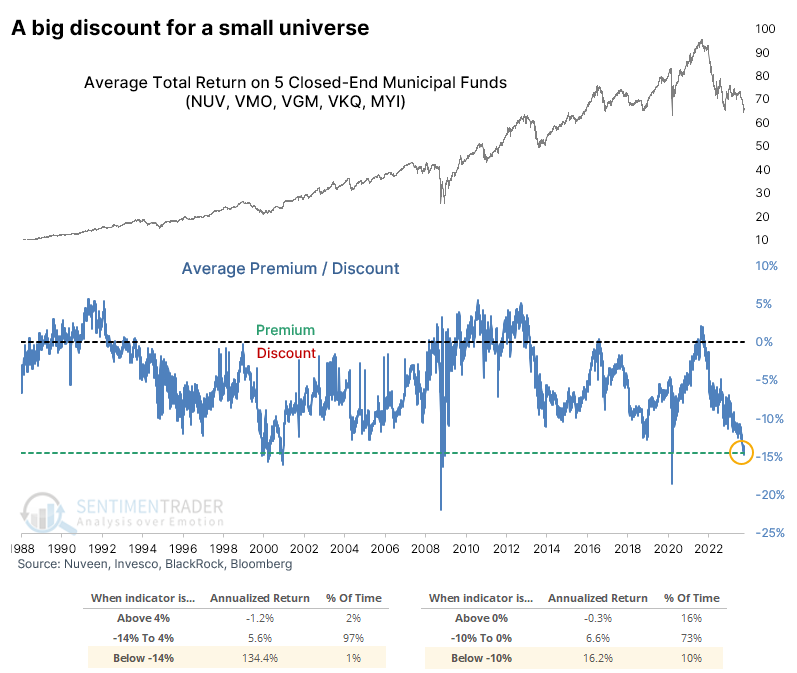
The risk/reward on these investments has been poor when they trade at a premium to their asset value, with a negative annualized total return. However, when they have traded at a -10% or worse discount, the annualized return has spiked to +16.2%. After the few days when the discount blew out to -14% or larger discount (where they are today), that return skyrockets to +134.4%. This is where we should understand the disclaimer about past performance not being a guarantee of future results.
Using a signal-based approach, the table below shows future total returns in the proxy index of these five funds when their average discount balloons to -14.5% or worse. This triggered in late September but remains the case today. A year later, each was up by double digits, though we have to consider the usual caveats about tiny sample sizes.
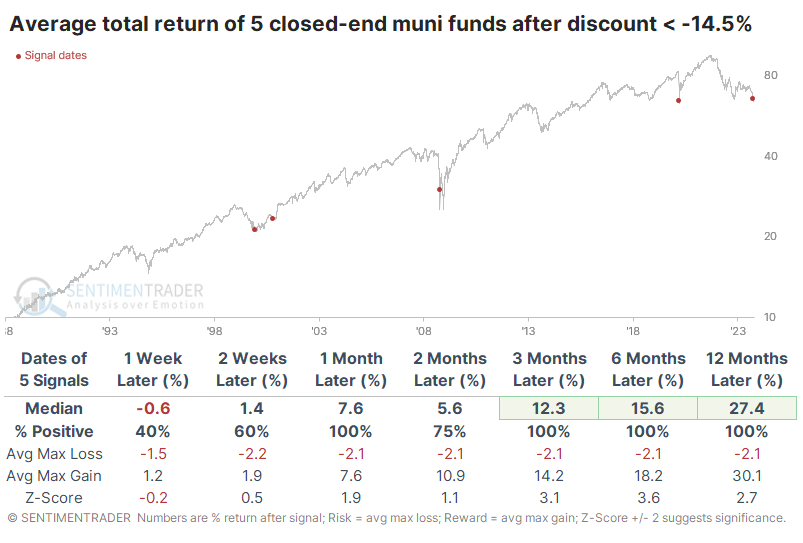
The table of maximum gains and losses across time frames shows the volatility in 2008. The funds were in a panic free-fall, along with virtually every other financial instrument. Within a week, the discounts blew out even further, and the funds lost more than 15% in value. Though it would have been challenging at the time, and maybe even foolhardy, if an investor had held on for just a bit longer, those losses were reversed and then some. Within a year, the funds gained more than 50%.
A big big day for Netflix
Netflix (NFLX) opened up 16.91%, recording one of the most significant gap-up amounts in history. Dean showed that similar surges on the open preceded a 79% win rate over the subsequent 15 trading sessions. When the stock was in a downtrend on the day before the gap, Netflix was higher every time.
Netflix surprised the market by opening up 16.91% after earnings this week, marking the 15th time it has opened up more than 15%. This remarkable gain is now history's 10th-largest opening gap.
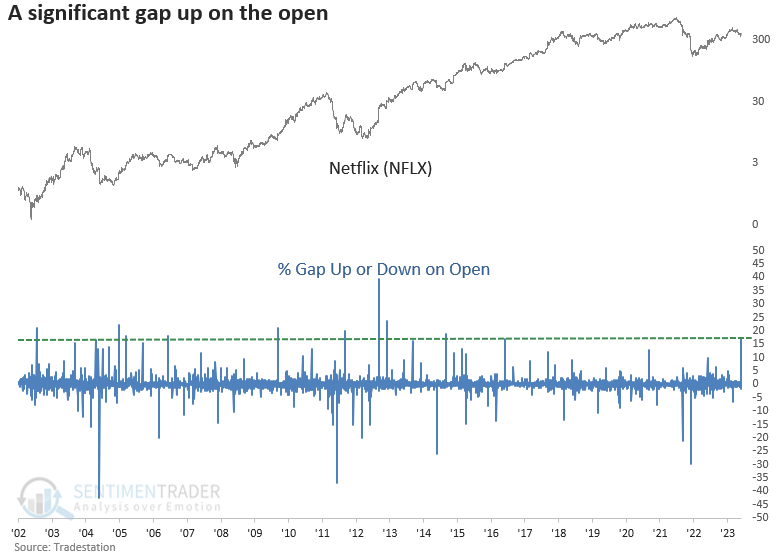
Suppose you bought Netflix on the open when it gapped up 15% or more and sold it on the close. In that case, the trade shows a win rate of 57% with a median gain of 0.28% and an average loss of -1.82%.
When Netflix gaps up 15% or more to open trading, the stock consolidates the gains over the following three sessions. After the pause, the momentum continues, with the stock showing a median gain of 6% and a solid win rate of 79%. More recent gaps show a gain for eight consecutive signals.
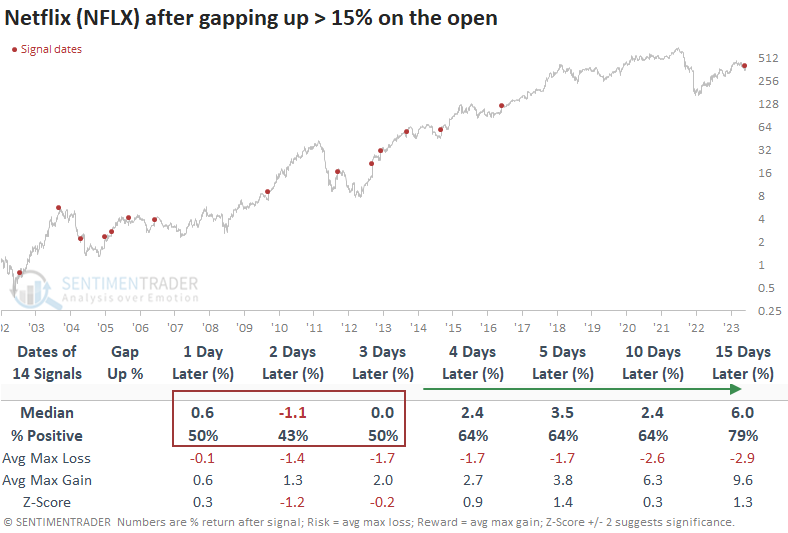
Netflix was positive at some point over the following three months in all but one instance. That precedent occurred in January 2004 when the gap happened after a significant advance from the 2002 bear market low, and the stock was trading 83% above its 200-day average.
A put/call reversal signal in Energy
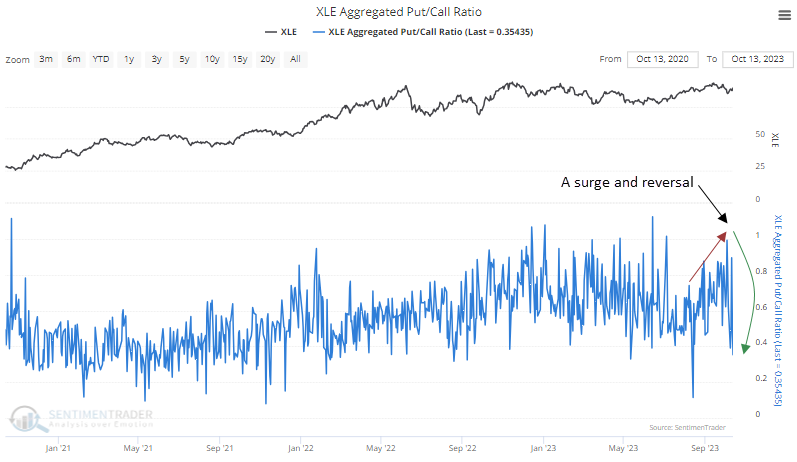
The put/call ratio for the energy sector surged and subsequently reversed, triggering a buy signal. Dean showed that similar shifts in sentiment led to excellent returns and win rates for the energy sector ETF (XLE).
During bearish market conditions, investors prefer to trade put option contracts to speculate or hedge against falling stock values. The put/call ratio can be used as a contrary indicator to identify when sentiment amongst traders has become too optimistic or pessimistic.
A trading model that monitors the aggregated put/call ratio for the Energy ETF (XLE) surged, indicating fear amongst energy traders. Subsequently, it reversed lower, triggering a buy signal.
The put/call ratio trading model applies an 84-day range rank to a 10-day moving average of the XLE aggregated put/call ratio. While the sample size is small due to limited data, results are excellent despite several signals occurring in extremely unfavorable conditions. The previous signal is the only precedent to show a loss at the two-month horizon. However, that alert displayed a max gain of 6.4% in the first month before faltering.
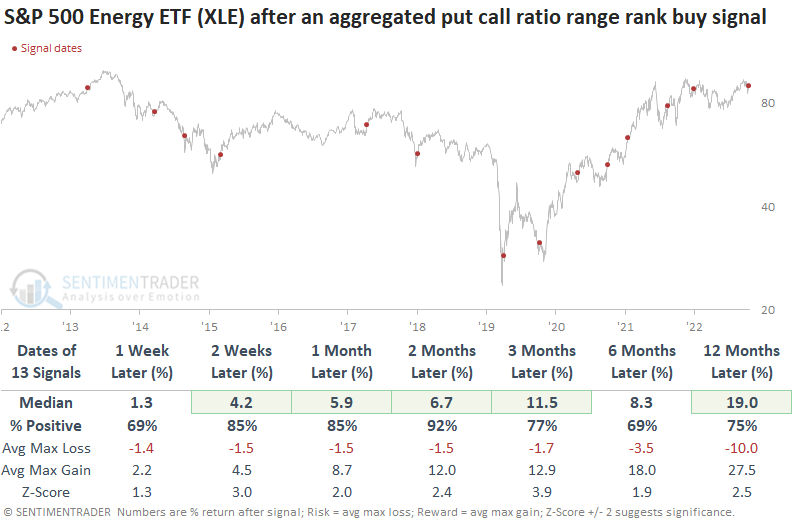
Risk reward was favorable over the following two months, with 11 out of 13 signals showing a max gain that exceeded the max loss.
Last week, the absolute and relative trend scores for the S&P 500 energy sector ETF (XLE) jumped five and six points, respectively. And it's the only sector to maintain a rising 50 and 200-day moving average. The equal-weighted S&P 500 energy sector ETF (RSPG) is the only group to maintain a positive absolute and relative strength score versus the cap-weighted index.
Positive expectations from the copper/gold ratio
Jay noted that gold receives a great deal of attention (and hype) even though it is unchanged over the past three and 12-year periods. The ratio of copper to gold just crossed a critical threshold.
As the name implies, the Copper/Gold Ratio compares the price of copper to the price of gold. It essentially measures the trend in industrial metals versus that in precious metals.
ETFs allow traders to gain exposure to commodities without trading commodity futures. SPDR Gold Shares (ticker GLD) is an ETF that tracks gold futures. The chart below highlights those dates when the Copper/Gold Ratio was below 0.19, excluding overlapping signals with 1-year. The table summarizes GLD performance.
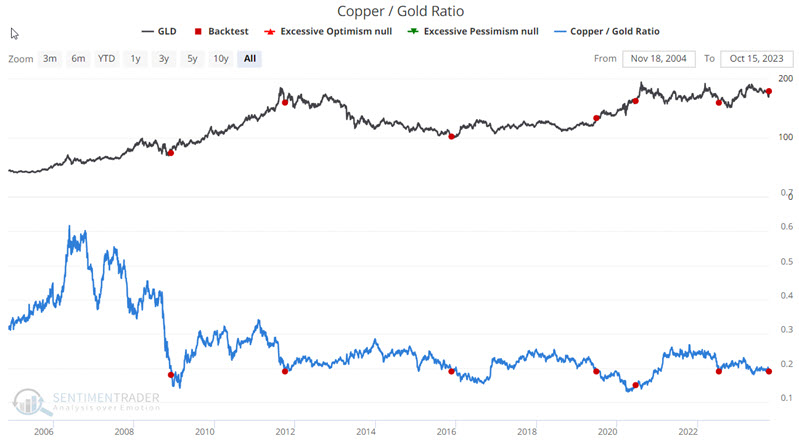

Gold rallied every time up to a month later, fell back a couple of times after that, then again showed a gain 100% of the time after a year, with a median return of more than +19%.
Jay also showed the signals against platinum, silver, copper, and gold miners, all of which showed consistently positive future returns after these same signals.
A seasonal time for caution in commodities
Jay noted that even given the state of geopolitics and the continued concerns regarding inflation, seasonality suggests that traders not throw caution to the wind at the moment when it comes to commodities.
The CRB Index is a commodity index calculated based on the prices of commodity futures. The index consists of 19 components, grouped into four groups. This index is often the benchmark for many commodity ETFs.
The chart below displays the annual seasonal trend for the CRB Index. The period highlighted in the red box extends from TDY #198 through TDY #236. For 2023, this period extends from the close on 2023-10-16 through 2023-12-08.
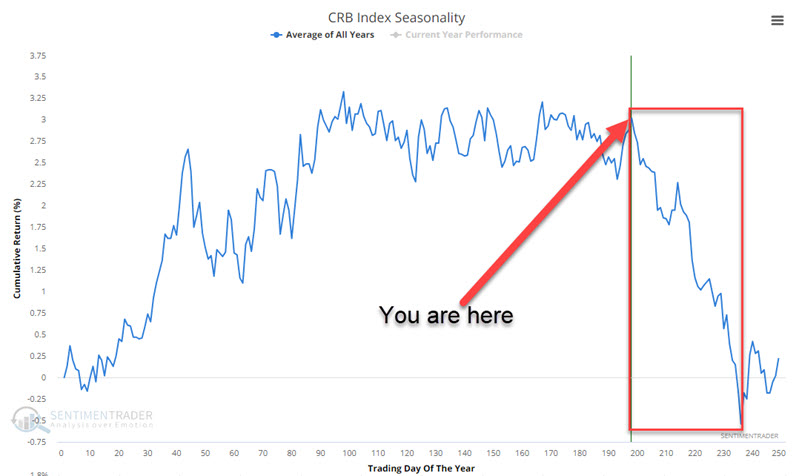
It looks pretty ominous, right? And on one hand, it is. The chart below displays the hypothetical growth of $1 in the CRB Index only during the TDY #198 through TDY #236 period every year since 1995. The cumulative result is a loss of -54.5%.
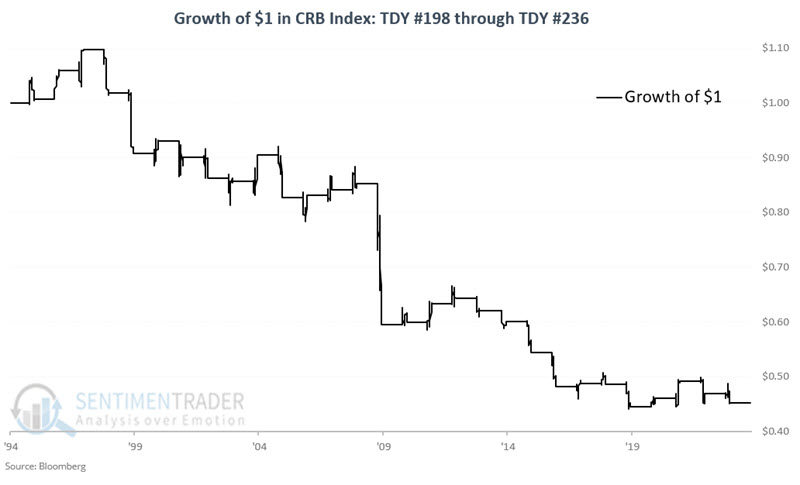
The seemingly perpetual down-trending nature of returns shown in the charts above stems from the fact that down years tend to be significantly worse than up years. The Win Rate is essentially a coin flip - 14 times up, 15 times down. However, the average and median decline is significantly greater than the average advance. Even more telling, there have been seven declines of -7% or more. There have been 0 gains over +7% (the maximum gain was +6.7% in 2020).
About TradingEdge Weekly...
The goal of TradingEdge Weekly is to summarize some of the research published to SentimenTrader over the past week. Sometimes there is a lot to digest, and this summary highlights the highest conviction or most compelling ideas we discussed. This is NOT the published research; rather, it pulls out some of the most relevant parts. It includes links to the published research for convenience, and if you don't subscribe to those products, it will present the options for access.