
TradingEdge Weekly for Oct 18 - Cyclical new highs, options anxiety, hesitant insiders

Key points:
- Many stocks in cyclical sectors have been reaching new highs
- Those highs have been especially impressive in financials and industrials
- Industrial stocks are showing impressive relative strength
- A net of nearly 20% of S&P 500 stocks have hit a new high
- The election and geopolitics seem to be causing options traders to price in higher-than-expected volatility
- Corporate insiders appear to be hesitant to buy into this rising market
- Stock investors are much more optimistic than bond traders
- The euro is heading into a seasonal soft spot
- Crude oil is facing some headwinds
Cyclical success
Over 15% of S&P 500 Discretionary, Financial, and Industrial stocks registered a 52-week high. Dean showed that similar expansions in highs produced solid returns and consistency for the S&P 500 over long-term horizons.
Last Friday, the S&P 500 closed at a new record high, and cyclical stocks dominated the 52-week highs list. For only the 31st time since 1954, over 15% of stocks in the Consumer Discretionary, Financial, and Industrial sectors hit new highs simultaneously.
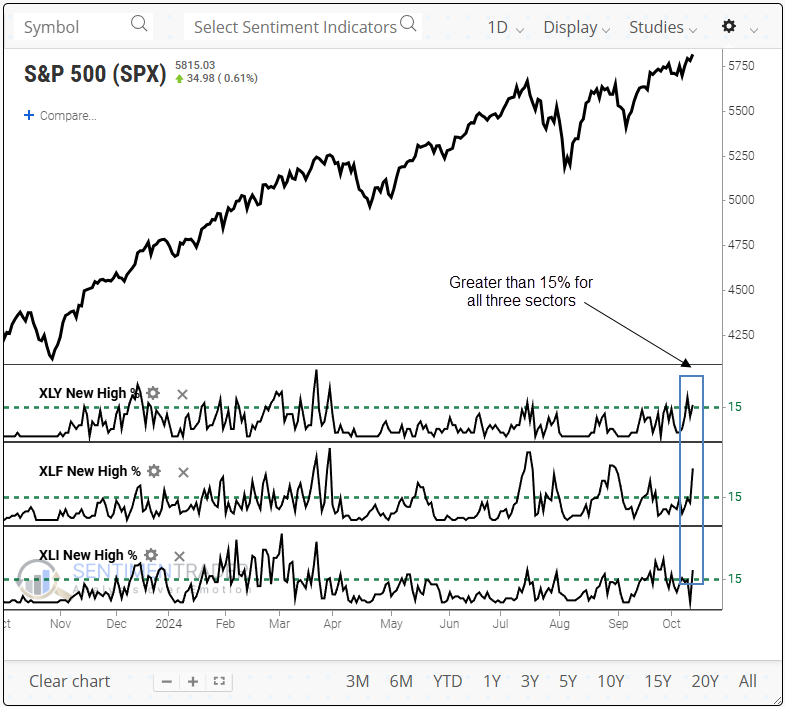
Whenever more than 15% of stocks in the Consumer Discretionary, Financial, and Industrial sectors hit a 52-week high, with the S&P 500 closing at a 5-year high, the world's most benchmarked index delivered robust returns and consistency, particularly over six and twelve months.
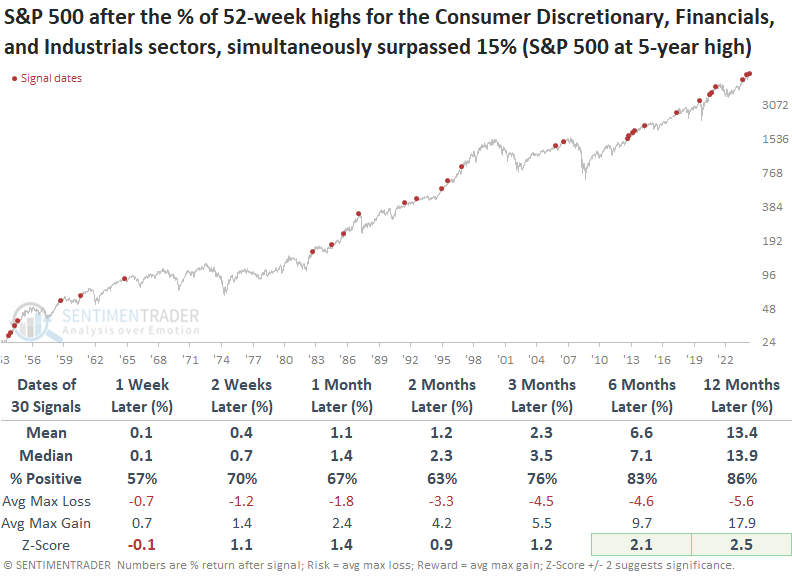
Over the subsequent year, the S&P 500 experienced just three instances of a maximum loss exceeding 10%, two of which were tied to rare, crash-related market events.
In the months that followed, Consumer Discretionary, Financial, and Industrial stocks generally outperformed the broader market.
When the S&P 500 achieves a bull market peak, the percentage of cyclical stocks recording a 52-week high has typically dwindled to only a handful of issues. In contrast, Friday's readings are well above the historical averages seen at such peaks.
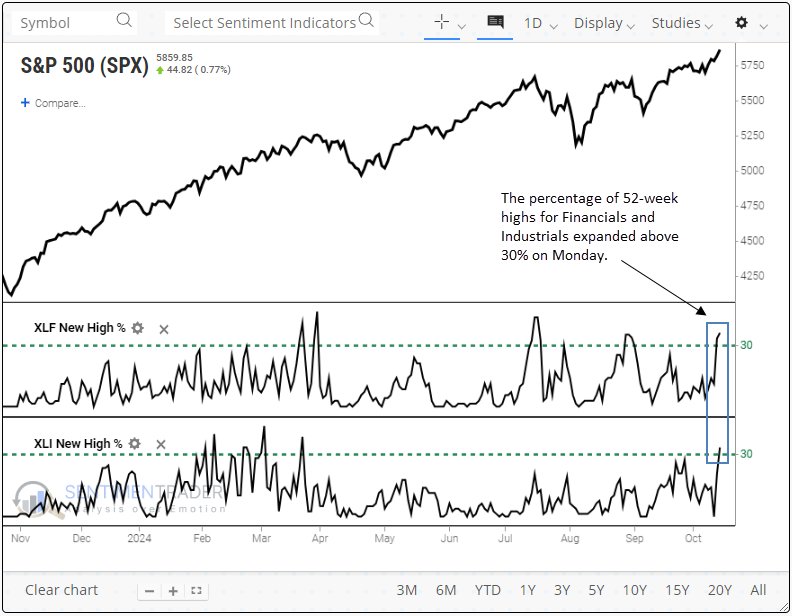
And even more success
A couple of those sectors continued their impressive run. Dean noted that over 30% of S&P 500 Financial and Industrial sector stocks registered a 52-week high on Monday.
For only the 21st time since 1954, 52-week highs for members of these sectors surpassed 30% simultaneously. The previous signal occurred in March of this year, and the S&P 500 gained 8% over the following six months.
When over 30% of stocks in the S&P 500 Financial and Industrial sectors achieved a 52-week high simultaneously, the S&P 500 posted gains in the subsequent year every time.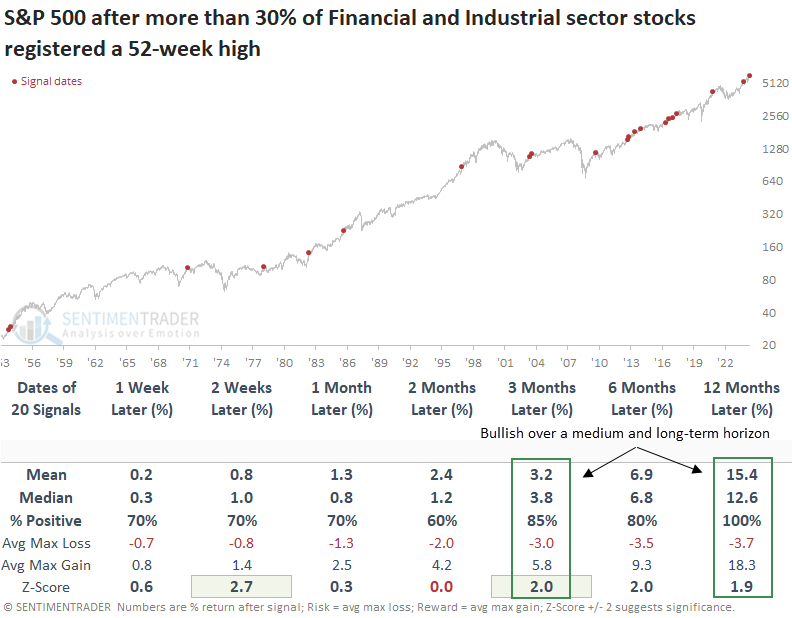
Over the subsequent year, the S&P 500 experienced just four instances of a maximum loss exceeding 5% and three precedents of greater than 10%. Furthermore, no signal surpassed a drawdown exceeding 12.4%.
With over 90% of S&P 500 Financial sector stocks trading within 5% of a 252-day high, a reading seen in only 1% of trading sessions since 1954. While rare, whenever the percentage of S&P 500 Financial sector stocks trading within 5% of a 252-day high cycled from less than 20% to more than 90%, the systemically important sector displayed outstanding returns and consistency, rising 100% of the time over the following year.
Industrial strength
Dean further noted that the equal-weighted S&P 500 Industrials sector triggered a range rank buy signal. Comparable signals near a high saw the S&P 500 rise 94% of the time over the subsequent year.
While breadth-based indicators like new highs are an excellent tool for gauging trends, relative strength analysis offers a complementary perspective on market dynamics. The equal-weighted industrials sector delivered a compelling market message after testing cap and equal-weighted sectors for a bearish to bullish transition to confirm a new uptrend in the broad market.
For the second time in 2024, a relative strength timing system triggered a buy signal for the S&P 500 equal-weighted industrials sector, with the broad market trading near a record high. The previous alert from March saw the S&P 500 gain 8% over six months.
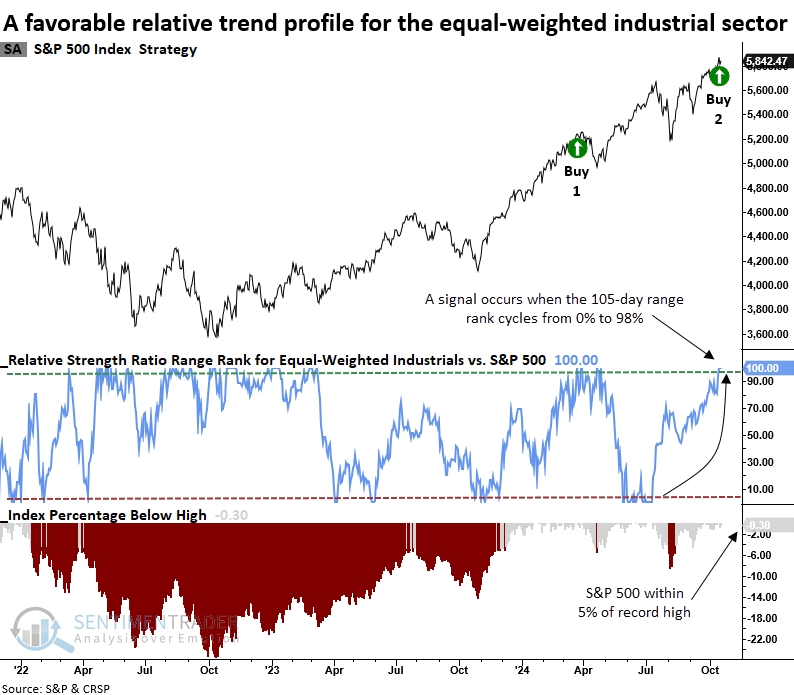
Whenever the equal-weighted Industrials sector generated a range rank buy signal while the S&P 500 closed within 5% of a record high, the world's most benchmarked index consistently delivered exceptional returns.
Over the subsequent year, the S&P 500 experienced just two instances of a maximum loss exceeding 10%, both associated with rare, crash-related market events.
Neither the cap-weighted nor equal-weighted industrials sector outperformed the S&P 500 over the following six or twelve months. In line with other recent studies, growth-oriented sectors such as consumer discretionary, healthcare, and technology surpassed the broader market. Additionally, the equal-weighted indexes generally outperformed their cap-weighted counterparts by a modest margin.
Lots and lots of new highs
Sustainable bull markets require participation among a broad array of individual stocks. Jay showed that both the Nasdaq 100 and S&P 500 indexes are presently showing strong high/low numbers.
A net of nearly 20% of stocks in the S&P 500 recently hit a 52-week high, showing strong participation on that index. The "net" part means the calculation takes the percentage of stocks at 52-week highs minus the percentage at 52-week lows. The chart below highlights those dates when the indicator value crossed above 19% for the first time in nine months. The most recent signal occurred on 2024-10-15.
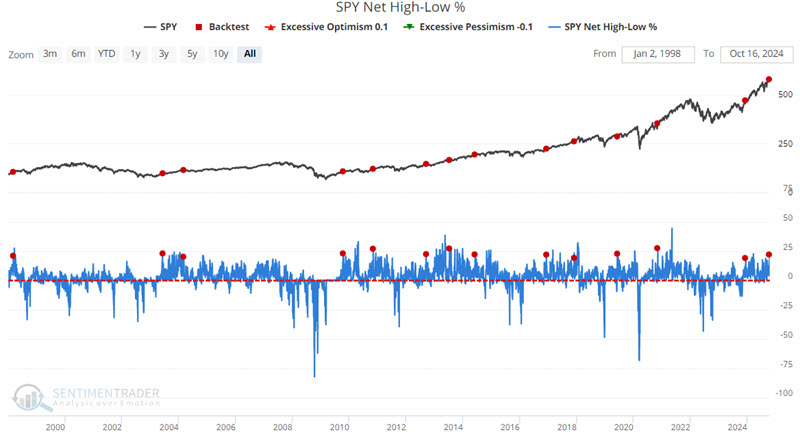
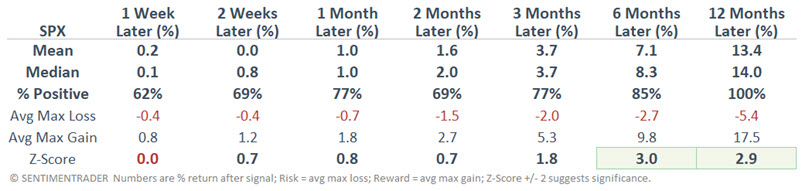
S&P 500 returns over the next 6-12 months were significantly stronger than random, and the index had a 100% win rate over the following year.
Jay also showed the the Nasdaq High/Low Ratio. This breadth ratio is constructed from the New High / New Low Ratio. It is expressed as the number of issues that closed at a new high as a percentage of the total. Nasdaq 100 returns after the indicator behaved as it has recently were strong, with an 86% win rate over the following two months.
Even so, investors are nervous by one measure
Investors are more nervous than they're supposed to be.
The VIX "fear gauge" has been elevated in recent sessions even though stocks haven't been all that volatile. Instead of using historical volatility, we looked at a synthetic VIX estimate based on six different academic models of where the VIX should be given the way the S&P 500 has behaved intraday and over time.
It has a good record of tracking the VIX over time (+0.89 on a scale of -1.0 to +1.0 since 1986). Until now. Late last week, the VIX was more than 10 points higher than the synthetic (estimated) VIX model, one of the widest spreads in years.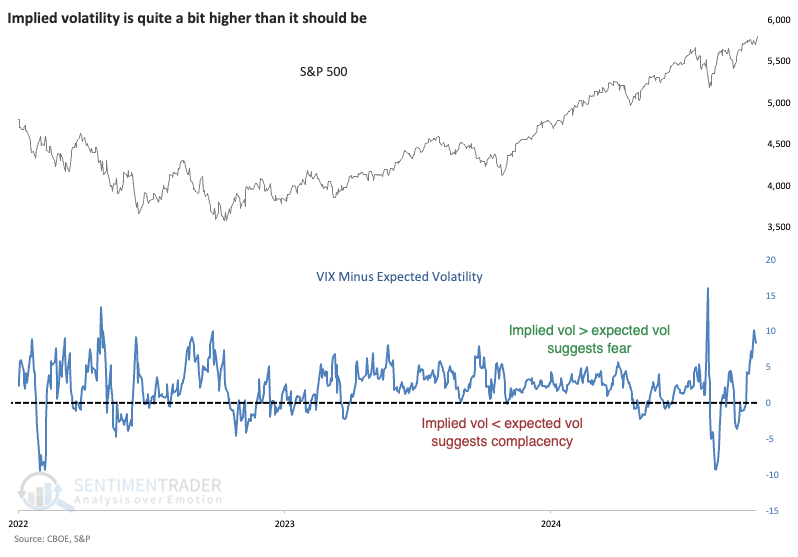
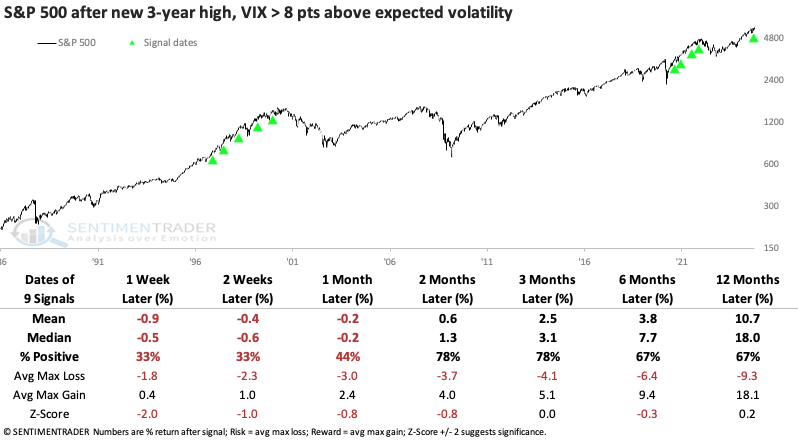
The table below shows S&P 500 returns when it closed at a 3-year high, yet there were indications of fear, with the VIX more than 8 points above where it "should" be via the synthetic model. Each time, the S&P showed no gain or a loss from a week to a month later, but only one morphed into a significant loss in the months ahead, near the peak of the 2021 mini-mania.
What's also unusual is that the VIX is relatively high, given where the S&P trades. It's highly unusual for the fear gauge to be above 20 when the S&P closes at a new high. Since 1986, it's only happened a handful of times. While the next few months were mixed, there were no large losses within the following year, and mostly gains.
While equity traders are becoming more anxious despite their most beloved index sitting at record highs, bond traders are becoming more sanguine. The spread on high-yield bond issues is coming down, not something typically seen before economic trouble.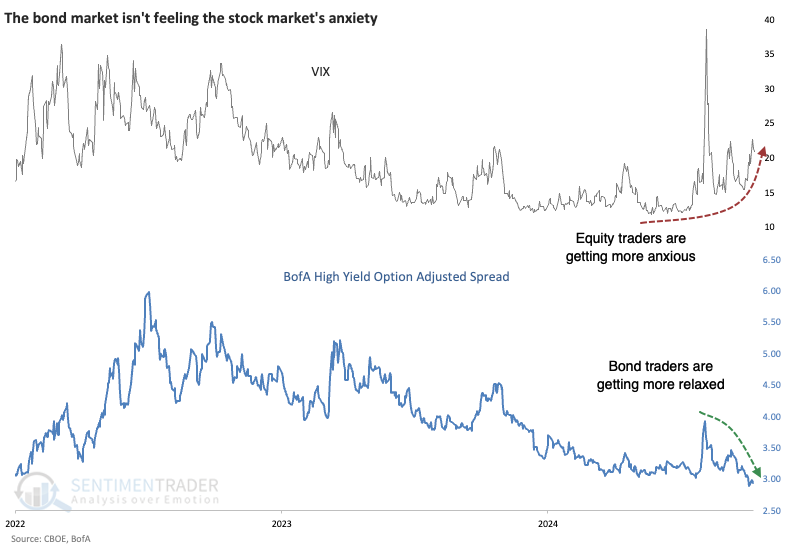
There have been only three times in 25 years when the VIX was this high, and spreads were in the bottom 5% of their range over the past few years. All preceded gains in the months ahead.
It's hard to glean much from a sample size of three, so we loosened the parameters to include times when the bond spread was in the bottom 25% of its range (instead of the bottom 5%). This greatly increases the sample size, and the conclusions are the same-it was a positive indication for the S&P 500. Bond traders were much more adept at smelling trouble than equity options traders. The VIX declined over the next 3-6 months every time.
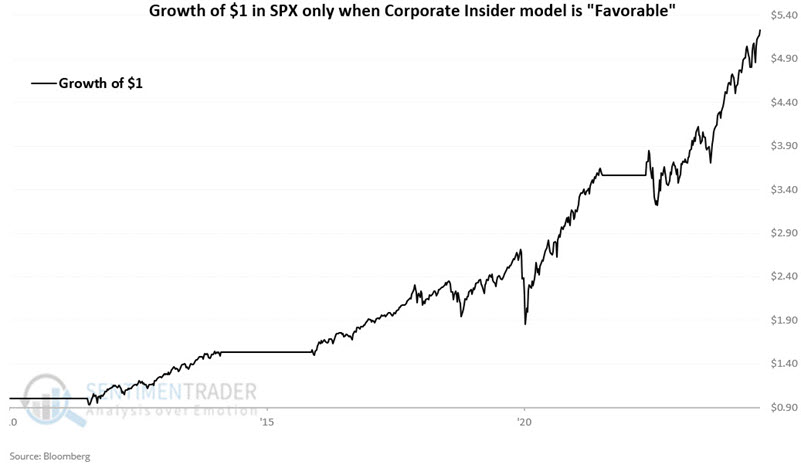
Insiders are hesitant
Jay noted that corporate insiders know their companies best, and it is helpful to pay attention when they act a particular way.
Our Corporate Insider Buy/Sell Ratio indicator shows a ratio of the total number of corporate insiders of S&P 500 companies that have bought shares on the open market during the past six months versus those that have sold shares.
What follows is not explicitly intended to be used as a standalone trading model. However, it applies specific rules to make the interpretation of insider activity somewhat more systematic. At any given time, it is rated as "favorable" or "neutral." When the status is "favorable," it suggests that investors should be aggressive in playing the long side of the stock market. When the status is "neutral," no inference should be taken either way.
If the Corporate Insider Buy/Sell Ratio is reading 0.14 or higher, the model status is considered "favorable" for stocks and remains so until the ratio touches a reading of 0.05, OR 156 weeks (i.e., three years) since the last 0.14 or higher reading goes by.
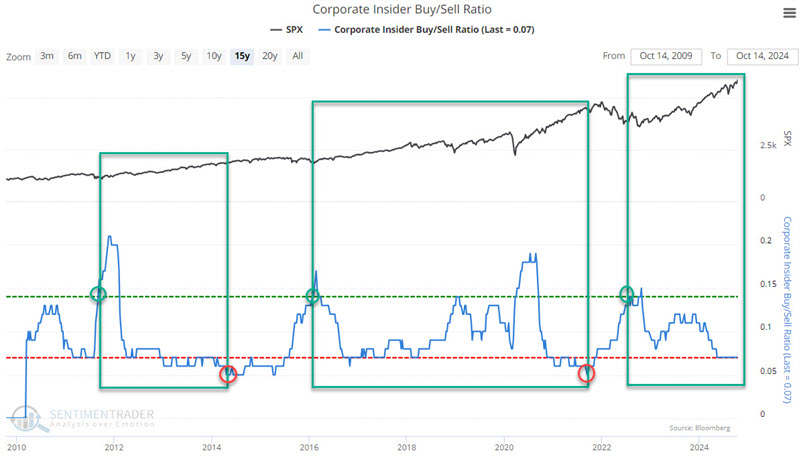
The most recent favorable period began on 2022-07-22 when the ratio rose to 0.14. The model remains in favorable status as of this week. The S&P 500's gain so far has been +47%. If the ratio does not move back above 0.14, the model will return to "neutral" status on 2025-10-31 or when the ratio drops to 0.05 or lower, whichever comes first.
The chart below displays the hypothetical growth of $1 invested in the S&P 500 only when the model detailed above is "favorable."
The chart below displays the hypothetical growth of $1 invested in the S&P 500 only when the model detailed above is "neutral."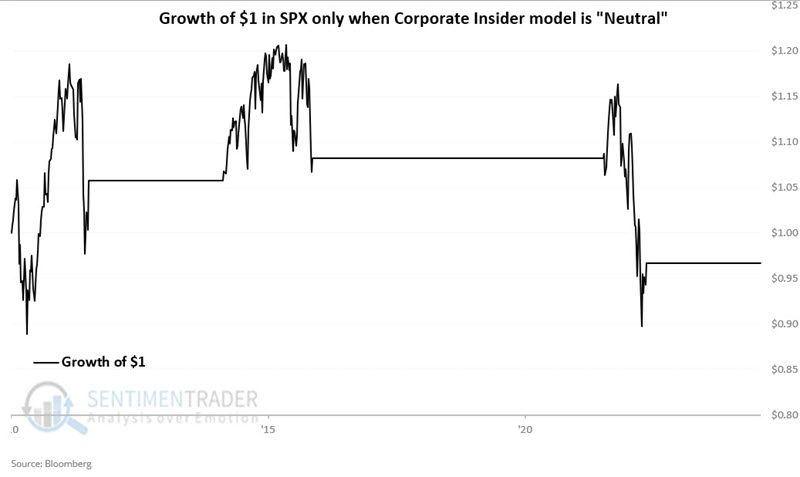
Some signs of anxiety, but stock investors are still wildly bullish relative to bond traders
There are some isolated exceptions (like the VIX), but most indications suggest that investors are optimistic about the prospects for stocks in the months ahead. It's a different story in the bond market, as bond investors are back to feeling gloomy.
Over the past 25 years, there haven't been many times when the Intermediate-term Optimism Index for stocks was more than 50% higher than the Bond Optimism Index.
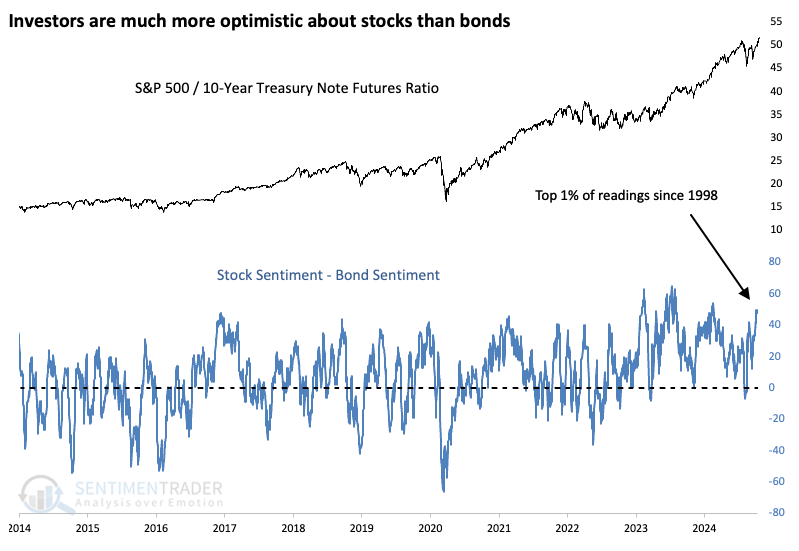
Such wide spreads were a short-term headwind for the S&P. Its returns were particularly poor over the following month, with only two winners and five losers. However, only the signal during the post-dotcom bubble resulted in a sustained decline.
The disparity was a much better sign for bonds. Three to six months later, 10-year Treasury note futures showed a strong tendency to rally, with returns well above any random time during the study period.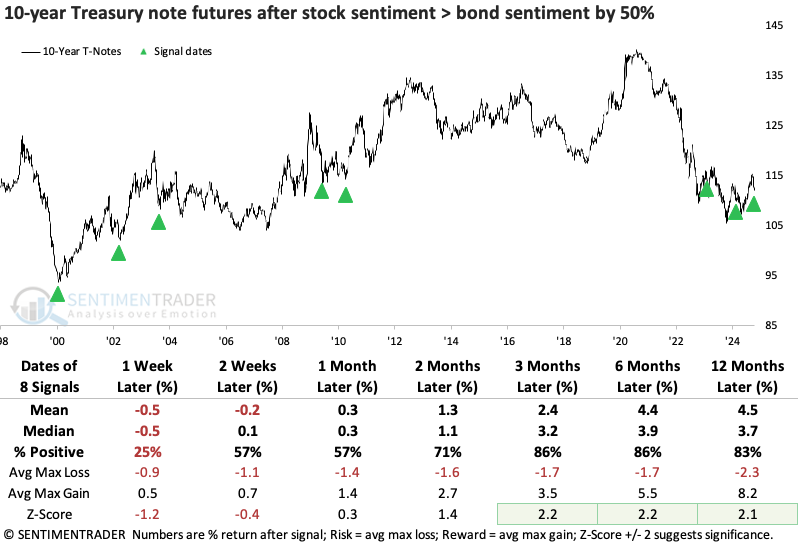
One additional wrinkle that may influence stock vs. bond returns is just how long these extremes have persisted.
The 200-day average of the Intermediate-term Optix for stocks just curled lower after nearing 70%. It reached this level and turned lower three other times, all leading to at least months of chop. It nearly reached this level in 2017, which preceded months of a melt-up market that were ultimately given back - a hard market for just about everyone.
For the bond market, the 200-day average of the Bond Optix troughed near the end of 2023 and has been climbing, but from a record low level. The only comparable period was the year 2000, which preceded sustained gains in 10-year Treasuries.
Wary euro
Jay noted that price action has been extremely weak in the last month, and the annual seasonal trend for Euro suggests the potential for more.
The chart below displays the annual seasonal trend for Euro futures. Note that it will soon enter a period of typical seasonal weakness that extends from Trading Day of Year #210 to TDY #234. For 2024, this period extends from 2024-10-18 through 2024-11-21.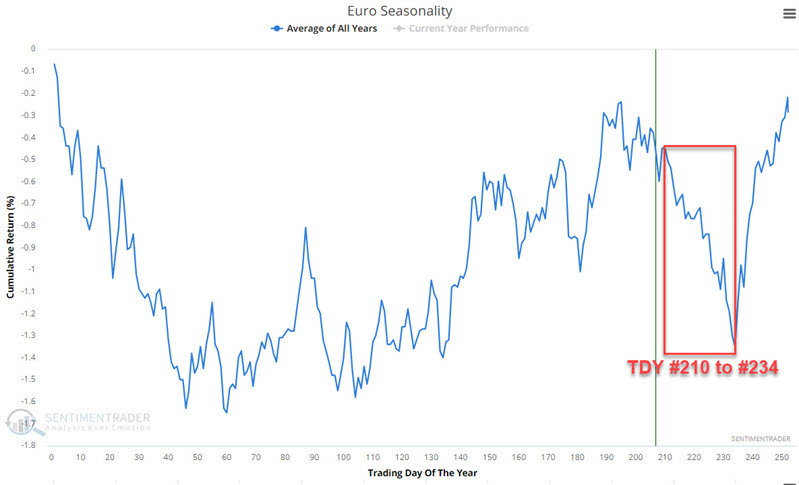 These periods were positive only 41% of the time, with large losses occurring about half again as often as large rallies.
There is an interesting quirk involving the Euro's seasonal windows in presidential election years. The chart below displays the hypothetical $+(-) achieved by holding a long position in Euro futures during the TDY #210 to TDY #234 period, only during the presidential election years that started in 1976.
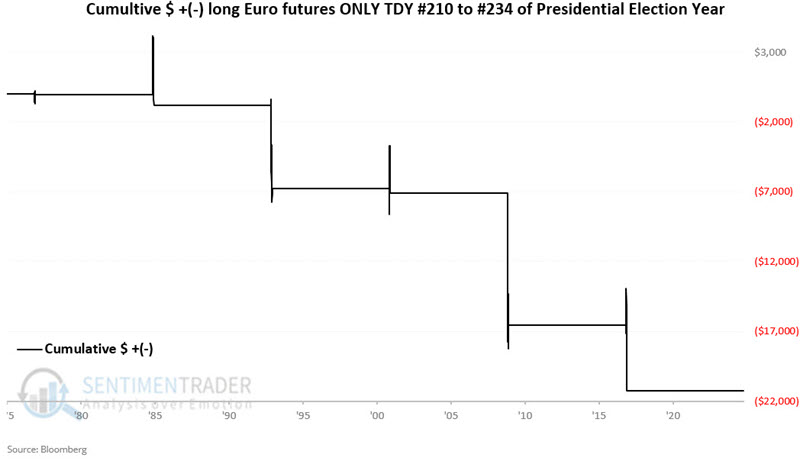 There are only six data points, so it is risky to draw any concrete conclusions, but it's compelling that all six showed a decline in the currency.
Traders who wish to play the Euro market but do not want to trade futures contracts can trade shares of the Invesco CurrencyShares Euro Trust (ticker FXE), an ETF designed to track the price of the Euro.
Oil headwinds
While attempting to establish an uptrend in price, crude oil is about to enter what is traditionally its weakest time of year. Jay warned that the crude oil futures term structure is also a potential warning sign.
The annual seasonal trend for crude oil futures shows that an unfavorable period extends from Trading Day of Year (TDY) # 200 through TDY #238. For 2024, that period extends from the close on 2024-10-14 through 2024-12-05. The chart below displays the hypothetical cumulative $ +(-) achieved by holding a long position in crude oil futures only during these windows since 1983.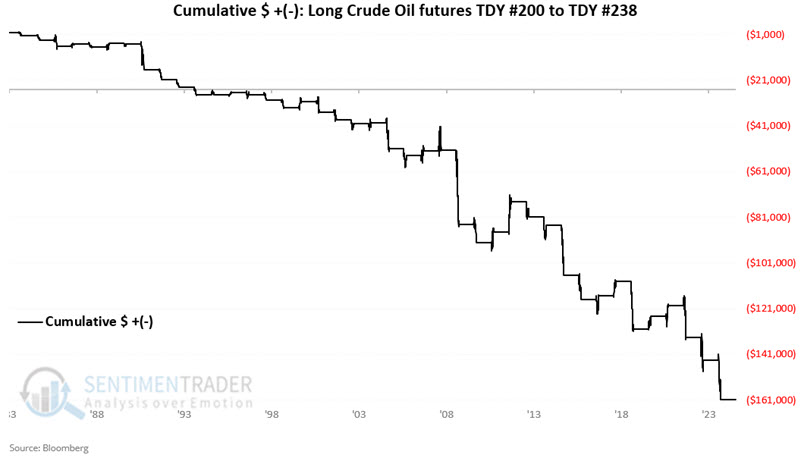
The 33% win rate reminds us that there is no guarantee that crude oil is doomed to fall in the months ahead.
The term structure of crude oil futures shows the relationship of the near-term futures contract to a further-out contract. If it is above 1.0, then the near-term contract is priced higher than the further-out contract, called backwardation. If below 1.0, then the market is in contango.
The chart below highlights all dates in the last 15 years when our Crude Oil Term Structure indicator crossed above 1.05 for the first time in 21 days.
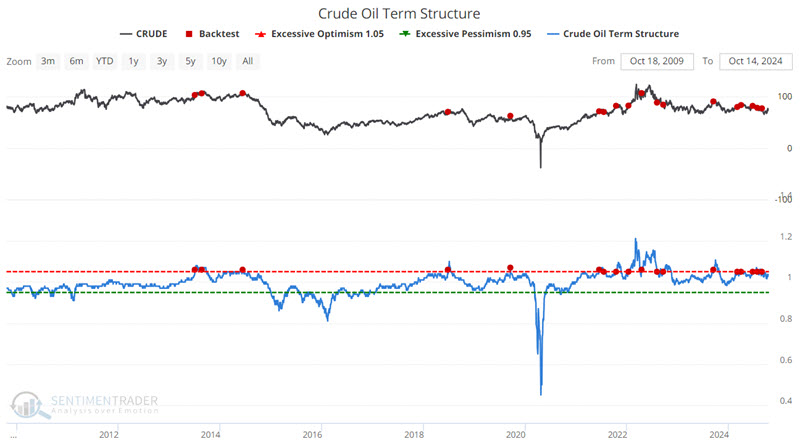
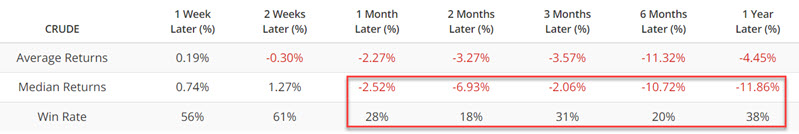
The most recent unfavorable signal occurred on 2024-08-26. Given the 18% win rate six months after a signal, this indicator still falls on the unfavorable side of the ledger.
About TradingEdge Weekly...
The goal of TradingEdge Weekly is to summarize some of the research published to SentimenTrader over the past week. Sometimes there is a lot to digest, and this summary highlights the highest conviction or most compelling ideas we discussed. This is NOT the published research; rather, it pulls out some of the most relevant parts. It includes links to the published research for convenience, and if you don't subscribe to those products, it will present the options for access.