
TradingEdge Weekly for Oct 14 - More options records, extreme price moves, washout signals

Key points:
- Large options traders once again placed record bets on a crash
- It's hard to blame them, as a fifth of all industries have dropped 40%
- No safe havens mean a historic number of big daily swings
- The severe selling pressure into this part of the year has preceded positive returns
- Oversold indicators and divergences increase the probability that we've seen a washout
- The calendar and sentiment are combining for a positive tech bias
- There has been a focus - and lots of selling pressure - in Financials
- Palladium is an out-of-the-way market showing promise
- Using other metals to look at opportunities in silver
Institutional traders keep betting on a crash (and winning)
Institutional traders have not given up betting on a crash. So far, it seems to be working for them.
Last week, the largest options traders in the market spent more than $10 billion on buying put options to open on individual equities. That is, by far, a record high and is nearing an all-time record spent by any group of traders on any options strategy ever.
As a percentage of the total market capitalization of U.S. stocks, last week's put buying was still quite a bit below October 2008. But when we net out the speculative activity and express it relative to market capitalization - the most honest, objective way to view this data - it's on par with the week ending October 10, 2008.
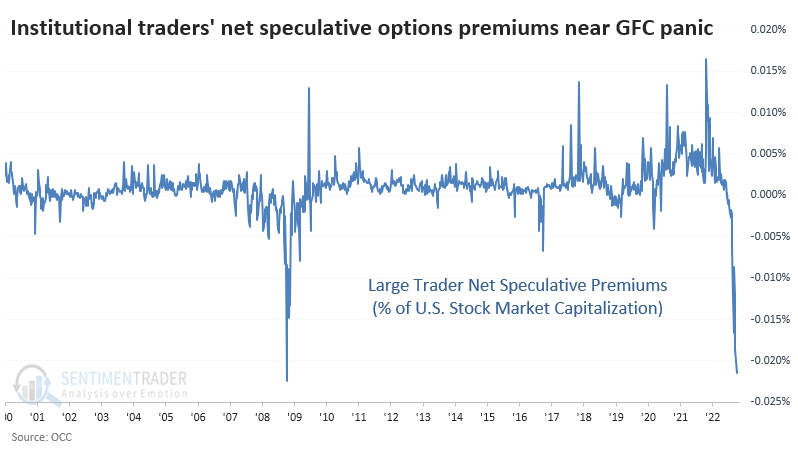
There is some evidence that the activity we're seeing now is even more speculative (on the downside) than that from 2008. As the Wall Street Journal noted recently, much of that volume is in ultra-short-dated options.
When we see heavy activity in highly leveraged, extremely short-term instruments, it signifies excessive confidence among the traders. One thing that markets will teach all of us is that excessive confidence is a recipe for humility.
Hard to blame them, with a fifth of industries crashing
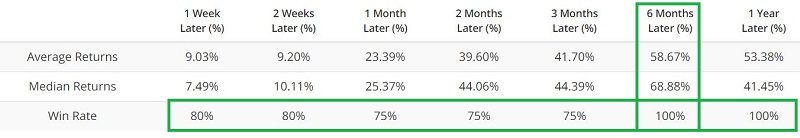
Dean noted that the big-picture backdrop continued to deteriorate as more and more sub-industry groups declined by a significant amount relative to their annual highs. For only the 20th time since 1929, the percentage of sub-industry groups down 40% or more from a 252-day high exceeded 20%.
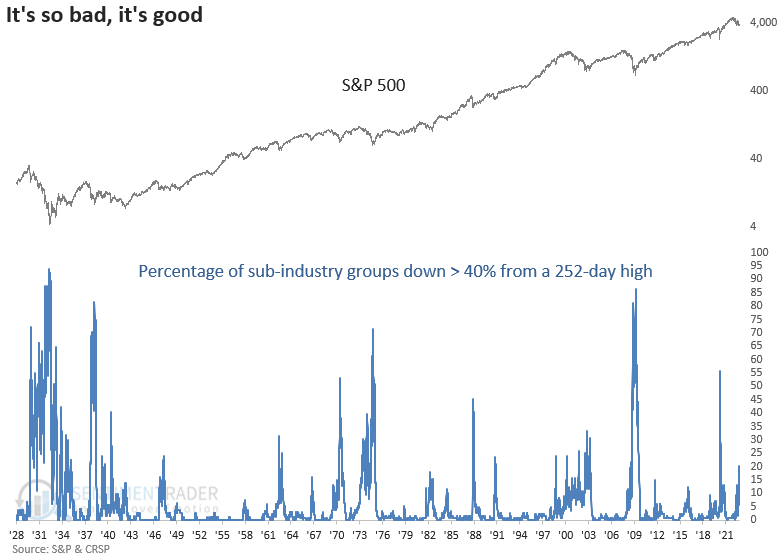
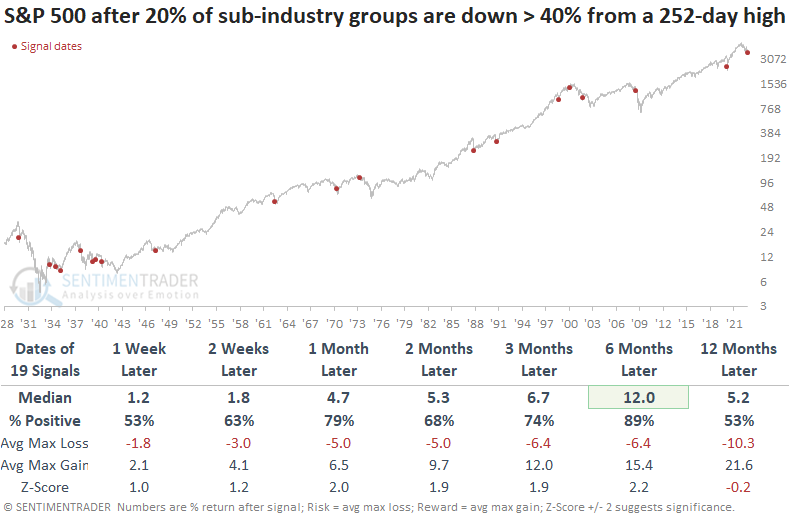
When the percentage of sub-industry groups down > 40% from a 252-day high exceeds 20%, the S&P 500 typically rebounds on a medium-term basis. i.e., It's so bad, it's good. The signals in 1937 and 2008 were the exception, with pretty sizable drawdowns in the six-month window.
Returns and win rates deteriorate in the 12-month period, which should act as a reminder to keep an open mind concerning all outcomes.
Sub-industry groups within the consumer discretionary sector dominate the number of groups down > 40% as the toxic mix of high inflation and rising rates impact the consumer.
On the brighter side, groups within the financial sector are almost nonexistent on the list. That's a good thing, as it lessens the likelihood of a banking crisis in the near term.
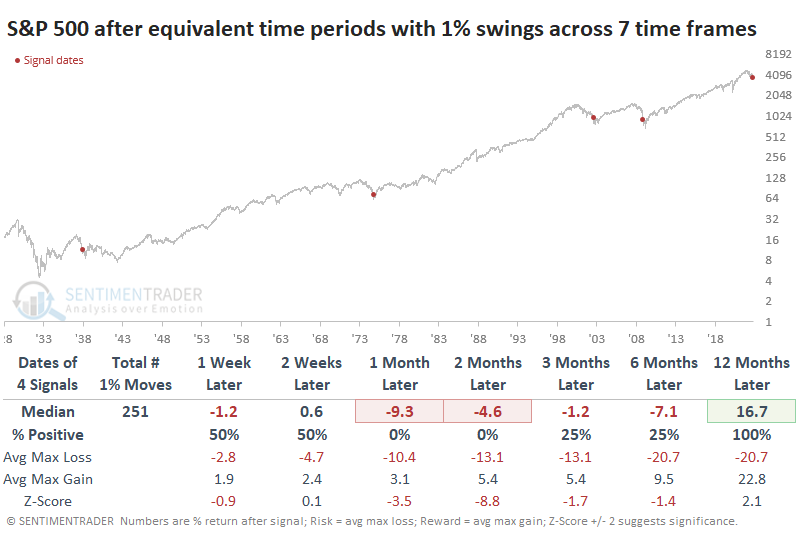
The lack of safe havens is triggering a historical flood of big moves
It's been a most violent couple of weeks.
It hasn't just been the past week or two when investors suffered through gut-wrenching swings. It has persisted for weeks beyond that. And months. Even a year.
Across seven time frames, the S&P 500 has closed more than 1% from its previous close more than any period in the past decade. Through Friday, the S&P 500 had gyrated more than +/-1% on a closing basis 4 times during the past 5 sessions; 8 out of the last 10, and so on. Only four other periods since 1929 have witnessed this many swings across so many time frames.
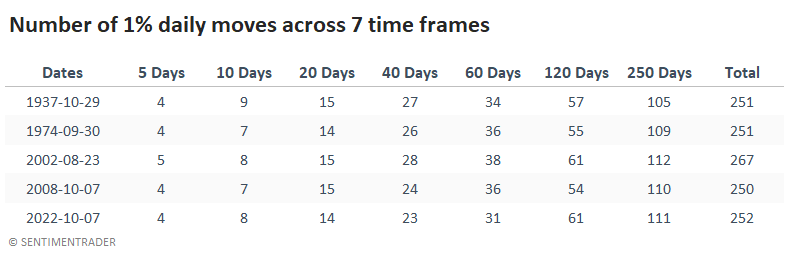
Going forward, the S&P suffered further short- to medium-term losses every time. And each of them also marked major bottoms with gains over the next year; three led to substantial multi-year gains.
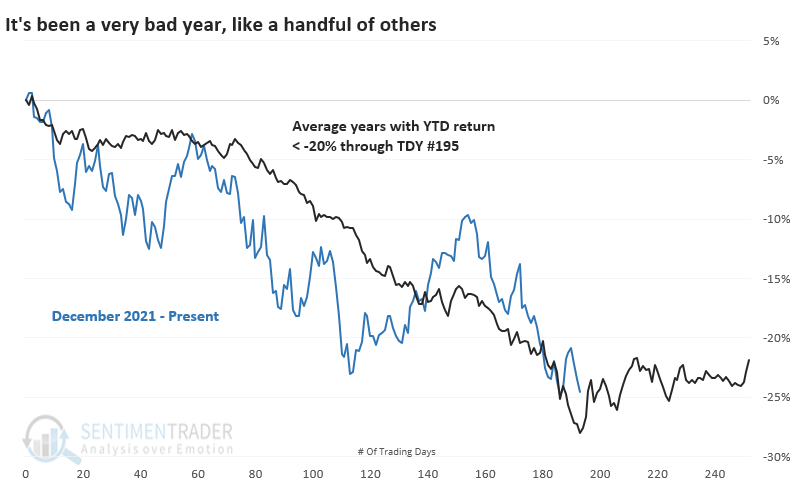
Selling pressure and seasonals combined
There has been no shortage of research posted showing that October has been a volatile but often positive month for stocks. When adding in tendencies like election cycles, there has been a very strong positive bias starting about now.
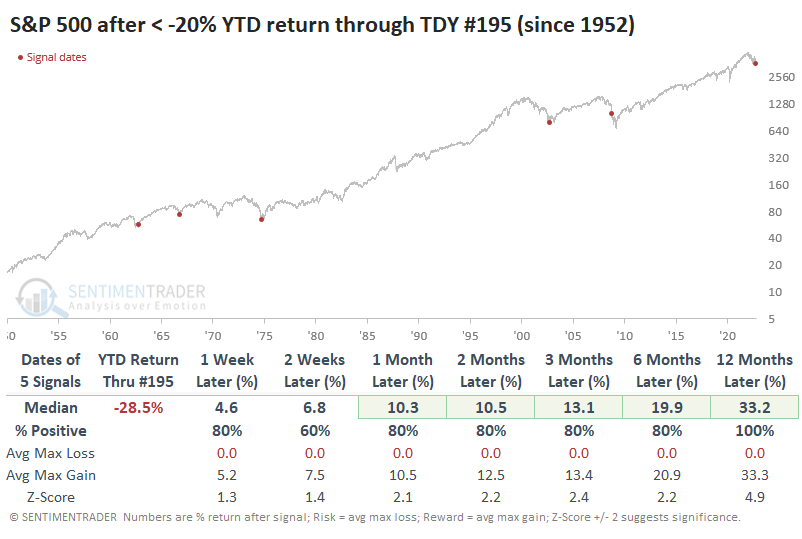
It helps that stocks have already been hammered. Through Trading Day of the Year (TDY) #195, the S&P 500 is still down more than 20% on the year. Since the elimination of Saturday trading, this matches only a handful of other years.
The S&P's returns in the weeks and months ahead were excellent, except for 2008. Remarkably, the maximum closing loss following three signals was 0% - the S&P didn't trade any lower than its close on day #195 for at least the following year. In 1962, the index lost another 6% over the next 11 trading days, then bottomed. In 2008, it took another 103 days.
Ignoring the calendar, the simple fact that sellers have persisted for so long, and pushed prices so low, have tended to indicate periods of exhaustion.
Another sign of being washed out
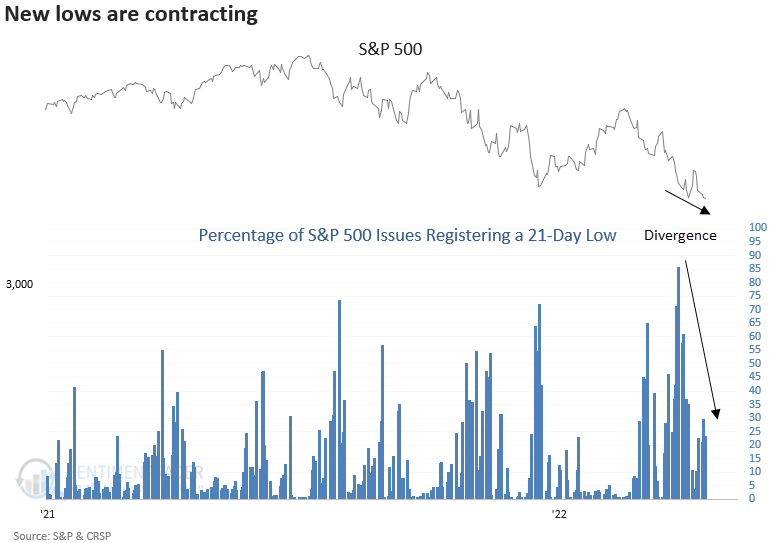
Even though indexes registered new lows, fewer individual stocks did so.
Dean showed that a 21-day new low divergence signal was triggered at the close of trading on Tuesday when the percentage of S&P 500 issues registering a 21-day low contracted on the lower low in the index.
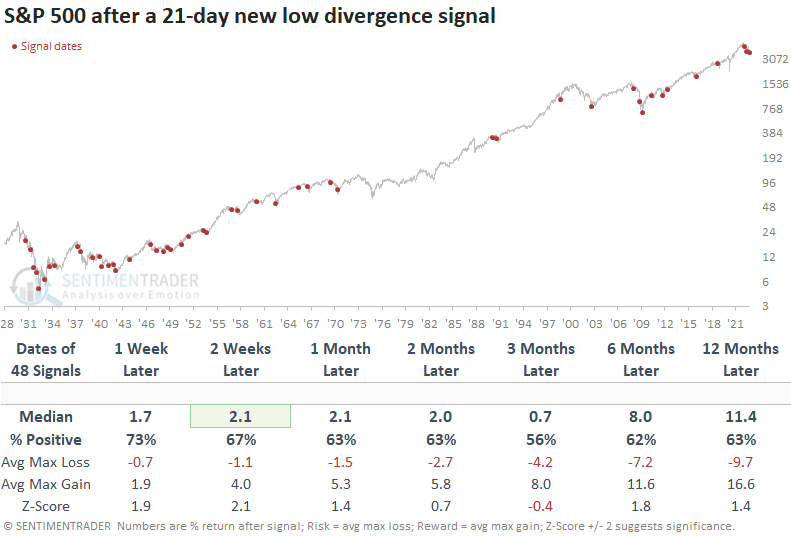
While returns are positive in the first few months, the signal is front-loaded, with the best outlook across short to medium-term time frames coming in the first two weeks. The 3-month window suggests one should expect a choppy bottoming process.
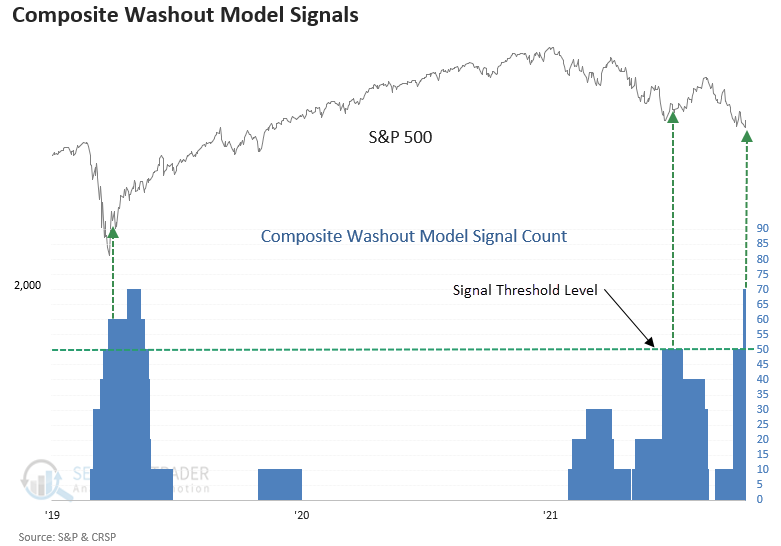
With the new alerts, the Composite Washout Model count increased to 70%, representing the highest level in the current drawdown phase.
For only the 36th time since 1930, the Composite Washout Model triggered a new alert when the 10-day rate of change for the S&P 500 turned positive on Thursday. The previous alert occurred in June, leading to a 13% rally when measured from the publish date to the August peak in the S&P 500.
Dean created the Composite Washout Model to identify potential turning points in drawdown phases. What a trader or investor does with the market message depends on one's investment approach and risk tolerance.
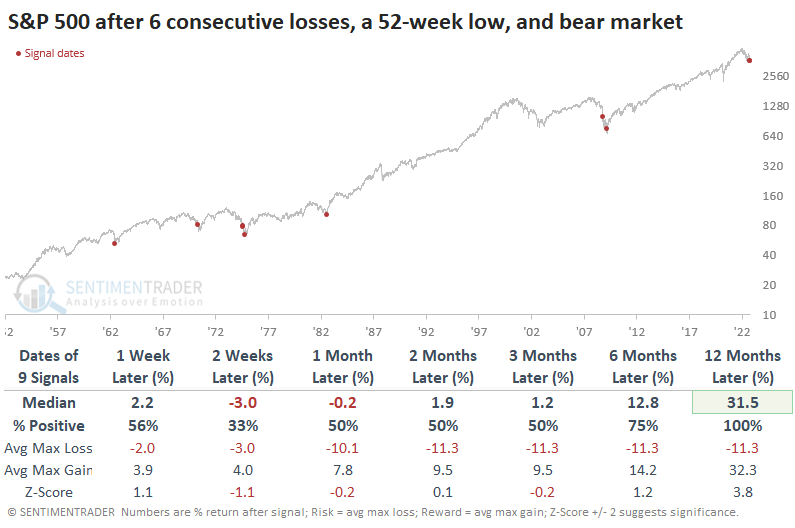
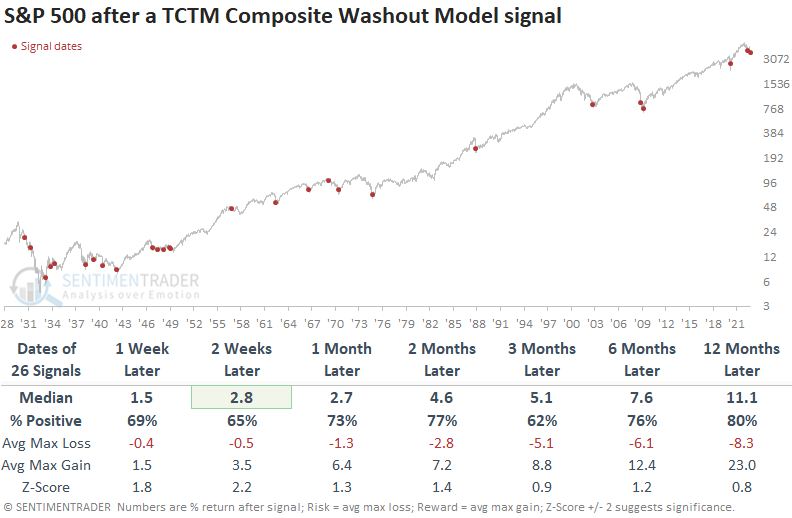
Washout signals show a consistent upward bias in returns across all time frames with solid win rates and z-scores. The alert shows a gain at some point in the first two months in 31 out of 35 instances.
Signals triggered during bear markets show an upward return bias, with solid win rates and z-scores. However, the outlook is slightly less favorable than all signals, which is not surprising given the higher levels of volatility associated with significant market drawdowns. Once again, consistency still looks good, with 23 out of 26 winners at some point in the first two months.
The calendar is turning favorable for tech
Jay showed that the calendar and some indicators have turned favorable for tech stocks.
The chart below displays the cumulative growth of $1 invested in the technology sector only from Trading Day of the Year (TDY) #196 through TDY #83 of the following year since 1942. That favorable period started this week.
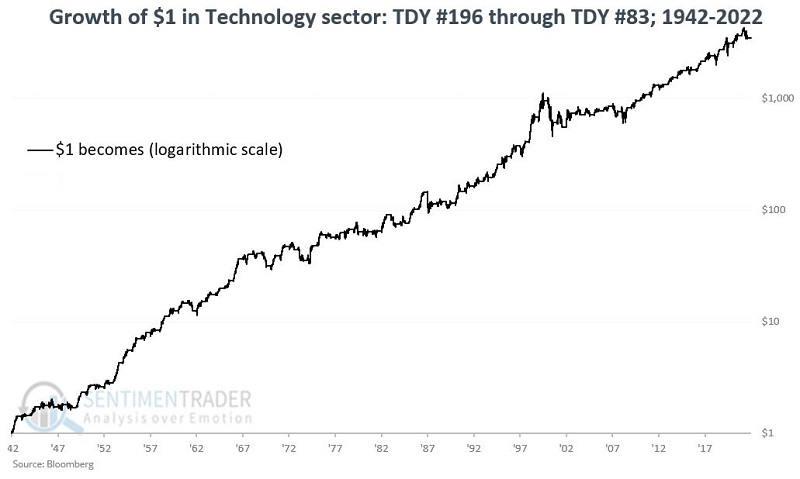
This seasonal period offers no guarantees on a year-by-year basis, but the long-term bias is favorable. It was positive 61 years and negative 19, with much more positive average and maximum gains during the good years than negative returns during the bad ones.
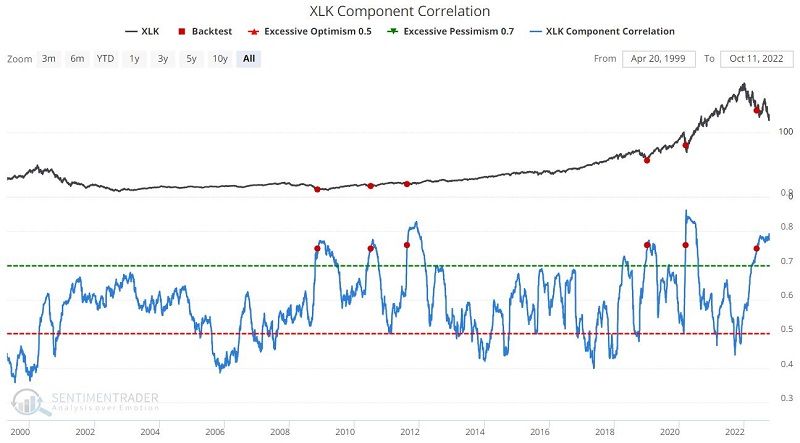
Among indicators, component correlation measures the degree to which the stocks in a given sector or index trend together. High correlation tends to occur near bottoms, as investors indiscriminately dump stocks in that sector.
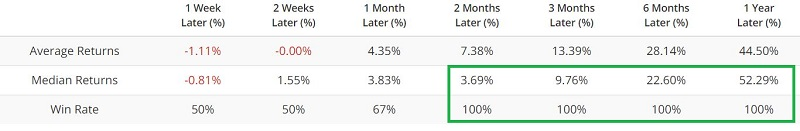
The chart below displays those times when the XLK Component Correlation crossed above 0.75 for the first time in six months, and the table summarizes XLK results following previous signals. The most recent signal occurred on 2022-05-23.
Also recently triggering long-term positive conditions for tech stocks are the percentage of them that traded below their Bollinger Bands, and a broader look at stocks in medium-term uptrends, both of which suggested washed-out conditions.
Financials have been getting a lot of attention...and selling pressure
No two panics are ever exactly alike, but the worry this week was about the financial system. If there are systemic issues, they will probably appear in the Financial sector first.
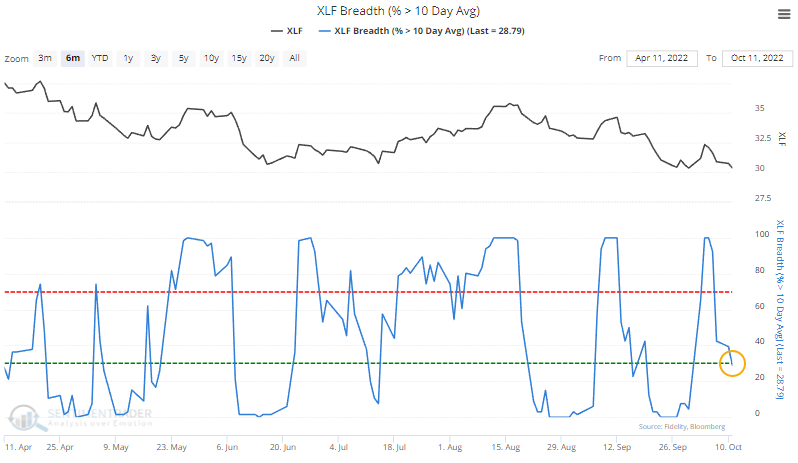
In that sector, stocks are doing what they always do in bear markets. Since February, consistently fewer than 60% of stocks in the sector have held above their 200-day moving averages. The same goes for even medium-term trends. Most of the stocks are again trading below their 50-day averages, but there have been volatile swings over the past few months.
We can see that even more clearly in shorter-term trends. Not even a week ago, every stock in the sector was above its 10-day moving average. Now, fewer than 30% of them are.
Since 1990, there has been a quick about-face in short-term trends only a few times, including two just in the past couple of months. This also happened in 1997, 2011, and 2017, after which the total return in Financials was weak up to a month later, then excellent.
If we take a longer-term look (with less reliable data) before 1990, we can see the recent thrust in short-term trends despite poor medium- and long-term ones preceded mediocre returns for Financials in the short-term. But the sector showed excellent and consistent gains over the next 6-12 months.
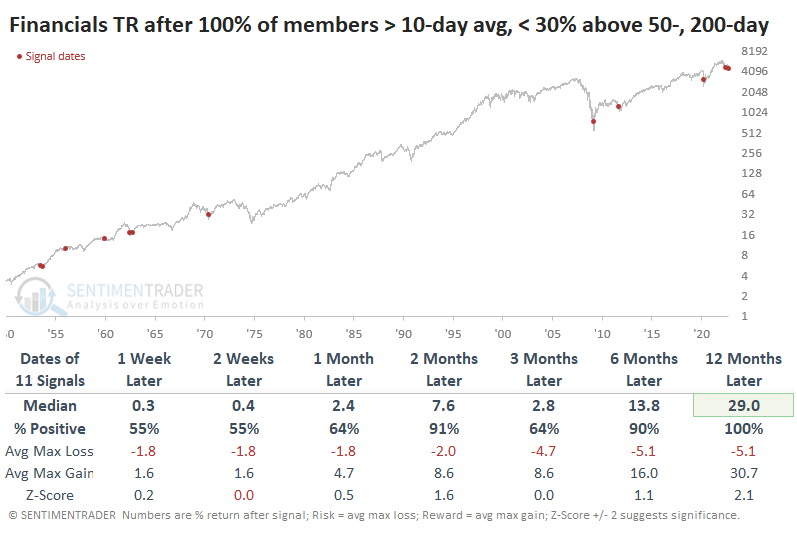
These swings in breadth come after a long drought of positive trends. Over the past 100 days, almost no Financials have managed to close at a 52-week high. On an average day over the past hundred sessions, only 0.38% of stocks in the sector closed at a new high. There have been only three similar droughts in the last couple of decades, all of which preceded long-term positive returns.
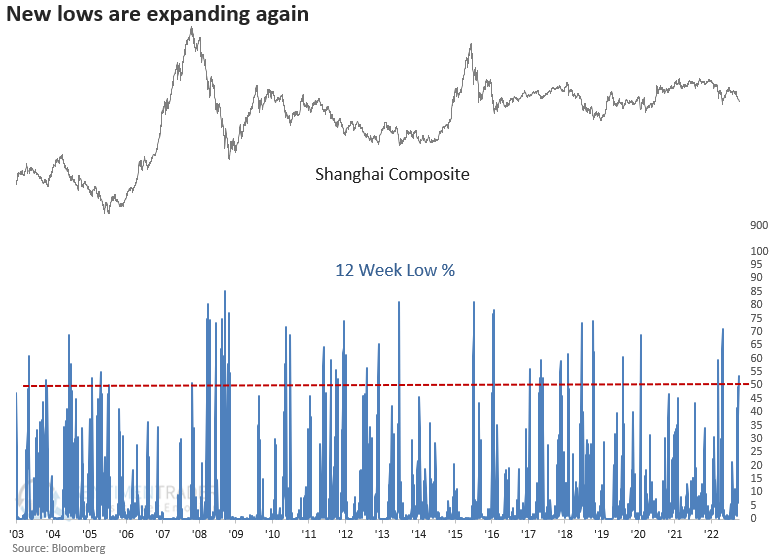
Welcome back, China...and goodbye, gains
Dean noted that after a week-long holiday in China, the sellers returned with a vengeance, which triggered several new multi-month extremes for market breadth indicators for the Shanghai Composite index.
One such indicator is the percentage of Shanghai Composite members registering a 12-week low, which exceeded 50% for the second time in the last few years if we identify the first instance in two months.
The Shanghai Composite index struggled across all time frames after 12-week lows exceeded 50%, especially in the 1 to 3-month windows. The expansion in new lows typically occurs within the context of a multi-year downtrend versus a correction within an uptrend.
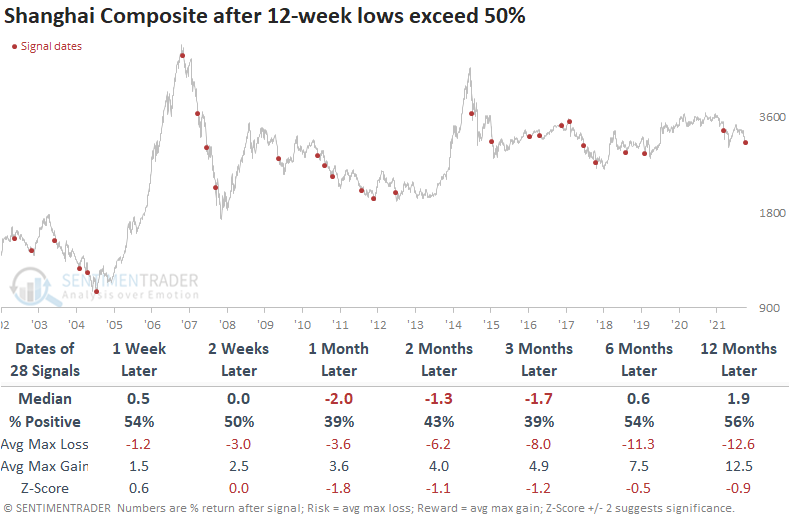
For only the 7th time in three decades, the 200-day average for the Shanghai Composite index has declined for 144 sessions. With the index significantly below its average and the deteriorating market breadth backdrop, the downtrend likely remains in place for the foreseeable future. When this happened in the past, in every case, returns were negative at some point in the first few months.
An out-of-the-way metal with potential
Jay showed that an often-overlooked metal, palladium, whose price movements are highly cyclical.
The chart below displays the annual seasonal trend for palladium futures. It is possible to break the seasonal calendar year into two periods based on the Trading Day of the Year (TDY):
- The favorable period runs from Trading TDY #197 through TDY #47
- The unfavorable period runs from TDY #47 through TDY #197
The chart below displays the hypothetical dollar return from holding a long position in palladium, depending on the time of year.
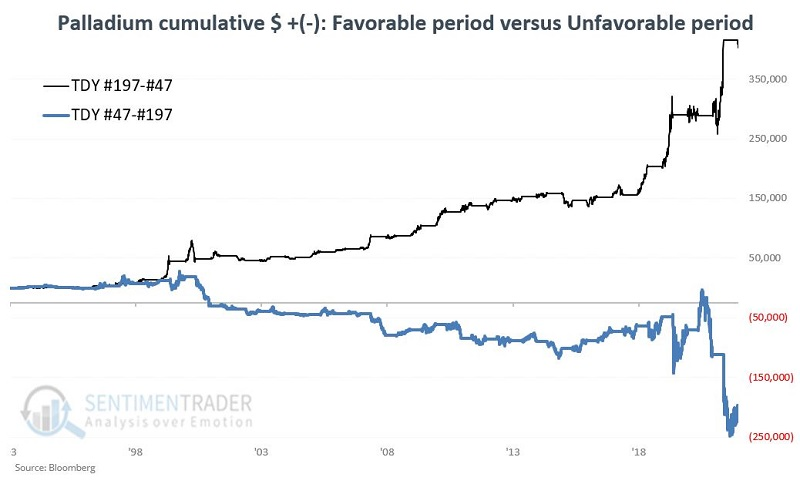
During the favorable periods, palladium rose 83% of the time. During those up years, palladium's returns far exceeded the relatively minor losses during the down years.
The abrdn Physical Palladium Shares ETF (PALL) holds physical palladium. The good news is that PALL offers a way to trade palladium without trading futures contracts. The bad news is that trading is relatively thin, with roughly only 20,000 shares changing hands daily. Luckily, the seasonal approach suggested above only requires two trades per year.
Promising signs for silver and gold
Volatility across markets has been ratcheting higher. Jay noted that's the case even within some markets, like precious metals.
Recently, the price of copper plunged relative to gold. Despite not being part of the calculation, extremes in this ratio have been consistent signals for silver. The chart below displays those dates when the Copper/Gold Ratio crossed below 0.19 for the first time in a year.
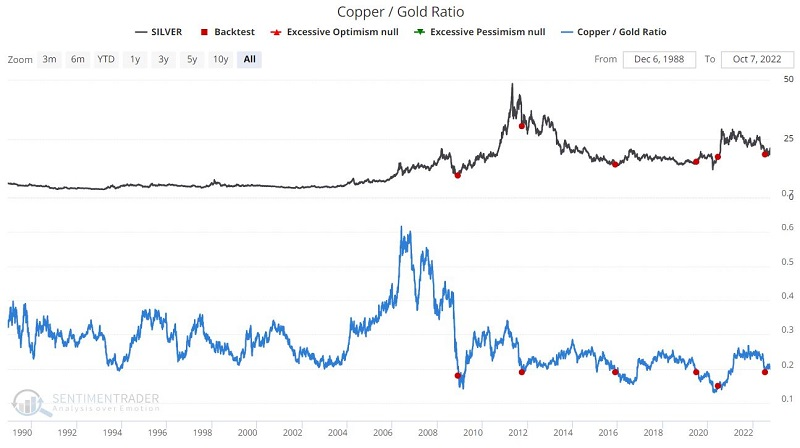
Previous signals have seen silver turn up immediately and, in some cases, rocket higher. The caveat here is the small sample size.
Another compelling indicator is the Gold Optimism Index (Optix) where the 20-day average dropped below 30%. While it's a gold indicator, silver has reacted well to its extremes.
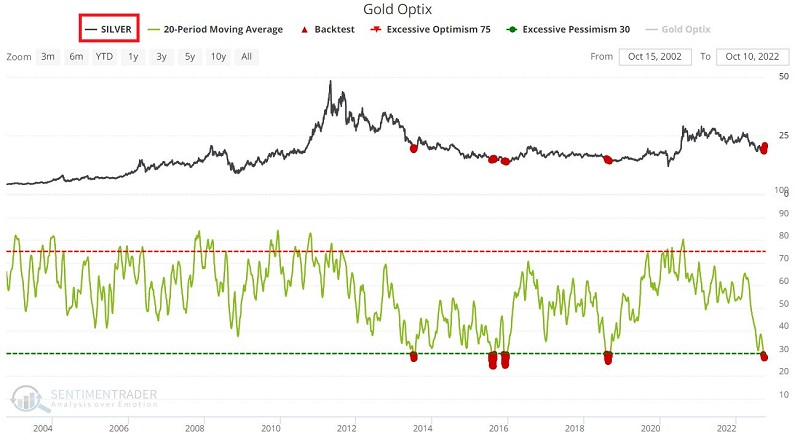
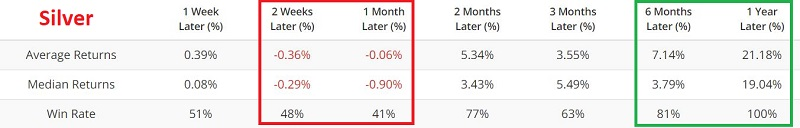
Historically, the performance of silver during the first month after a signal has been relatively weak but powerful in the ensuing eleven months. Also, for one of the few times in history, smart money commercial hedgers recently went net long silver futures.
One caveat is that for silver, we are still in an unfavorable period. That does not mean that silver cannot rally soon. It simply means that the odds do not favor an advance in the near term. The seasonal environment turns much more favorable after the 1st of next year.
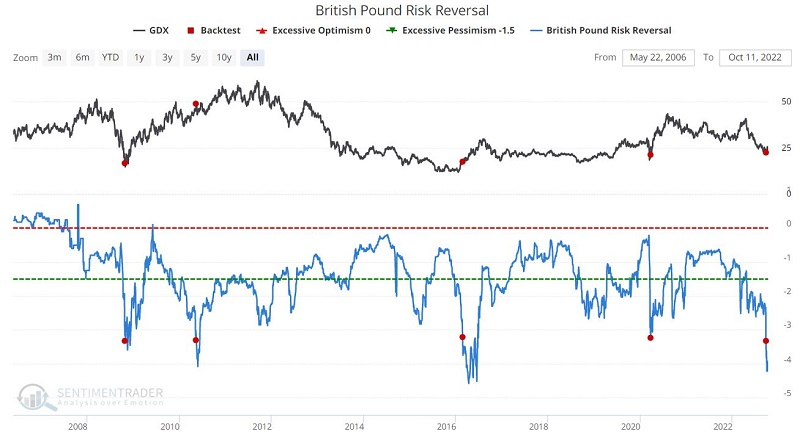
A positive for gold (specifically gold stocks) that Jay highlighted is that the British Pound risk reversal has reached an extreme.
The price of a risk reversal shows how much more expensive put options are relative to call options. The more negative the risk reversal, the more traders are paying up for protection, a sign of pessimism or outright panic.
The chart below displays those rare occasions when the British Pound risk reversal crossed below -3.2 for the first time in six months. The most recent signal occurred on September 23. The table below displays performance results for VanEck Gold Miners ETF (ticker GDX) following previous signals. The good news is that the results are somewhat eye-popping. The bad news is that the sample size is tiny because extreme signals are rare by definition.
About TradingEdge Weekly...
The goal of TradingEdge Weekly is to summarize some of the research published to SentimenTrader over the past week. Sometimes there is a lot to digest and this summary is meant to highlight the highest conviction or most compelling ideas we discussed. This is NOT the full research that's published, rather it pulls out some of the most relevant parts. It includes links to the published research for convenience; if you don't subscribe to those products it will present the options for access.