Products
SentimenTrader Trading Tools
‍
Backtest Engine
My Trading Toolkit
Correlation Analysis
Seasonality
Market Prediction
Indicators & Data API
‍
Proprietary Indicators & Charts
Market Data API
Strategies & Scanner
‍
50+ Trading Strategies
Smart Stock Scanner
Smart Option Scanner
Research Reports
‍
Research Solutions
Reports Library
Free Resources
Simple Backtest Calculator
Simple Seasonality Calculator
The Kelly Criterion Calculator
Sentiment Geo Map
Public Research Reports
Education
Sentiment Indicators
Technical Indicators
Pricing
Company
About
In the News
Testimonials
Client Success Stories
Contact
Log inLoginSign up
< BACK TO ALL REPORTS

TradingEdge Weekly for November 13, 2026 - Nasdaq Correction Odds, Energy Seasonality, Liquidity Warning, Bitcoin Trend Exit, QQQ Bounce Record, NDX Sentiment Signals

by Sentimentrader
2026-11-13
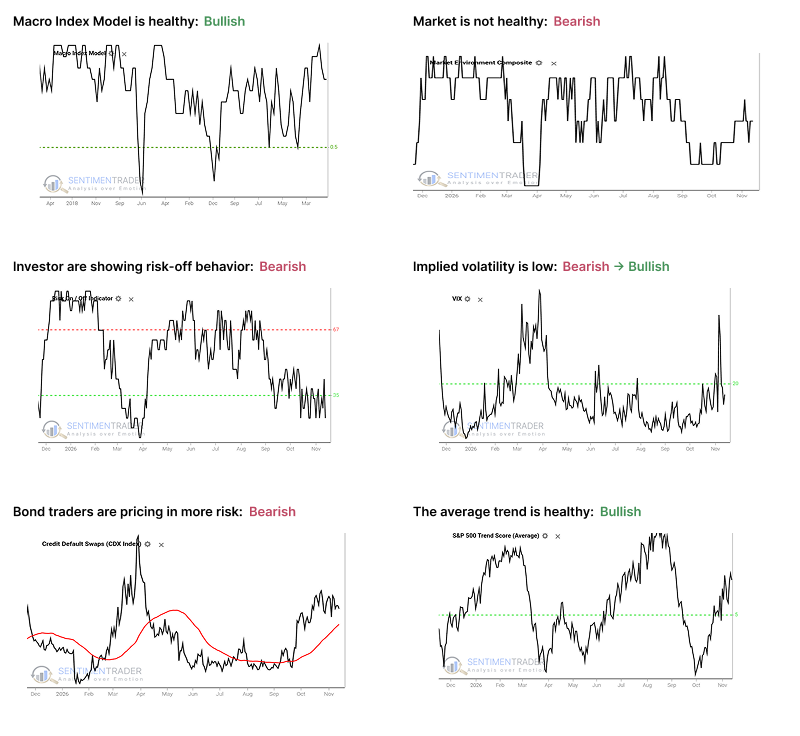
A hotter-than-expected October CPI and AI regulatory fears have plunged the Nasdaq into an official correction. While Bitcoin and mega-cap tech face severe near-term momentum breakdowns, historical seasonal setups in Energy offer long-term hope.

For a visual breakdown of this report, please click here to watch the companion video. 

Key points:

  • An initial 10% pullback from a 1-year high (77 occurrences in 50+ years) has win rates barely above a coin toss in the first weeks; 11 of 18 fast corrections kept falling for two weeks, and Nasdaq Optix below 5 shows a 44% two-week win rate
  • After XLE's 33% rally and 13% one-week plunge, breadth at 0% within an uptrend (Nov 5-6 signals) plus seasonality favorable from December 18 (TDY #243) through TDY #110 of 2027 - a 79% win rate with median win +13.5% vs median loss -6.2% - argue for watching for a buy point
  • The SPY Liquidity Premium's 84-day range rank went from 0 to 100 in just five sessions; after shifts completed inside 21 sessions, the S&P 500 was higher two weeks later only 30% of the time (average -1.8%) and -3.1% after three weeks
  • Industry % Indexes in Bear Market crossings below 10% show 3-12 month win rates in excess of 90%, and Risk On/Risk Off below 30 shows a 94% one-year win rate with a 17.43% median return - favorable for the next 12 months, but not automatic buy triggers
  • Hot October CPI (0.4% vs 0.3% expected) pushed Bitcoin below $74,000; the RSI model exited on Nov 10, RSI<35 signals carry a 43% two-week win rate with a -1.8% median return, and 63-day lows precede further declines 61% of the time over the next month
  • <
Forgot your password?
PRODUCTS
SentimenTrader
Trading Tools
Indicators & Data API
‍
Strategies & Scanner
‍
Research Reports
FREE
RESOUrCES
Simple Backtest
Calculator
Simple Seasonality
Calculator
The Kelly Criterion
Calculator
Sentiment Geo Map
‍
Public Research Reports
‍
Education
Sentiment Indicators
‍
Technical Indicators
‍
Pricing
Bundle pricing
‍
FAQ
‍
Announcements
‍
COMPANY
‍
About
‍
In the News
‍
Testimonials
‍
Client Success Stories
CONTACT
‍
General Inquiries
‍
Media Inquiries
‍
Financial Professionals Inquiries
‍
© 2026 Sundial Capital Research Inc. All rights reserved.
Setsail Marketing
TermsPrivacyAffiliate Program
Risk Disclosure: The information and tools provided are for research and analytical purposes only and are not intended as investment advice. Market analysis involves uncertainty, and outcomes may differ from expectations. Users should conduct their own due diligence and consider their individual circumstances before making any financial decisions. Past performance is not necessarily indicative of future results.

Hypothetical Performance Disclosure: Hypothetical performance results have many inherent limitations, some of which are described below. No representation is being made that any account will or is likely to achieve profits or losses similar to those shown; in fact, there are frequently sharp differences between hypothetical performance results and the actual results subsequently achieved by any particular trading program. One of the limitations of hypothetical performance results is that they are generally prepared with the benefit of hindsight. In addition, hypothetical trading does not involve financial risk, and no hypothetical trading record can completely account for the impact of financial risk of actual trading. for example, the ability to withstand losses or to adhere to a particular trading program in spite of trading losses are material points which can also adversely affect actual trading results. There are numerous other factors related to the markets in general or to the implementation of any specific trading program which cannot be fully accounted for in the preparation of hypothetical performance results and all which can adversely affect trading results.

Testimonial Disclosure: Testimonials appearing on this website may not be representative of other clients or customers and is not a guarantee of future performance or success.