
TradingEdge Weekly for Nov 8 - Low-vol momentum, defensive lows, post-election factors

Key points:
- The S&P 500 and Nasdaq 100 have enjoyed a historic ratio of 1-year returns relative to their volatility
- Defensive sectors have been dominating the new-low list
- Cyclical indexes are hitting new highs
- Consumers seem to be highly optimistic about both stocks and bonds, an unusual setup
- The VIX's post-election crush was massive
- Taking a look at sector and factor returns 3 and 6 months following elections
- Creating a system for trading small-caps, the value, in the months following an election
- Why a down October may not be a bad thing
Big gains, low volatility
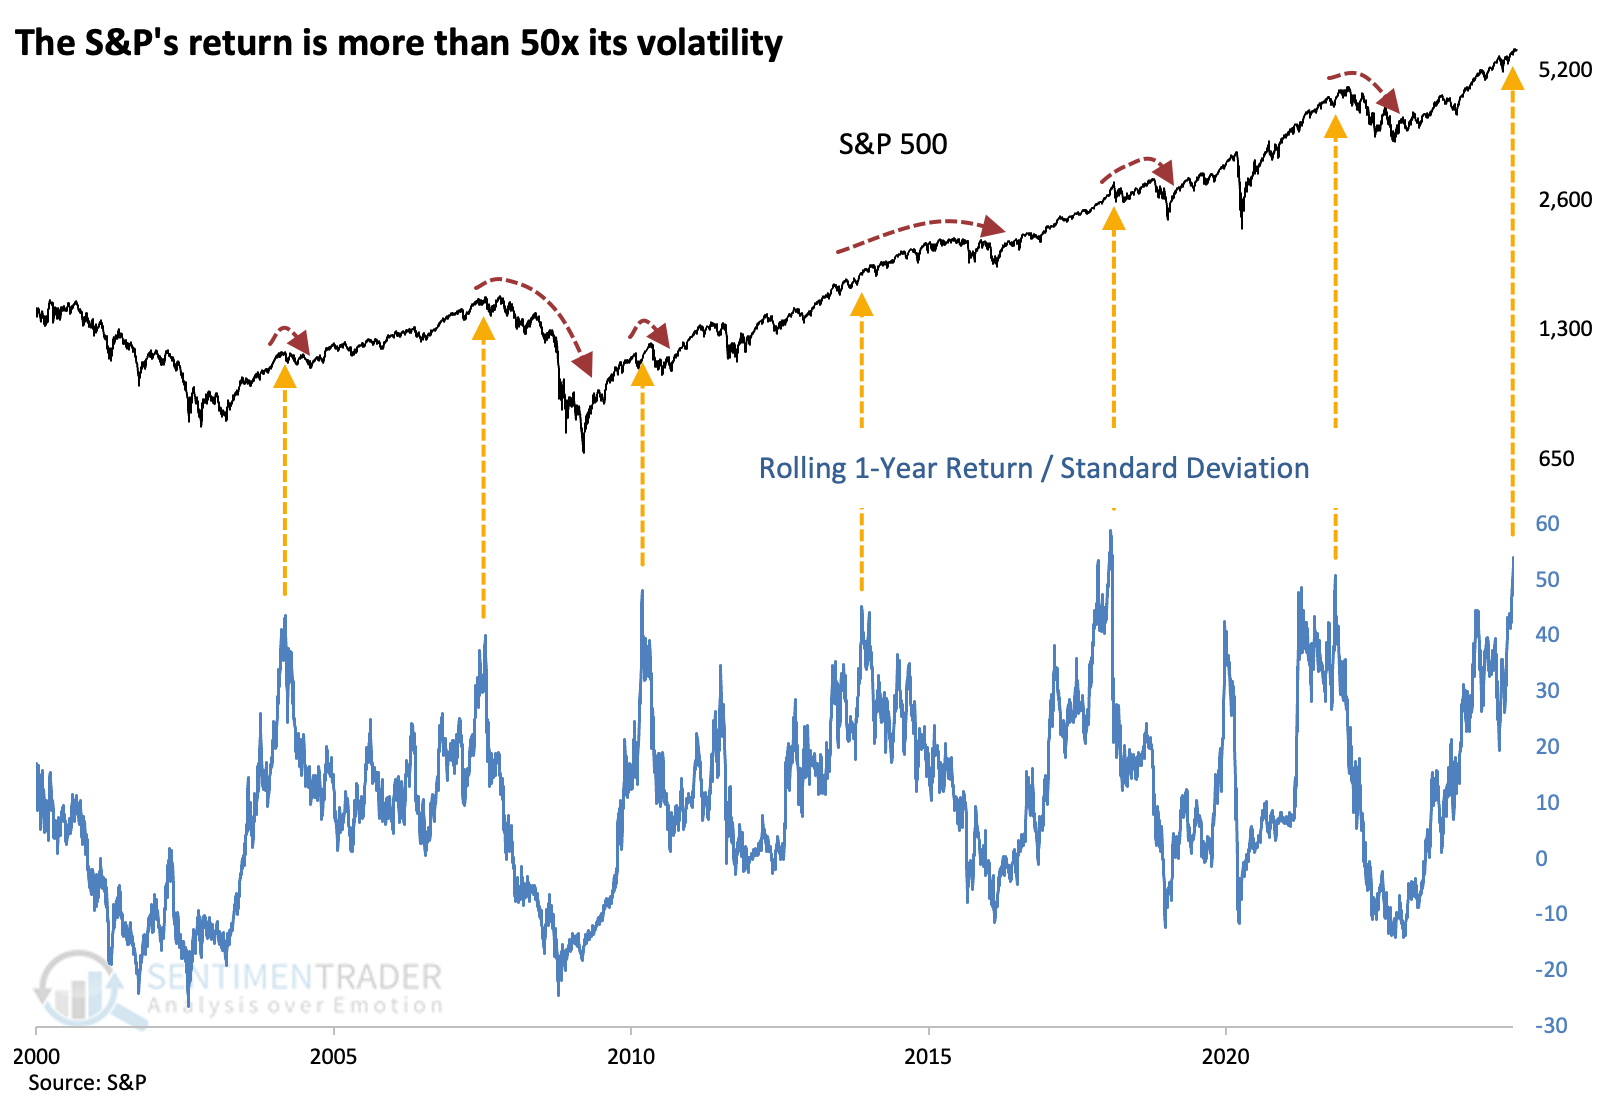
It's been a banner year for equity investors - historic, among the best ever - and maybe that's a problem. The S&P 500's rolling one-year return and the standard deviation of a log of its daily percentage return are at opposite ends of the spectrum - returns are soaring, and volatility is stagnant.
The S&P 500's rolling one-year return just exceeded 50x the standard deviation of daily returns, the 2nd-highest in 25 years. Unfortunately, the pleasant conditions haven't persisted for much longer over that span. For everything there is a season.
Going back further and looking at the most extreme cases, we see the S&P's returns after its rolling one-year returns first exceeded 50x its standard deviation. The signals were mostly great before the 1970s, mostly terrible during that decade (roughly), and mixed since then, especially over medium-term time frames.
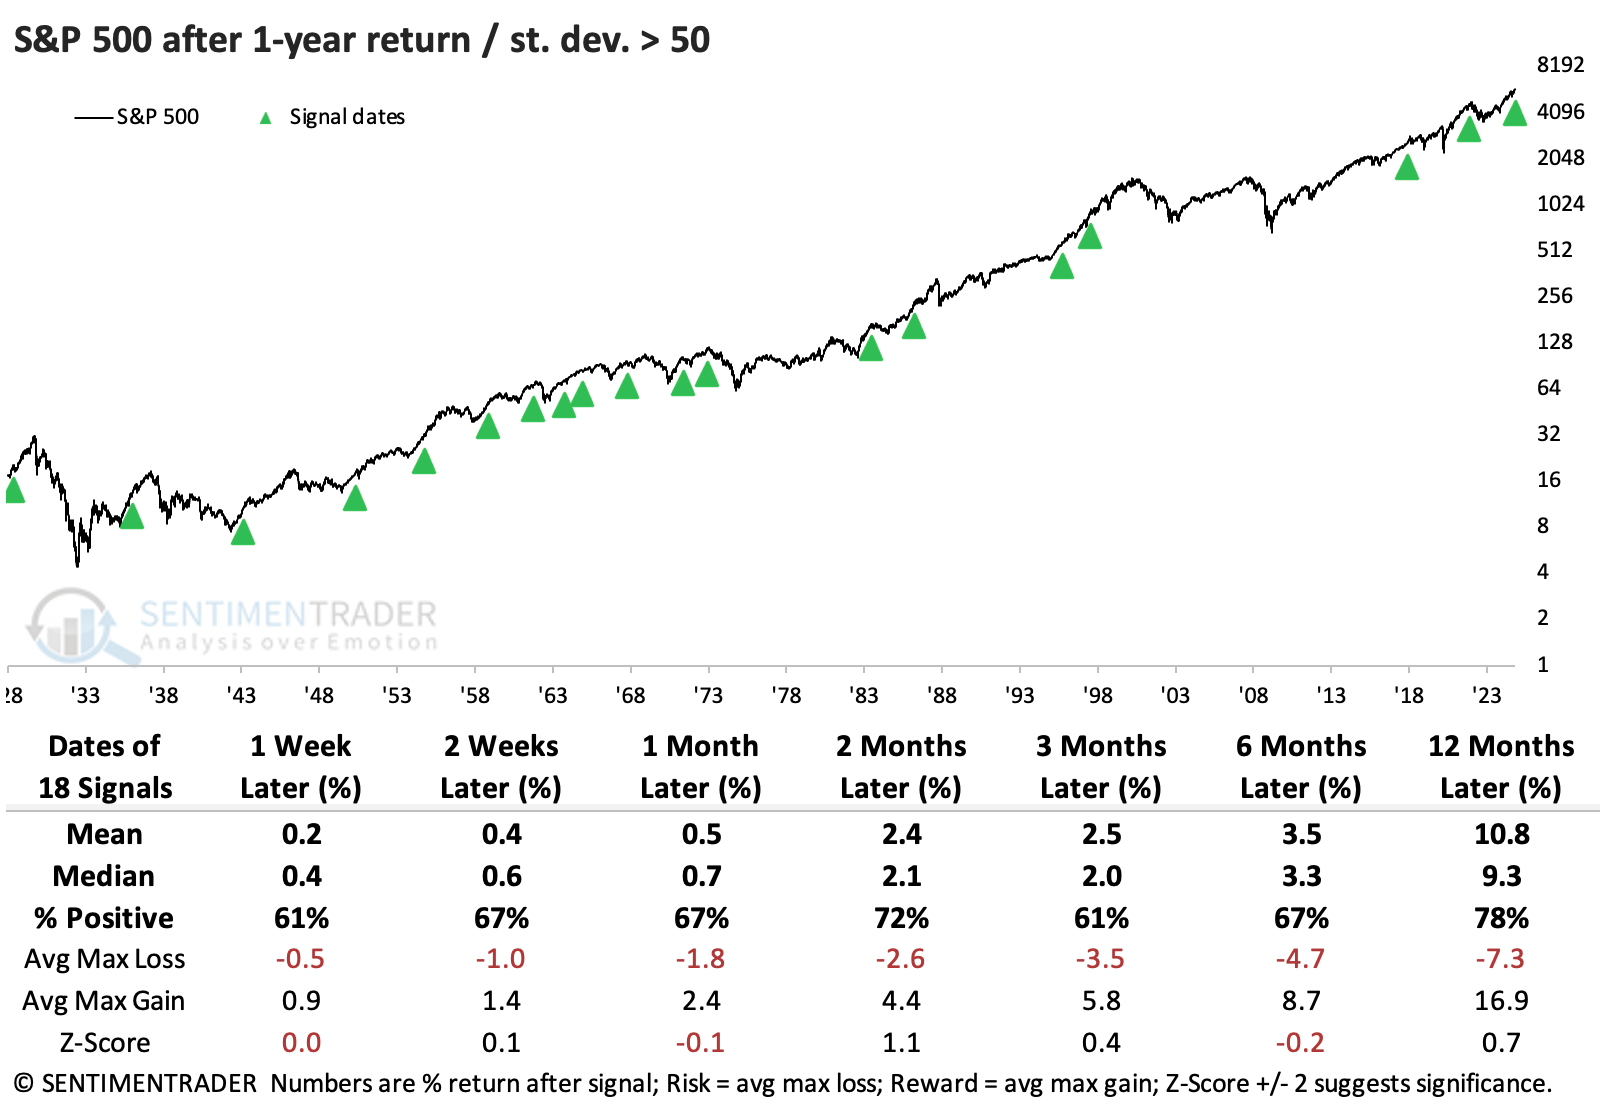
The table of maximum gains and losses across time frames shows that the skew was mostly toward moderate gains versus losses (+/- 5%) and more heavily skewed toward significant gains (+/- 10%). But most of those were in earlier decades, with the skew much more balanced since the 1960s.
The Nasdaq 100 is generally more volatile, so while its returns have been impressive, investors have suffered more volatility in the process. Even so, its ratio is back above 40x, high enough to be considered historically extreme.
These extremes tended to be more of a positive sign for tech. Over the next 1-2 months, the Nasdaq 100 (NDX) rose 80% of the time. Over the past 30 years, the NDX declined over the next month only once.
Defensive lows
Defensive and commodity-oriented sectors, not cyclical groups, are driving the expansion in 4-week lows. Dean showed that similar market breadth conditions suggest the backdrop for the broad market remains constructive.
With defensive groups like staples and utilities showing over 30% of their stocks hitting a 4-week low, while cyclical sectors such as financials and industrials have fewer than 15% of stocks at similar lows, he wondered when we've seen this pattern before and what it might indicate for the broader market.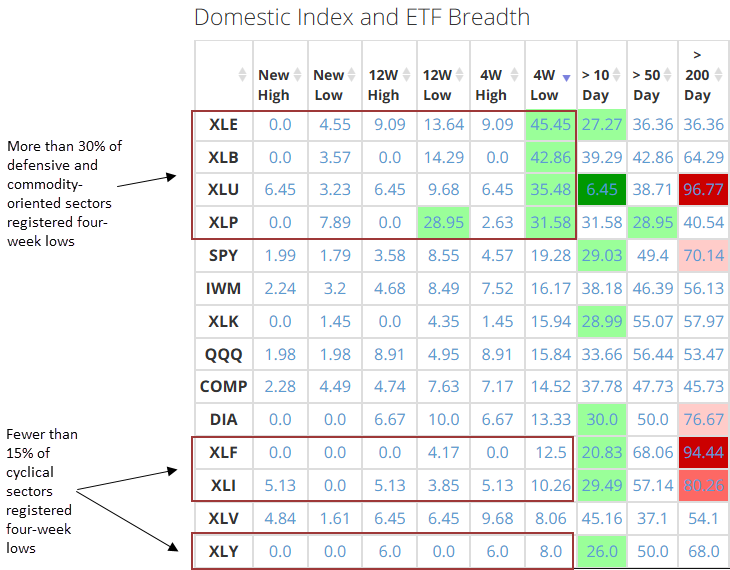
Although the sample size is limited, each time the percentage of 4-week lows for staples and utilities exceeded 30%, while financials and industrials stayed under 15% and the S&P 500 was near a multi-year year high, the world's most benchmarked index produced a gain 100% of the time over the next three and six months.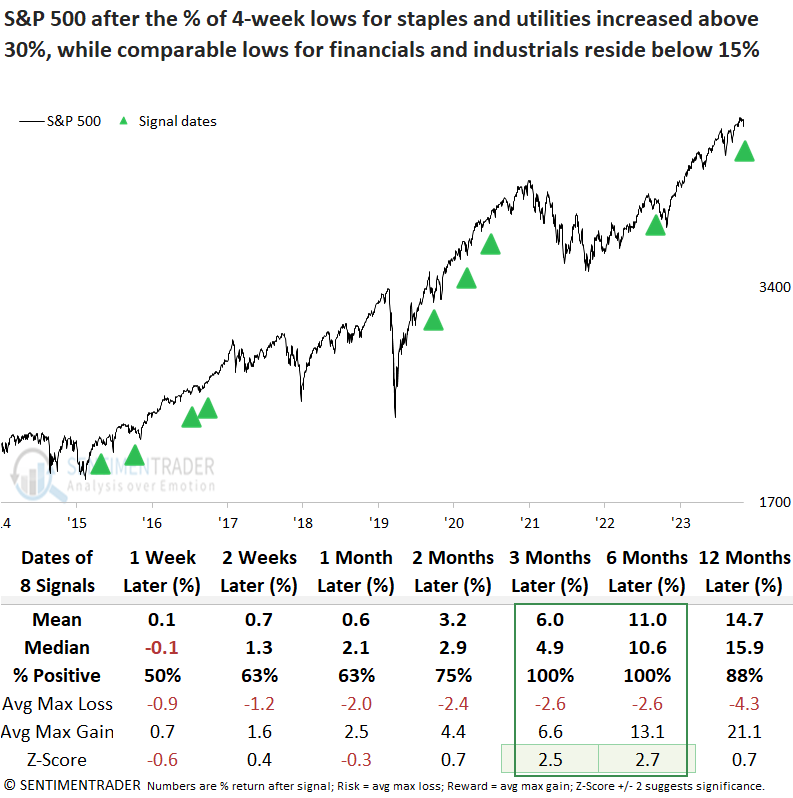
If we increase the threshold for 4-week lows for the cyclical sectors from 15% to 20% to increase the sample size. In that case, the number of instances increased from eight to eighteen. Under this scenario, the S&P 500 still demonstrated strong returns and consistency, particularly over the next six months.
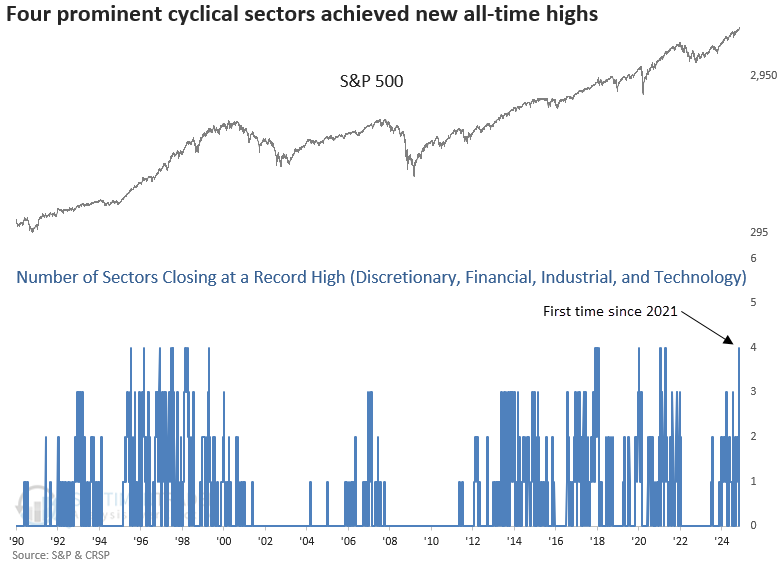
Cyclical highs
The discretionary, financial, industrial, and technology sectors closed at record highs within the last week. Dean showed that similar cyclical sector breakouts produced an 86% win rate for the S&P 500 a year later.
This synchronized advance among cyclical sectors signals a bullish alignment between indexes (external price trends) and individual stocks (internal price trends).
Dean applied two resets to filter out repeats: the first reset required the sector count to drop to zero, and the second identified the first signal in two months.
Whenever the discretionary, financial, industrial, and technology sectors recorded all-time highs within one week of each other, the S&P 500 rallied 86% of the time over the subsequent year, with no losses since 1987.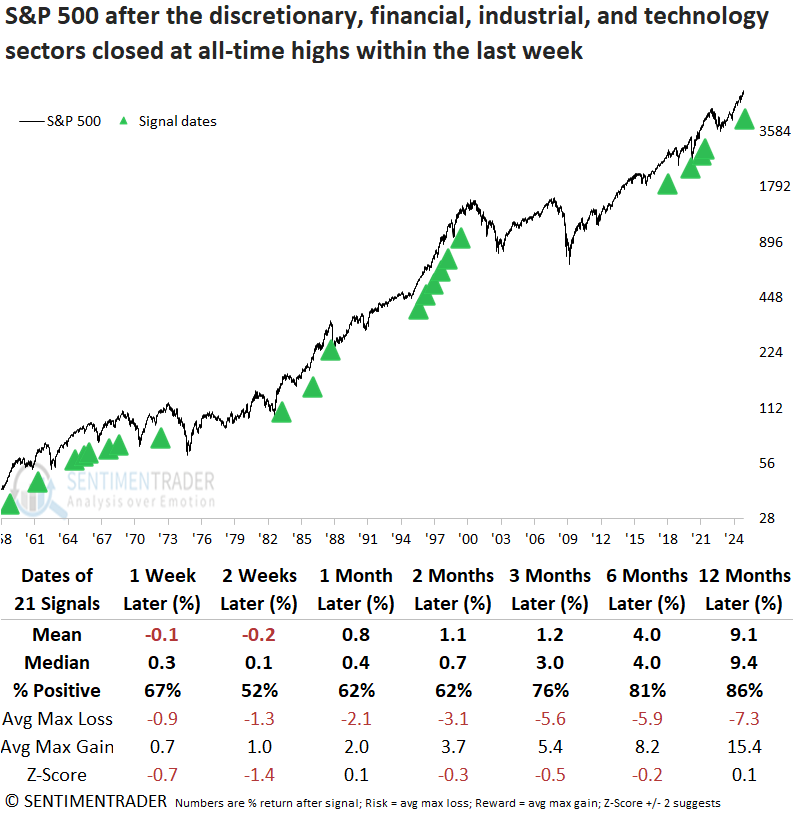
Over the following six months, the S&P 500 experienced just two maximum losses exceeding 10%, each tied to extraordinary events, including the 1987 crash and the Covid outbreak.
Growth-oriented sectors surpassed the S&P 500, with consumer discretionary and technology sectors demonstrating the most consistent outperformance from two to twelve months later.
Is everyone optimistic about everything?
Instead of hot takes about the election, it might be helpful to consider the idea that everyone is bullish. Stocks, bonds, it doesn't matter - everyone's in the pool.
According to the Conference Board, there have rarely been times when so many consumers/investors were so optimistic about the future of stock and bond prices simultaneously.
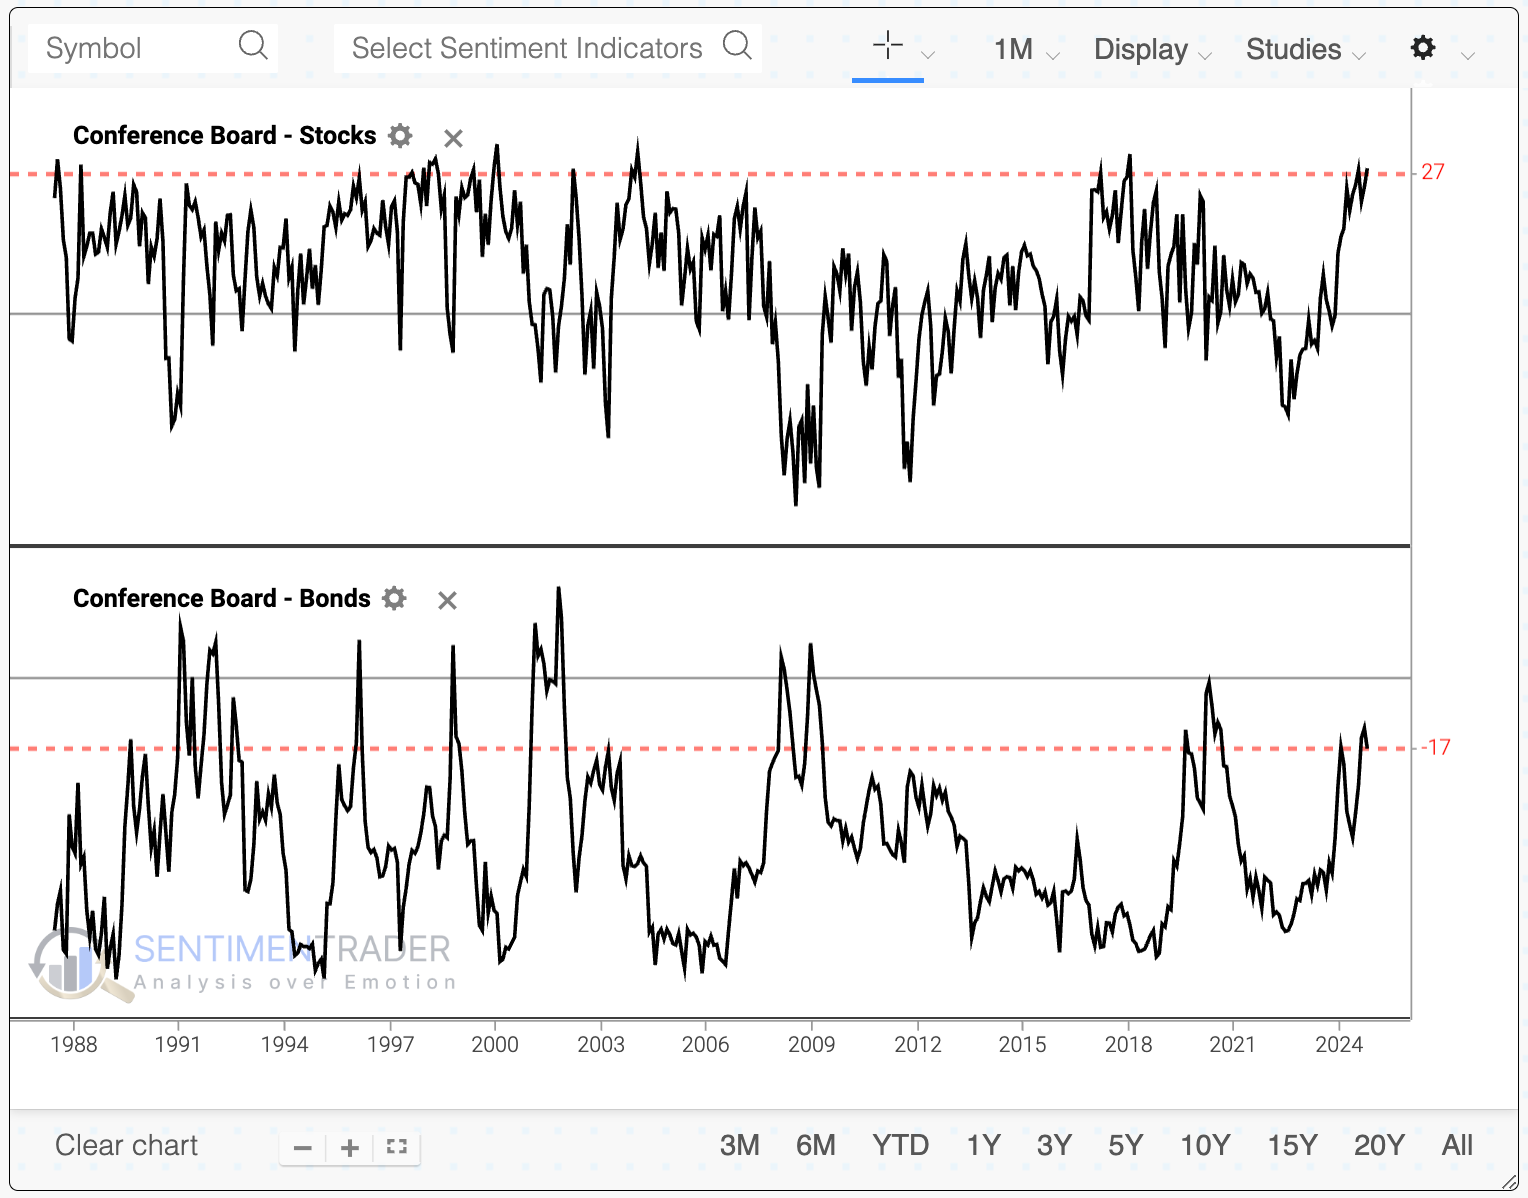
There is a distinct inverse correlation between optimism in the two asset classes. A scatter plot below shows how much of an outlier the current reading is relative to the 448 other months since the surveys' inception.
The combined net percentage of consumers expecting rising stock prices and rising bond prices (declining yields) is the highest since 2001. Only a few times has the combined net optimism for stocks and bonds reached the current level. The 2001 instance was immediately and persistently bad for the S&P 500, but the other two instances preceded impressive, sustained advances.
The minuscule sample size means we have to relax the parameters to generate more signals and perhaps gain some confidence in any conclusion. Even when we do that and look at lesser extremes, it is still a pretty good sign for stocks.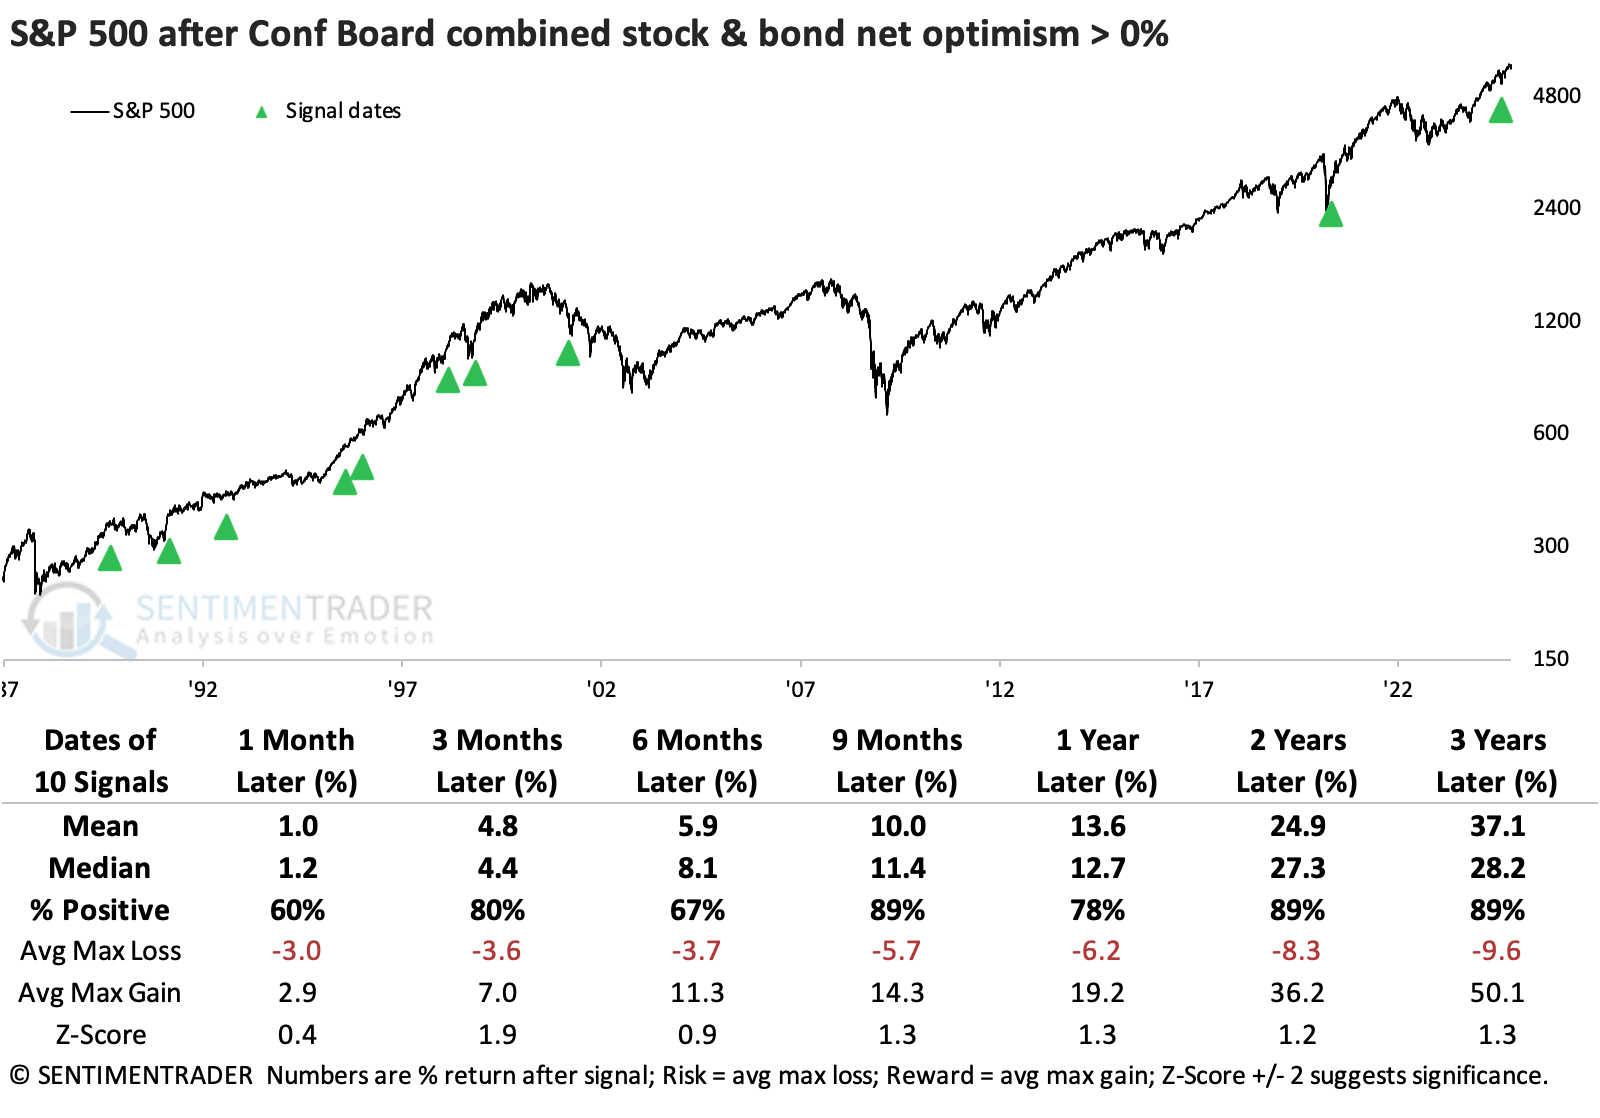
That was not the case for bonds, as 10-year Treasury note futures declined after nine of the ten signals either one or two years later. The optimistic conditions generally preceded good economic conditions, resulting in higher interest rates.
The broadly optimistic conditions favored more cyclical stocks among sectors. Even with the post-2000 bubble plunge, technology stocks exhibited the best two-year returns. Discretionary, financial, and industrial stocks were more consistently strong across time frames.
Vol purge
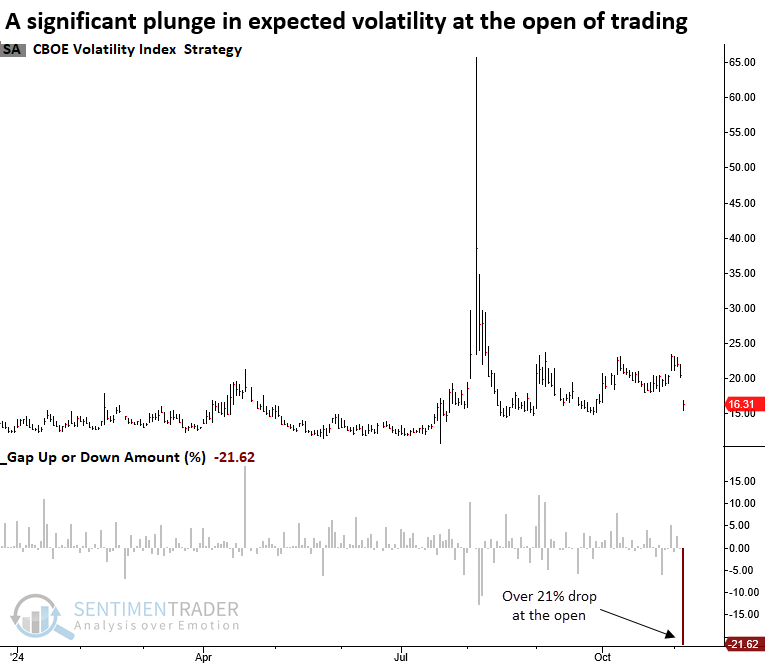
The Volatility Index (VIX) plunged by more than 21% to open Wednesday's trading session. Dean noted that similar contractions in the fear gauge saw the S&P 500 rally 86% of the time over the next three months.
Following the election's conclusion, the VIX adhered swiftly to its seasonal pattern, dropping over 21% as markets opened on Wednesday-a magnitude of decline seen only four other times since 1992, when intraday data became available.
Whenever the Volatility Index (VIX) opened down 15% or more from the previous day's close, the S&P 500 showed a solid tendency to rally, advancing 86% of the time over the subsequent three and six months.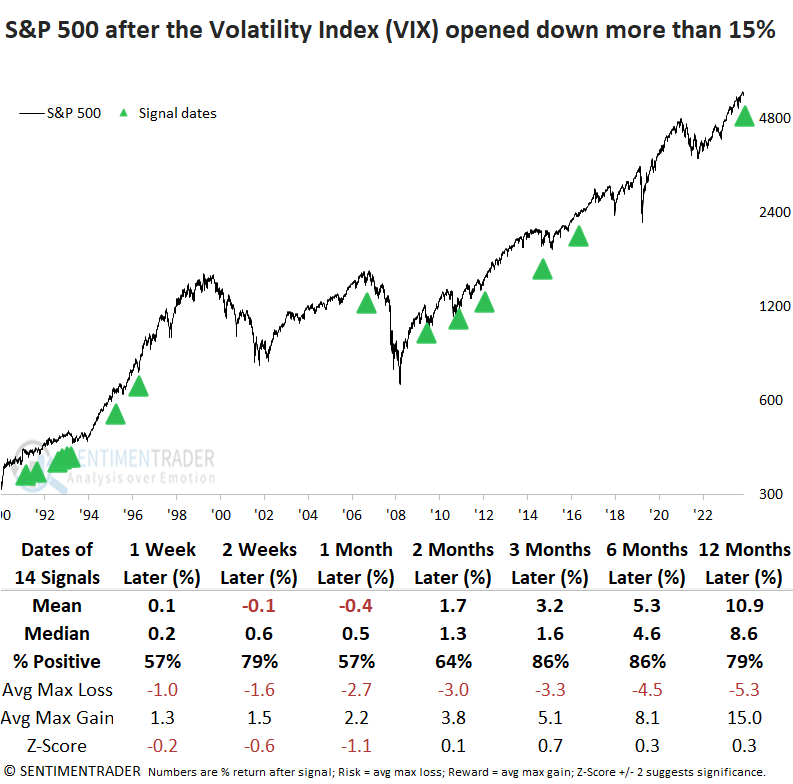
In addition, the S&P 500 ETF (SPY) increased by over 2% at the open on Wednesday to a new intraday all-time high. There has been only one other instance since 1993, occurring in November 2020, four days after the previous presidential election.
If we adjust the gap-up amount from 2% to 1%, it resulted in 14 instances. Although the S&P 500 struggled over the next two weeks, potentially indicating buyer fatigue, it achieved gains without exception over the subsequent six months.
Three months after an election
Jay thought it may be helpful to look at some history of post-election performance for various sectors and factors.
We start our test with 1944, the first election year in the post-WWII era. We will measure returns for various sectors and factors during the first sixty-three trading days (roughly three months.
The table below summarizes each sector's performance during this post-election period. The top performer for each Measure is highlighted in green.
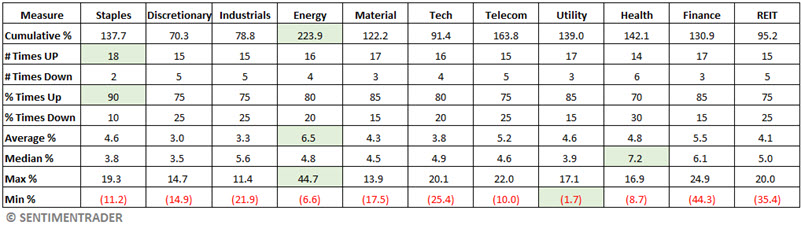
Energy and Telecom had the highest cumulative returns; however, Health Care and Finance had the highest median returns. Also, despite never being the top performer for any single post-election three-month period, Staples had the highest Win Rate (90%). Materials, Utilities, and Finance had Win Rates of 85%.
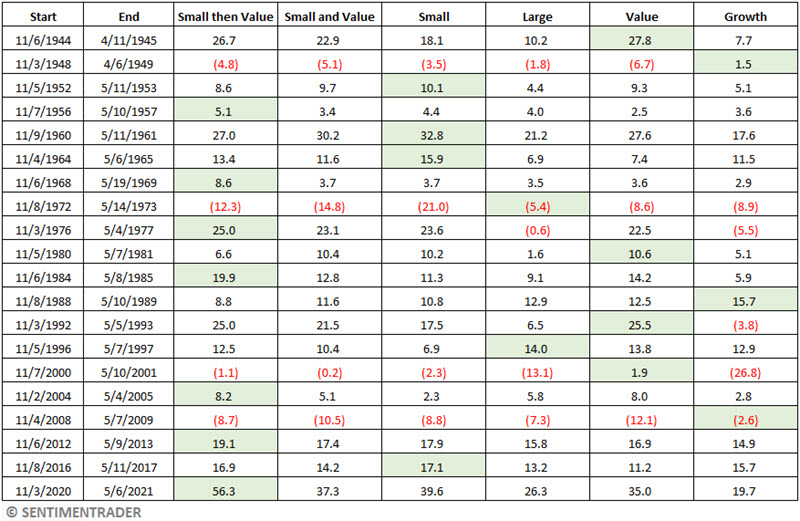
Jay also looked at broader factors and found that small-caps were the leading factor eight times, and all of the last three. Value outperformed growth in 14 of 20 periods and was the top performer among all four factors seven times.
The table below summarizes factor performance.
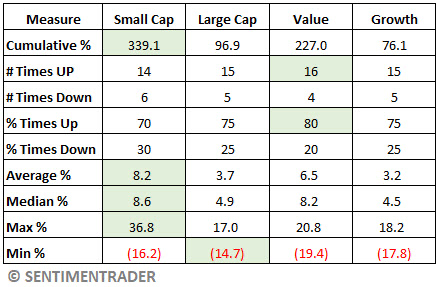
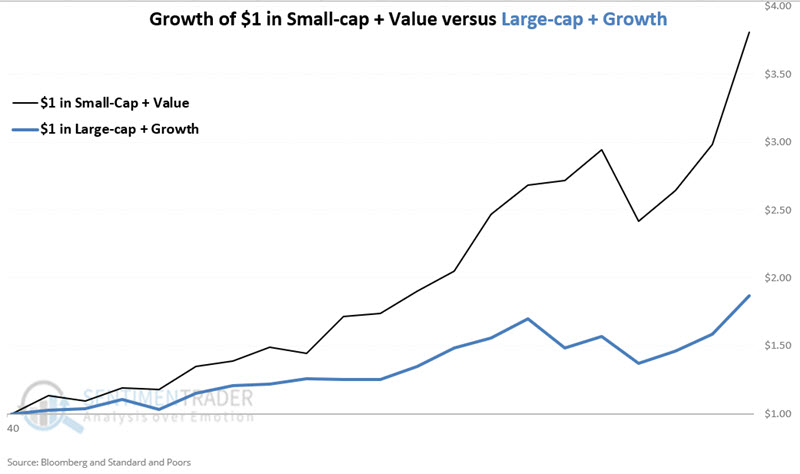
For this test, we will combine the small-cap factor with the value factor and combine the large-cap factor with the growth factor, and track cumulative results.
The chart below displays the hypothetical growth of $1 split evenly between small-cap and value indexes for sixty-three trading days after each presidential election (black line) versus the hypothetical growth of $1 split evenly between large-cap and growth indexes (blue line). $1 invested in Small-cap/Value grew to $3.81 versus $1.87 in Large-cap/Growth.
Many ETFs and mutual funds track small-cap, large-cap, value, and growth factors, and investors are encouraged to explore the possibilities on their own. The table below offers a "quick and dirty" guide to one choice for each category, with good volume and low expense ratios.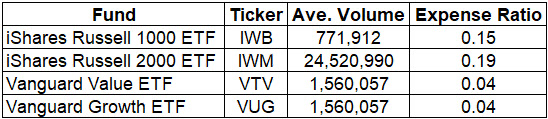
Six months after
Jay followed that up by lengthening the time frame and looking at returns during the six months after an election.
The table below summarizes the performance for each S&P 500 sector during the 126 trading days after each election. The top performer for each Measure is highlighted in green.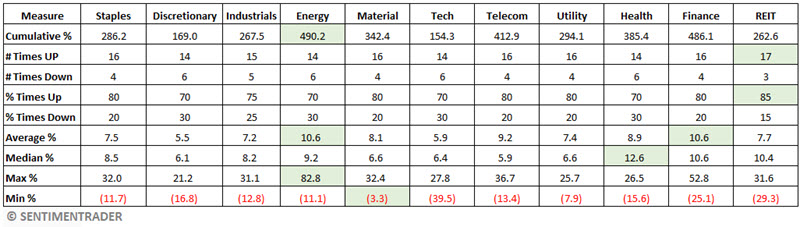
Energy and Finance had the highest cumulative returns; however, Healthcare had the highest median returns. REITs had the highest Win Rate (85%), while five other sectors had a Win Rate of 80%. For the risk-averse, it is interesting to note that the worst six-month loss for Materials was just -3.3%.
Among factors, small-caps were the leading factor nine times, and all of the last three. Value outperformed growth in 14 of 20 periods and was the top performer among all four factors six times.
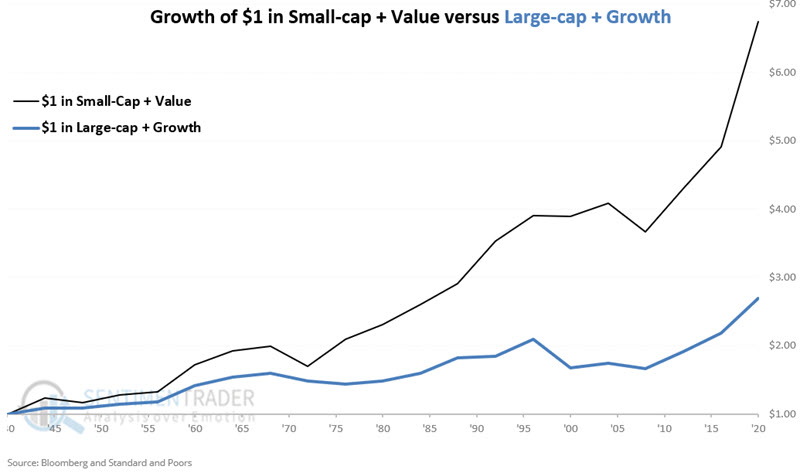
The chart below displays the hypothetical growth of $1 split evenly between small-cap and value indexes for 126 trading days after each presidential election (black line) versus the hypothetical growth of $1 split evenly between large-cap and growth indexes (blue line). $1 invested in Small-cap/Value grew to $6.74 versus $2.69 in Large-cap/Growth.
Creating a system
Jay summarized by noting that small-caps have done best during the first 63 trading days after a presidential election, and value has done best during the second 63 trading days. So, he tested the strategy of being long the S&P 500 Small-Cap index for 63 trading days after a Presidential Election and long the S&P 500 Value index for the next 63 trading days after that.
For 2024-2025, this would involve:
- Buying small-caps (ticker IWM) at the close of election day (2024-11-05)
- Selling small-caps (IWM) at the close on 2025-02-25 and switching into value (ticker VTV)
- Selling VTV at the close on 2025-05-08 (the 126th trading day after the 2024 election)
At that point, the capital would likely be allocated to some other strategy since the next trading opportunity will not occur until November of 2028. The chart below displays the hypothetical growth of $1 invested using the simple rules listed above.
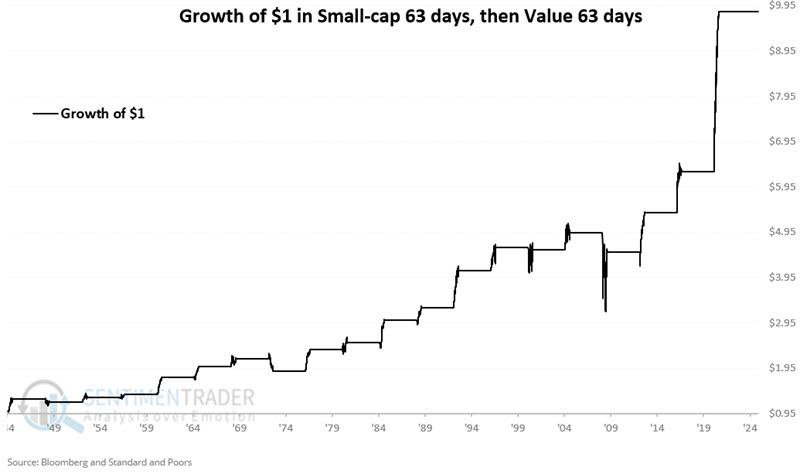
The table below displays 126-day performance for the 126 trading days after each election for various factors, including the system noted above. The green highlights show which factor or strategy performed best. We can see how much more often the system was green relative to the others.
A bad October is...good?
The S&P 500 closed lower for the month of October. Jay noted that while this ended a streak of five consecutive up months, the stock market tends to perform well after this "pause that refreshes."
The stock market tends to perform well after registering five consecutive up months. The end of such a winning streak is typically not an unfavorable omen. The chart below highlights the down months for the S&P 500 that marked the end of a five-month or more winning streak starting in 1950. Another new signal occurred at the close on 2024-10-31.
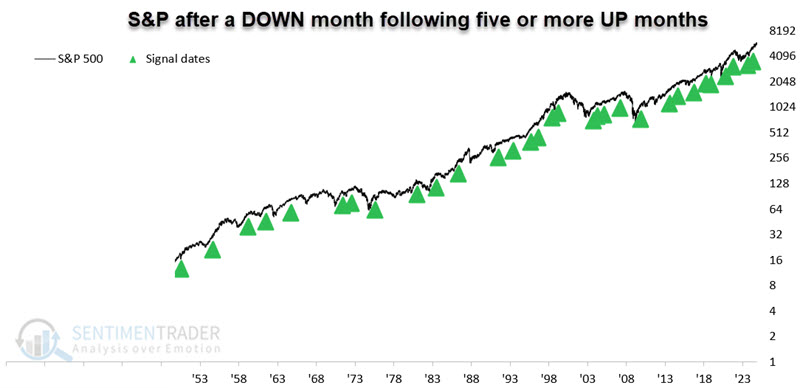
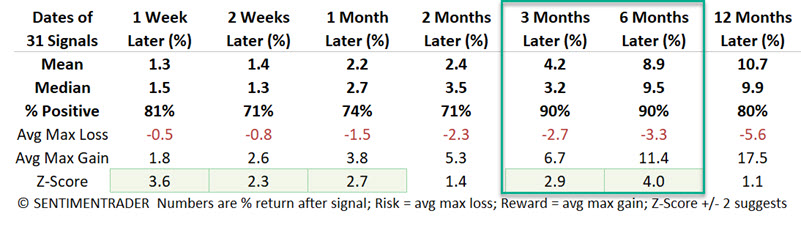
Over the next six months, the S&P rise more than +10% after fourteen of the signals while never losing more than -10%.
So, let's assume we plan to buy and hold an S&P 500 index fund for six months following each of the dates listed above. The table below displays the end result, i.e., the six-month performance for the S&P 500 Index and the maximum drawdown from the point of entry that a trader would have had to endure to achieve the six-month return.
The red boxes in the table below highlight those times when the maximum open loss exceeded -7%. In four cases, the S&P bounced back and closed higher after six months (by +12.8%, +8.8%, +8.1%, and +13.8%). In the other case, the S&P ended down -7.7%.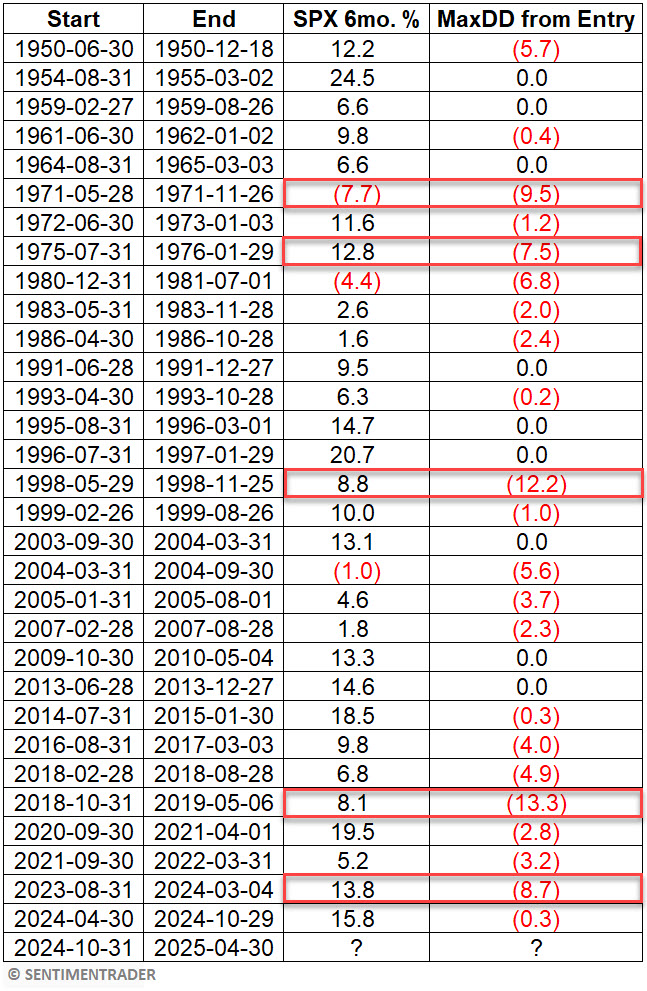
About TradingEdge Weekly...
The goal of TradingEdge Weekly is to summarize some of the research published to SentimenTrader over the past week. Sometimes there is a lot to digest, and this summary highlights the highest conviction or most compelling ideas we discussed. This is NOT the published research; rather, it pulls out some of the most relevant parts. It includes links to the published research for convenience, and if you don't subscribe to those products, it will present the options for access.