
TradingEdge Weekly for Nov 15 - Bond seasonals, small cap participation, bitcoin buy

Key points:
- A look at cross-asset returns in the days following the presidential election
- In the Nasdaq 100, traders are showing less demand for liquidity
- Looking at a seasonal timing system between the equal- and cap-weighted versions of the Nasdaq 100
- More than 20% of Russell 2000 small-cap stocks hit a new high, but relatively few are above their 200-day averages
- Treasury notes and bonds are heading into a seasonally favorable period
- Outlining a seasonal timing system for bonds
- Gold has had a stiff pullback after its most recent high
- Bitcoin has generated a trend-following buy signal
- The next few months look good for real estate
Election reactions
It's usually a mistake to read much of anything into the immediate market reaction to an important news event like the presidential election. Now that participants have had a few sessions to evaluate the implications of a return of President Trump, we can perhaps get a bit more of a read on what it may mean.
The table below shows the 3-day asset class reactions after elections that are the most and least similar to the past few days. Generally, the highest-correlated reactions saw stocks jump, the dollar rise, gold decline, and yields rise, with decent breadth on the NYSE. The lowest correlated reactions tended to see feeble reactions across stock indexes, while gold rose. The dollar and yields were mixed.
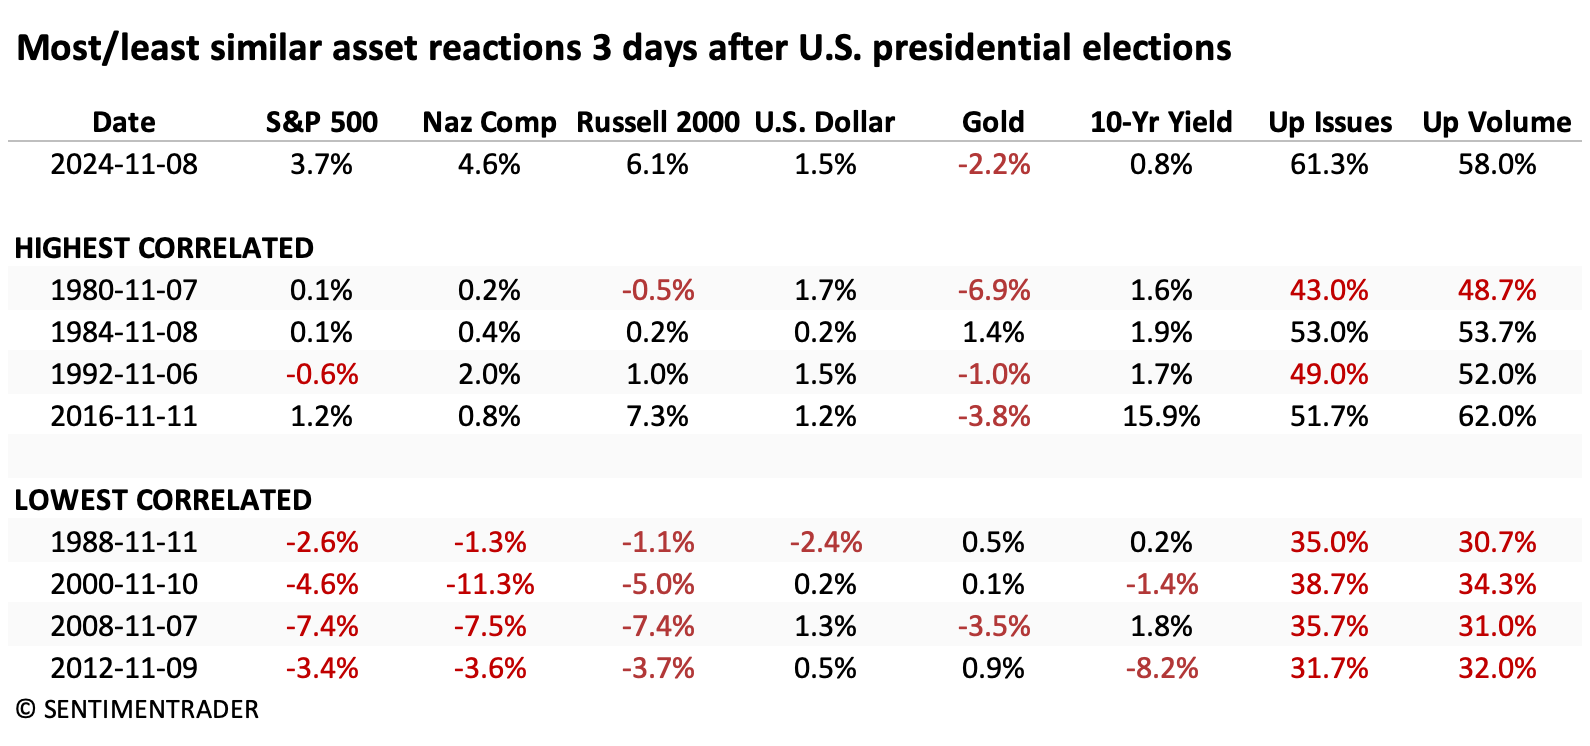
After the highest correlated asset reactions, the S&P 500 did very well. There were no significant declines over the next few months, though a couple eventually morphed into recessions. After three of them, the S&P rose more than +7% in the following three months.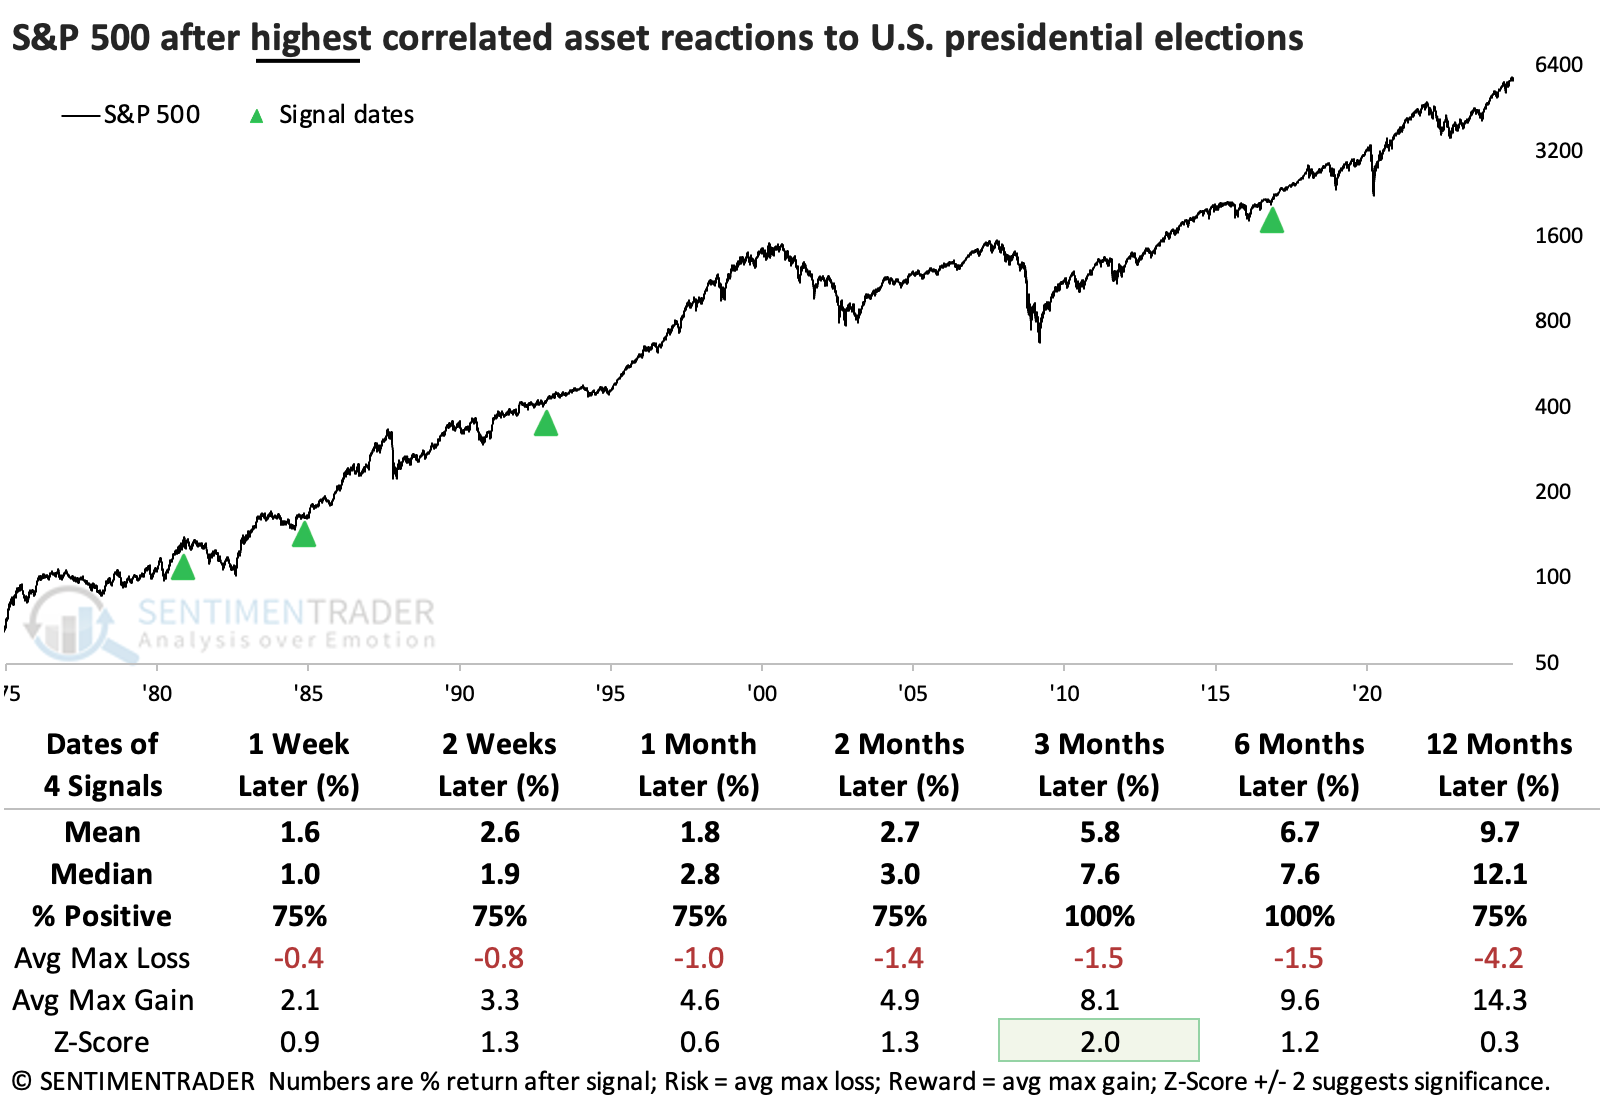
After the lowest correlated reactions, stocks did perform worse than after the highest correlated reactions. The S&P suffered relatively large losses twice in the months ahead, though it also enjoyed large gains twice. There's not much to conclude there.
Below, we expand the returns to look at all the asset classes we monitored in the first table. Those returns were good across the equity indices, especially the Nasdaq and Russell. The dollar also rose all four times over the next 2-3 months, which made it a challenging environment for gold. Yields were mixed.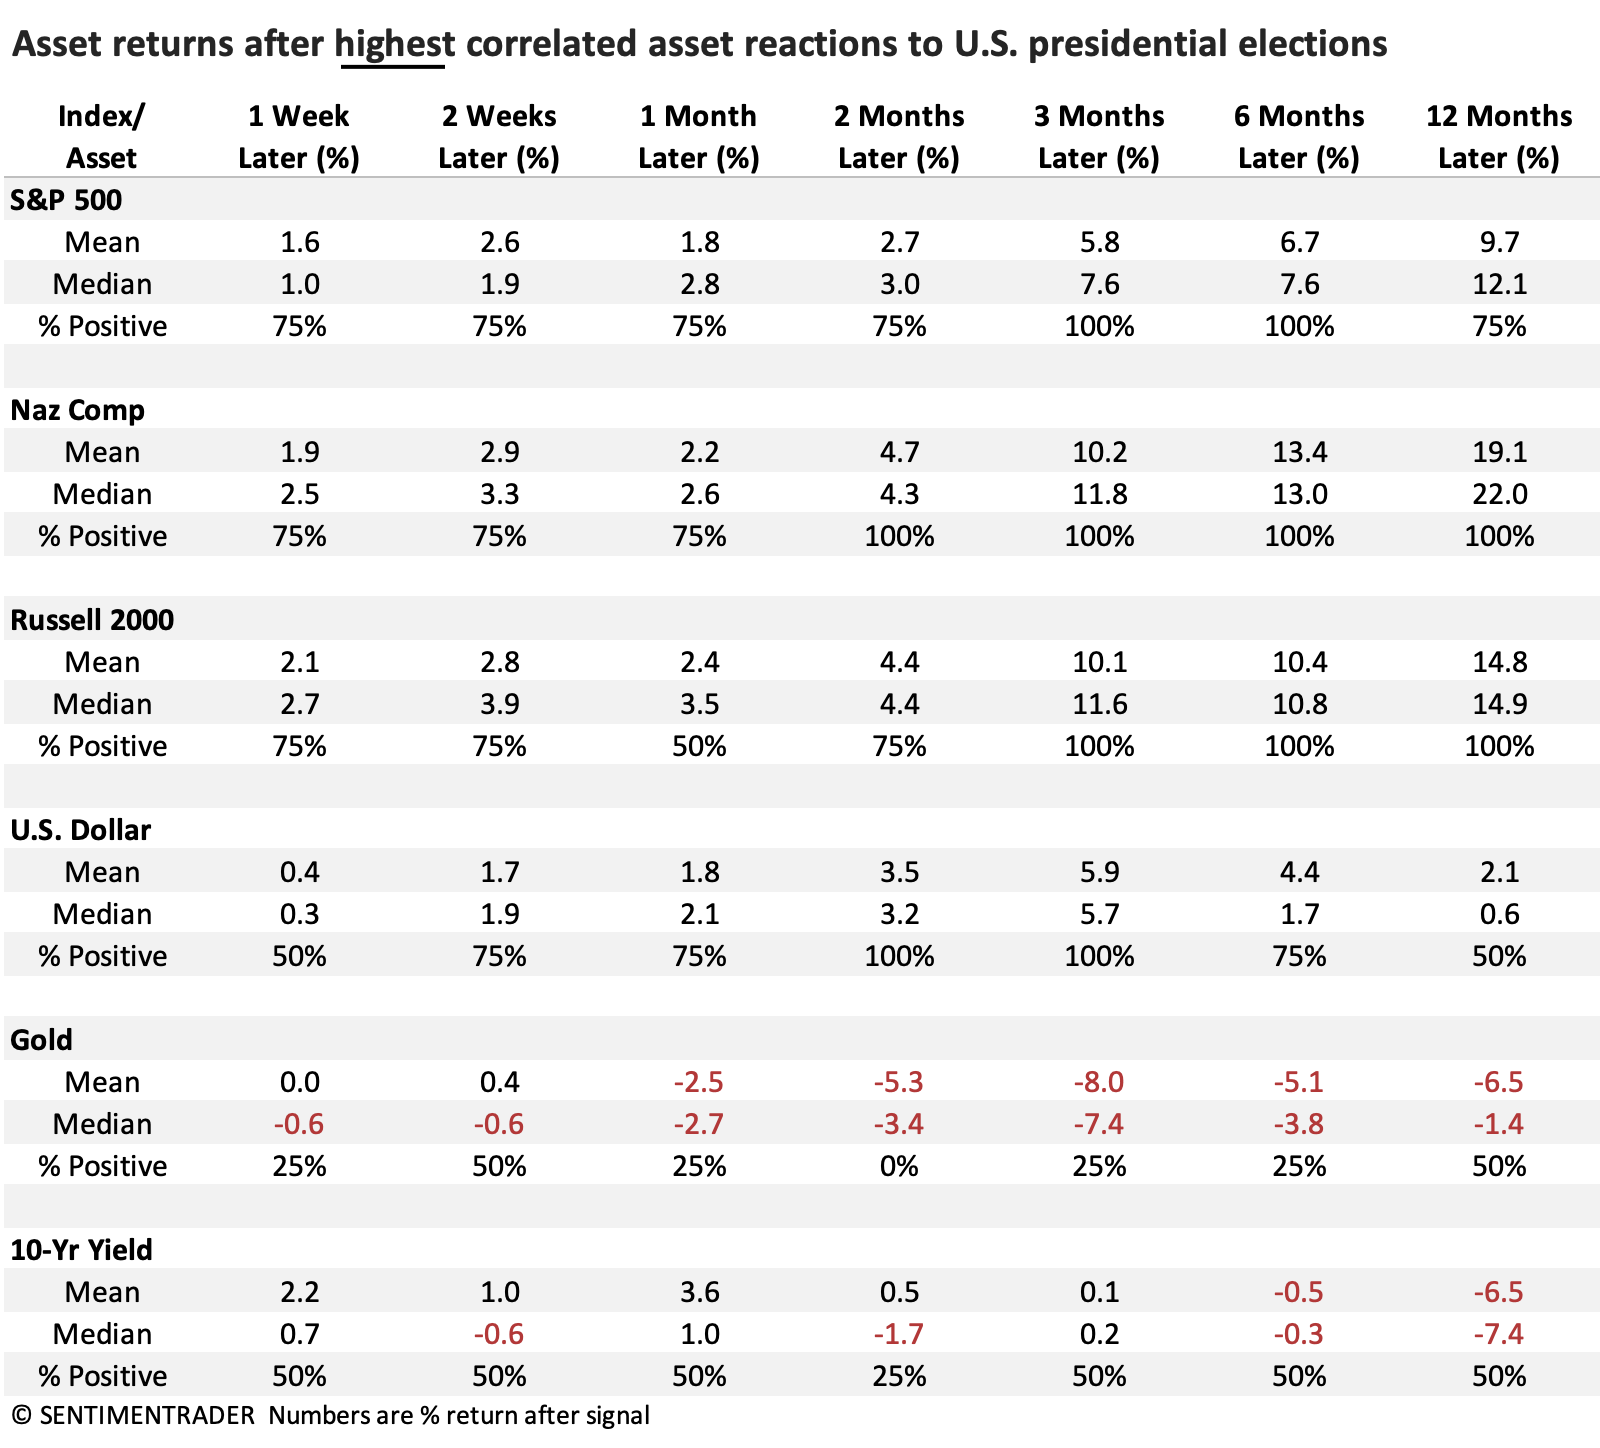
After the lowest correlated asset class reactions, stocks and the dollar behaved much less favorably over the next few months.
Less premium demanded for liquidity
The Nasdaq 100 liquidity premium indicator cycled from the upper end of its recent range to the lower end. Dean showed that similar shifts in this volume-based sentiment indicator produced a 100% win rate over the following year.
The Nasdaq 100 liquidity premium indicator compares the Nasdaq 100 ETF (QQQ) volume to that of the underlying stocks comprising the Nasdaq 100. When the indicator rises, it suggests that investors are uncertain about the outlook for the market.
The system generates a buy signal whenever the 84-day range rank for the QQQ liquidity premium indicator cycles from above 99% to under 24% and index momentum is positive.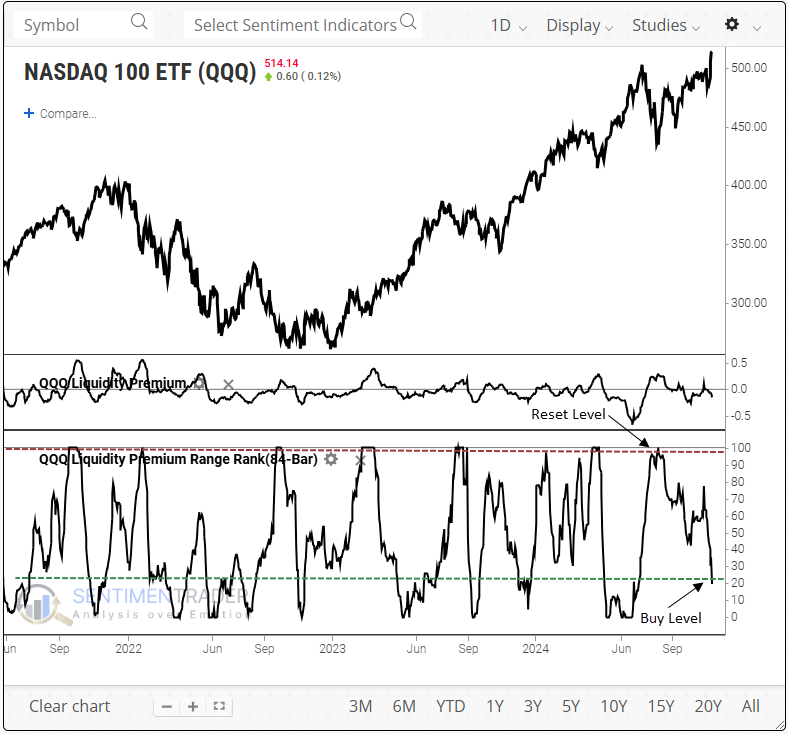
Whenever the QQQ liquidity premium indicator triggered a range-rank buy signal, with the ETF above its 200-day average, within 1% of a multi-year high, and exhibiting positive momentum, the Nasdaq 100 ETF (QQQ) rose 100% of the time over the subsequent year. Despite a highly favorable one-year outlook, the popular ETF tended to stall around the two-and three-month intervals before rallying again.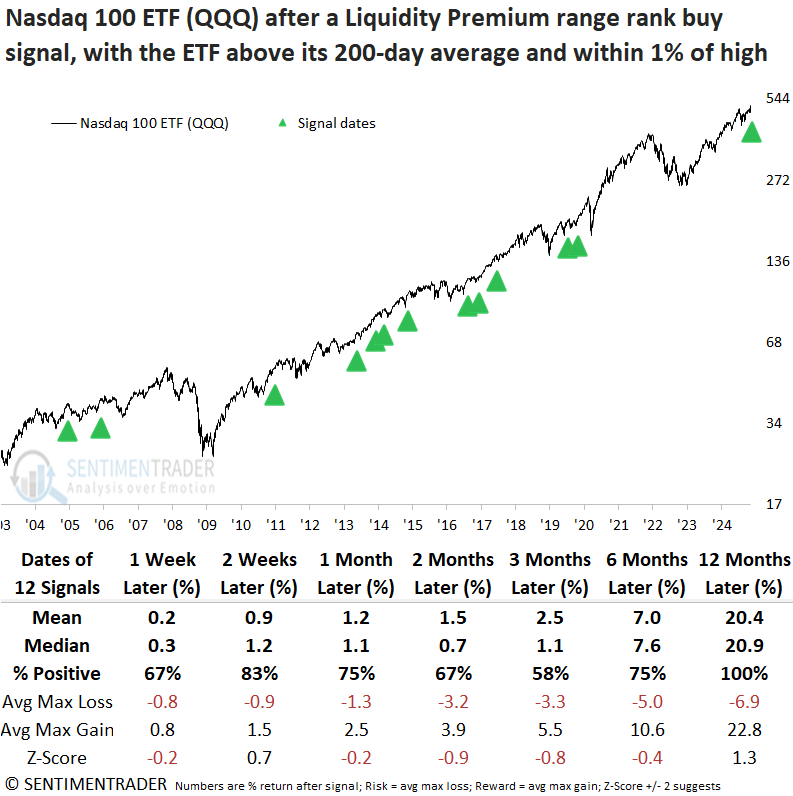
The relative trend composite for the Nasdaq 100 ETF (QQQ) displays a score of five, indicating that 5 out of 10 indicators maintain a favorable condition. As illustrated in the following chart, when the absolute and relative trend score composites are eight or higher in unison, the ETF yields an annualized return of 12.4%, outperforming returns when scores are lower and random returns over the study period.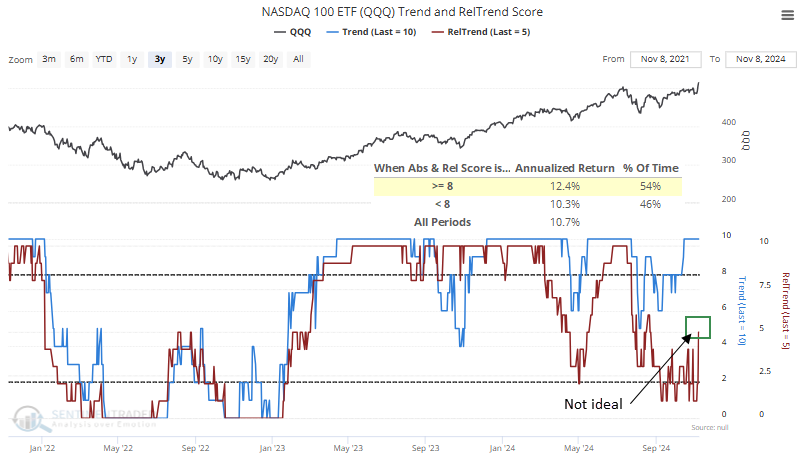
Since the current relative trend score for the QQQ ETF is not as favorable as the absolute trend score, comparing the Nasdaq 100 to the S&P 500 could shed light on the timing of a potential trade based on previous liquidity premium signals.
Equal-weight switch based on the calendar
Previously, Jay highlighted a strategy that switches between the S&P 500 Index and the S&P 500 Unweighted Index based on the time of year. This piece considers a similar approach using the Nasdaq 100 Index versus the Nasdaq 100 Unweighted Index.
For testing purposes, we will use the Invesco QQQ Trust (ticker QQQ) and First Trust NASDAQ-100 Equal Weighted Index Fund (ticker QQEW). Over the years tested, the original cap-weighted Nasdaq 100 Index has outperformed the equal-weight version from March through October and underperformed the equal-weight version from November through February.
The chart below displays the hypothetical growth of QQQ vs. QQEW only during November through February, starting in 2005. $1 in QQEW only from November through February has grown to $2.43, and $1 in QQQ to $1.85.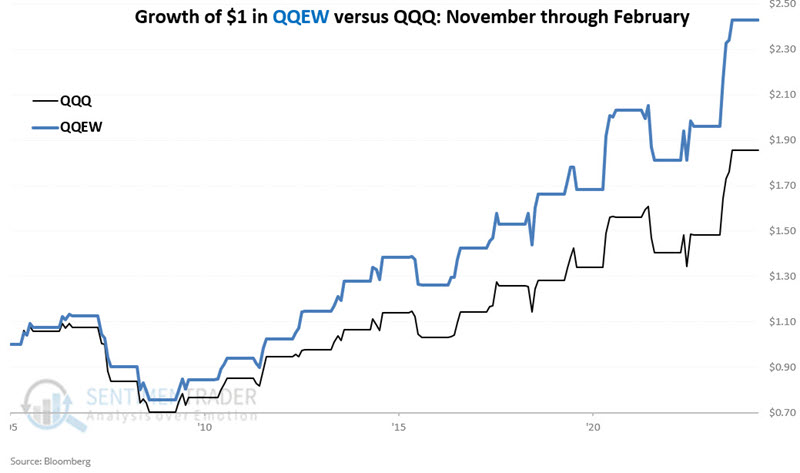
The chart below displays the hypothetical growth of QQQ vs. QQEW only from March through October. $1 invested in QQQ only from March through October has grown to $7.09; in QQEW, it has grown to $3.19.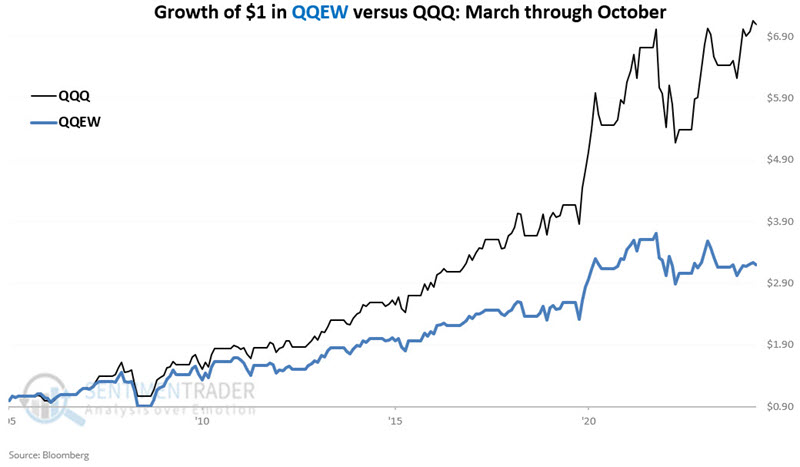 Now, let's do the following:
- If the current month is November through February, we will hold the NASDAQ 100 Unweighted Index (QQEW)
- If the current month is March through October, we will hold the NASDAQ 100 Index (QQQ)
The chart below displays the hypothetical growth of $1 utilizing the rules above. $1 grew to $17.28 by the end of October 2024. It also shows the growth of $1 using the inverse strategy (i.e., long QQQ November through February and long QQEW March through October).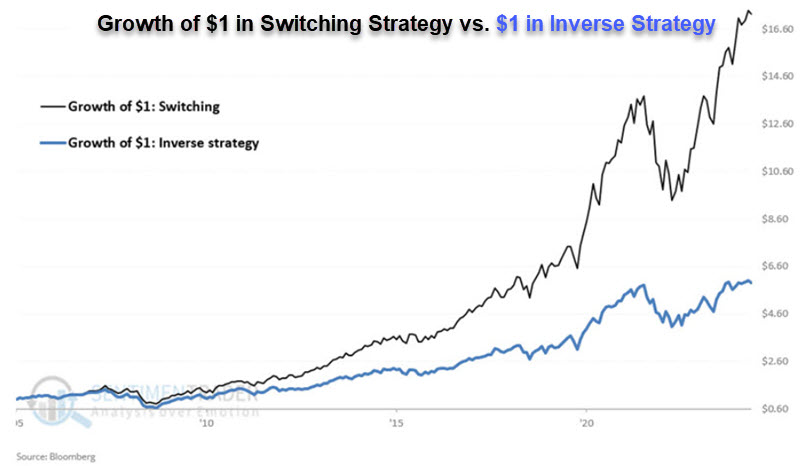
Revenge of smaller stocks
The initial election reaction was impressive, with a massive rally in the Russell 2000 on Wednesday.
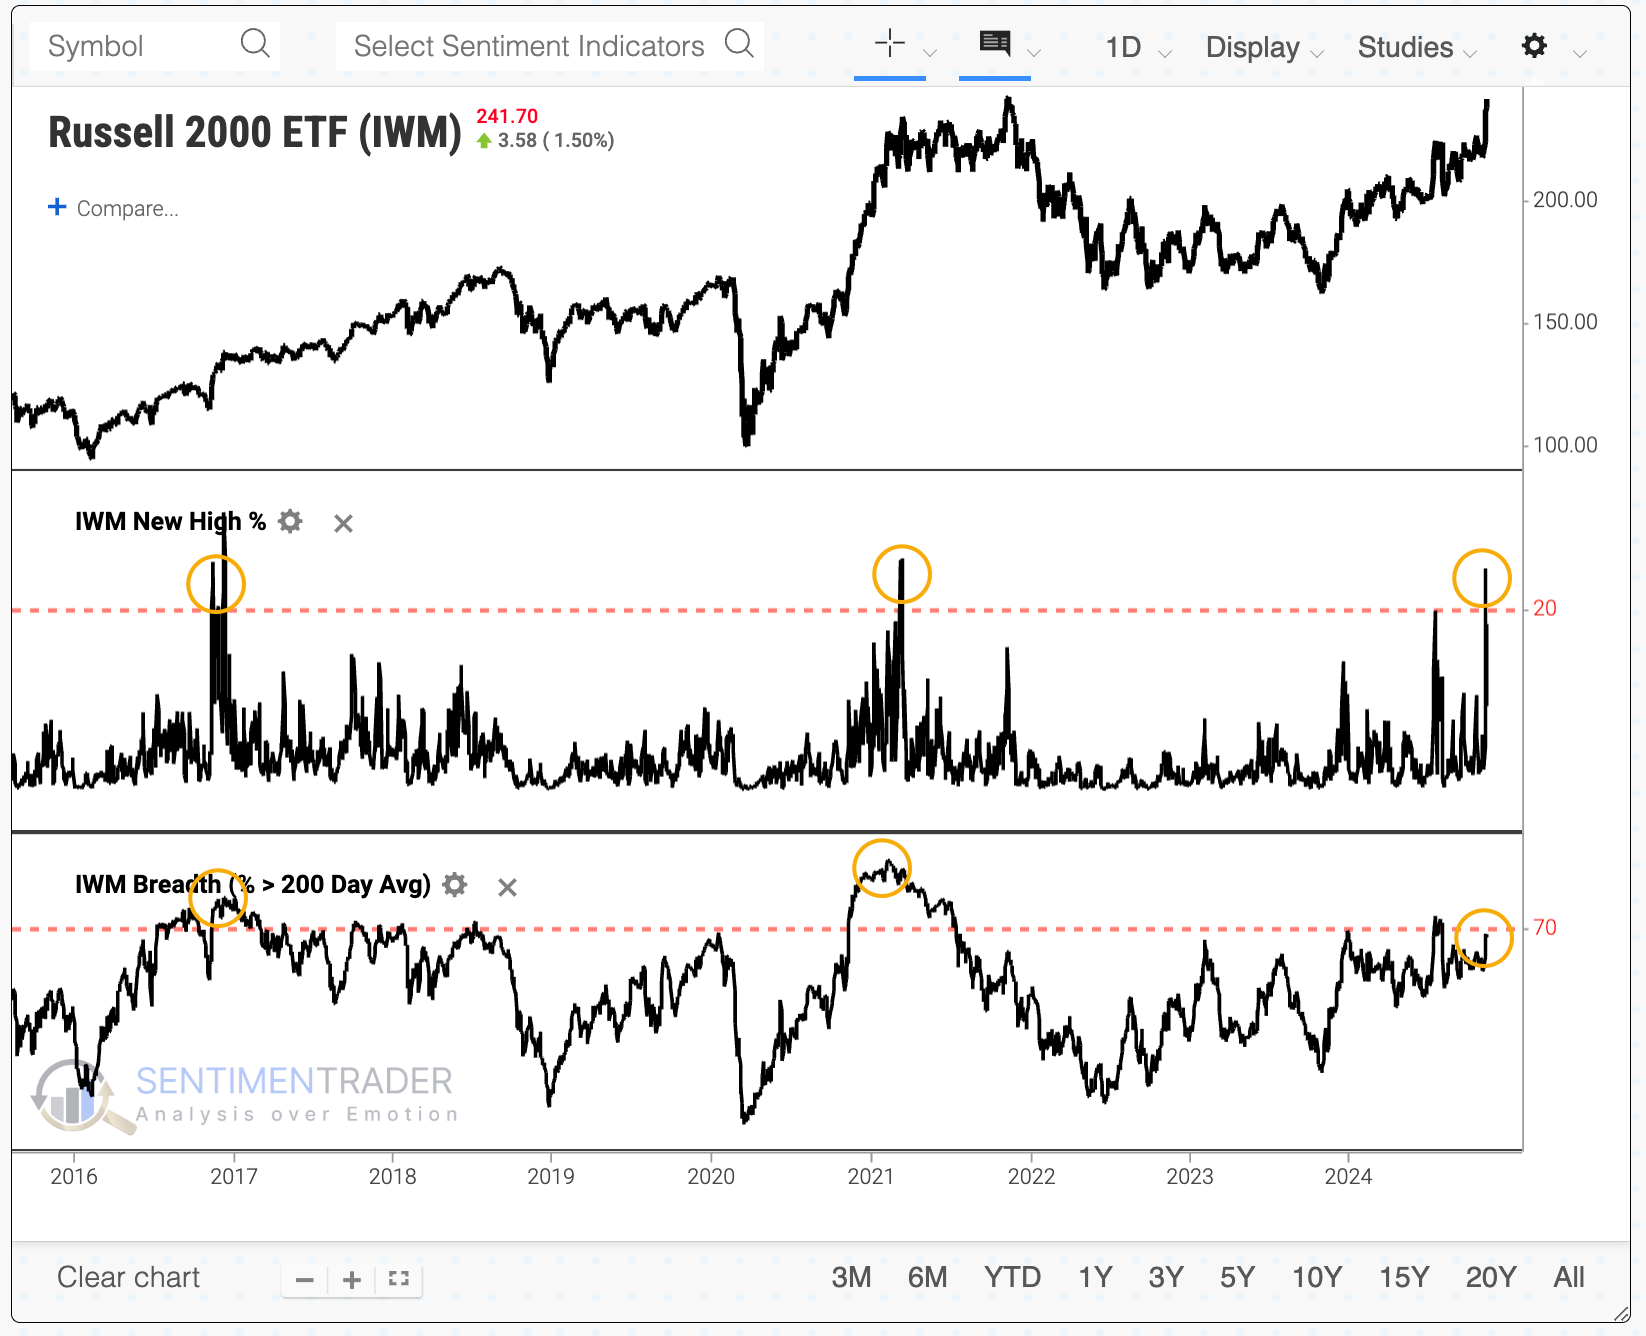
Almost a quarter of Russell 2000 members scored a new high that day, the 3rd-most in 25 years. Curiously, though, fewer than three-quarters of Russell 2000 stocks are even trading above their 200-day moving averages. On average, more than 80% of Russell 2000 stocks are trading above their 200-day averages on days when more than 20% of them score new highs. Fewer than 70% were this time.
The table below shows those times when more than 20% of Russell 2000 stocks hit a new high and the fewest percentage of stocks traded above their 200-day moving averages. The conclusion was clear-it made no difference. In fact, forward returns in the Russell were exemplary.
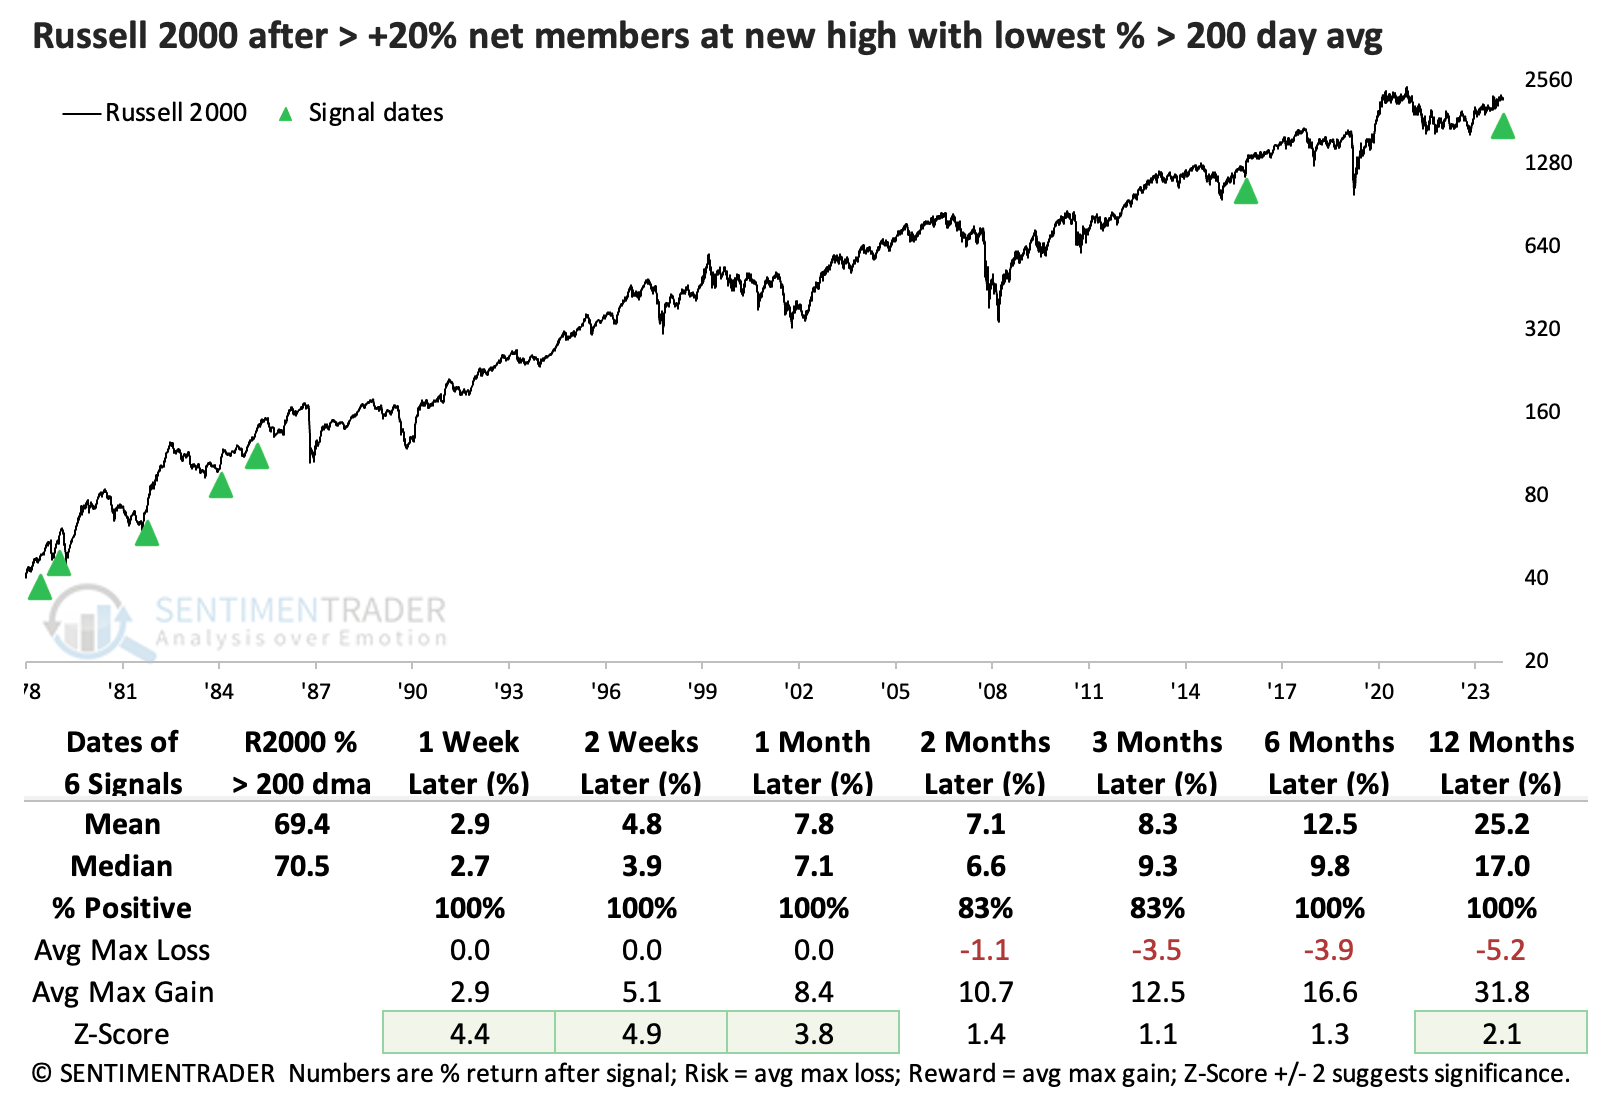
Only the 1980 signal preceded any kind of notable drawdown-all the others were minimal, while all of them preceded double-digit gains. The S&P 500 did very well after these signals, too-arguably even better from a risk/reward perspective.
The Russell 2000 is on track to record its fourth consecutive year underperforming the S&P 500. Since the index's inception at the end of 1978, its underperforming streak has reached four years only once, in 1997. It underperformed again in 1998, then went on a wicked relative rebound over the following decade.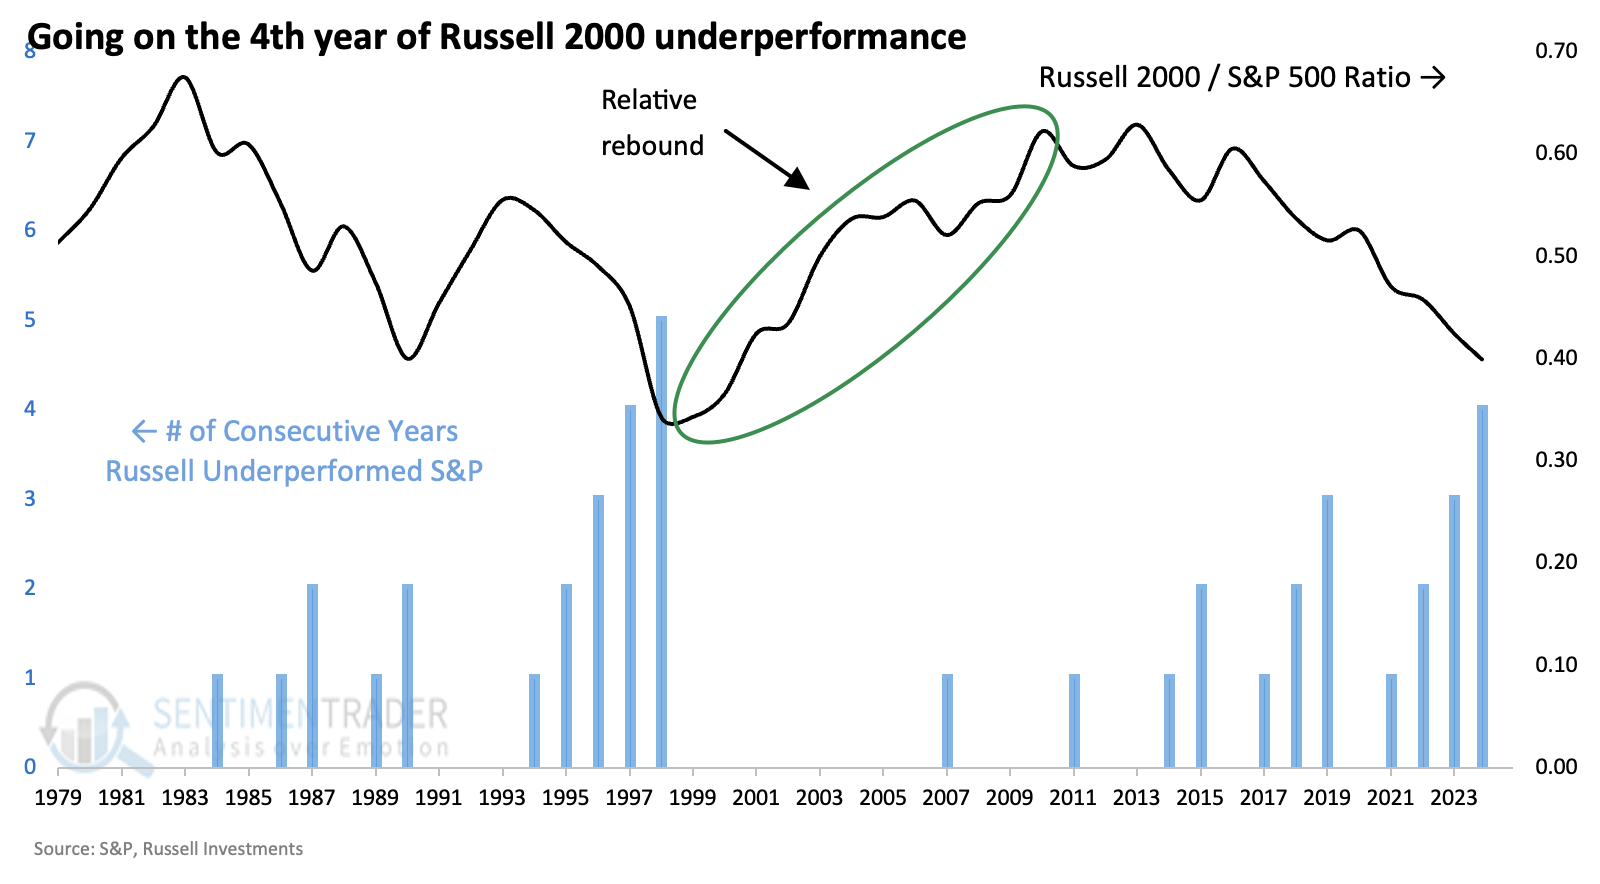
If we go back further using total return, the current streak of small-cap underperformance is unlike we've ever seen. It has reached five years twice, both leading to half-decade relative rebounds.
Seasonality for bonds
Jay suggested that there are reasons for investors to remain wary of long-term bonds, but traders should be looking for a trading opportunity as seasonality suggests the potential for a tradable bounce in the months ahead.
From the perspective of an investor considering whether or not to make a meaningful long-term commitment to the long side of treasury bonds, there are still numerous reasons to remain cautious. For example, the Copper/Gold Ratio remains unfavorable as does the JK Bond Cycle Model.
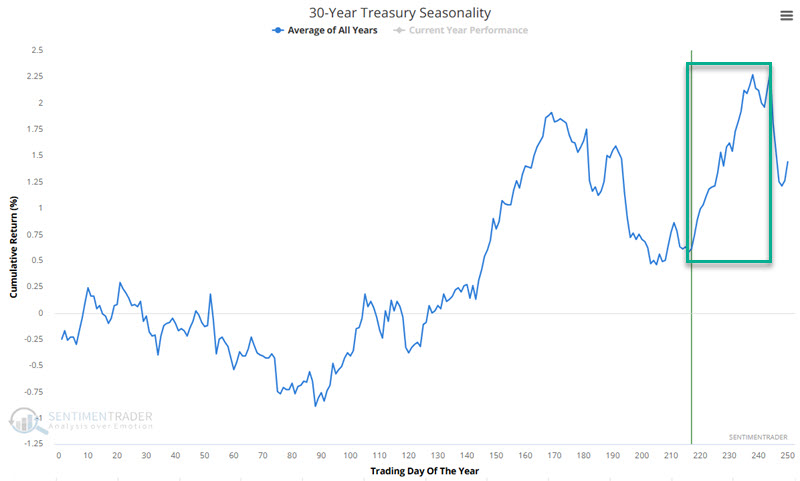
As always, seasonality is not a roadmap and is typically most useful when price action and seasonality align. Seasonality is on the cusp of a (potentially) favorable period, but price action remains a mixed bag. The chart below displays the annual seasonal trend for 30-year treasury bond futures. A favorable period extends from Trading Day of the Year (TDY) #216 through TDY #244. For 2024, this period extends from 2024-11-06 through 2024-12-17.
The chart below displays the hypothetical cumulative $ +(-) from holding a long position in t-bond futures only during this period each year since 1978.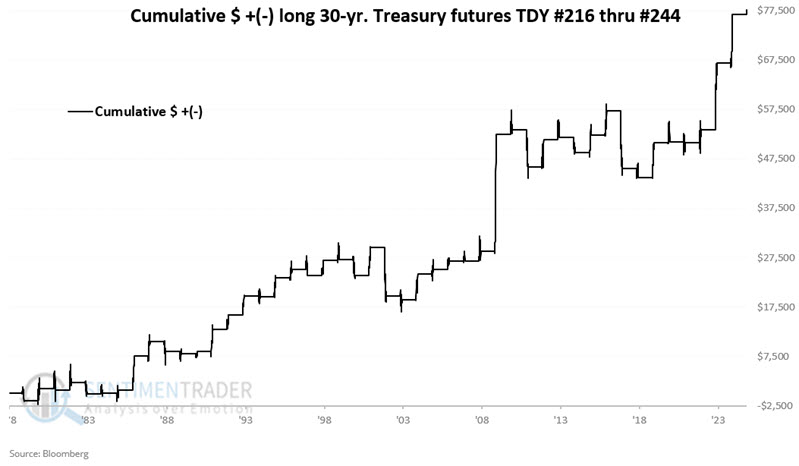
A 65% Win Rate tells us there may be an edge, but this is far from a sure thing year by year. Also, on the favorable side, the median win is 1.83 times the median loss, and moves of $4,000 or more have skewed 10 to 3 to the favorable side.
The win rate was higher for the popular TLT fund, though the median winner was smaller than the median loser.
Using seasonality in a timing system
Jay further combined two seasonal trends into the JK TLT Seasonal Model.
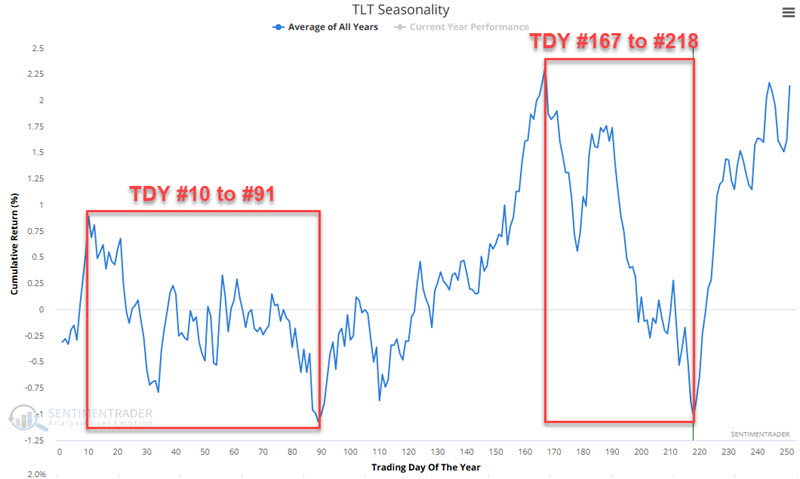
The chart below displays the annual seasonal trend for the iShares 20+ Year Treasury ETF (ticker TLT). We note four distinct periods, using Trading Day of the Year (TDY.
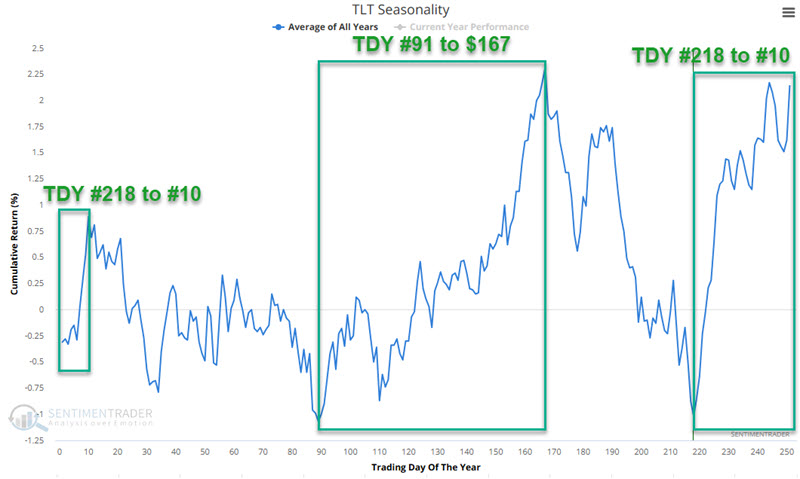
Let's set the following rules:
- A = If TDY is between #91 and #167 OR between #218 to #10 then A = +2 else A = 0
- B = If today is within the last five trading days of the month, the B = +1 else B = 0
- JK TLT Seasonal Model (JTSM) = A + B
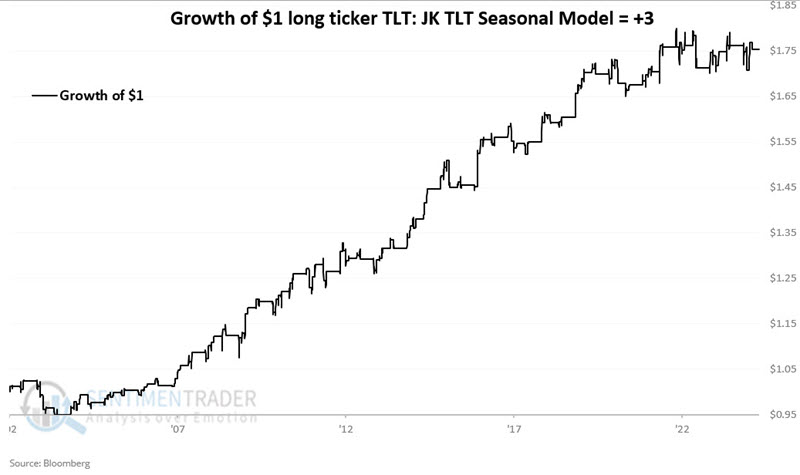
The chart below displays the hypothetical growth of $1 invested in TLT only if the JTSM = +3. $1 increased 75% to $1.75.
Now, let's combine any positive reading for the JTSM into one equity curve chart. The chart below displays the hypothetical growth of $1 invested in TLT only if the JTSM > 0. $1 increased 817% to $9.17. For perspective, the chart includes the equity curve for buying and holding TLT.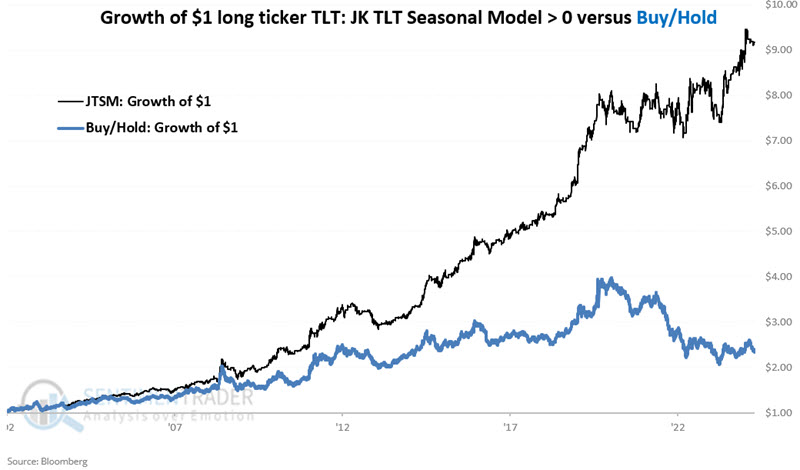
The chart below displays the hypothetical growth of $1 invested in TLT only if TLT Model = 0. $1 declined -74% to $0.26.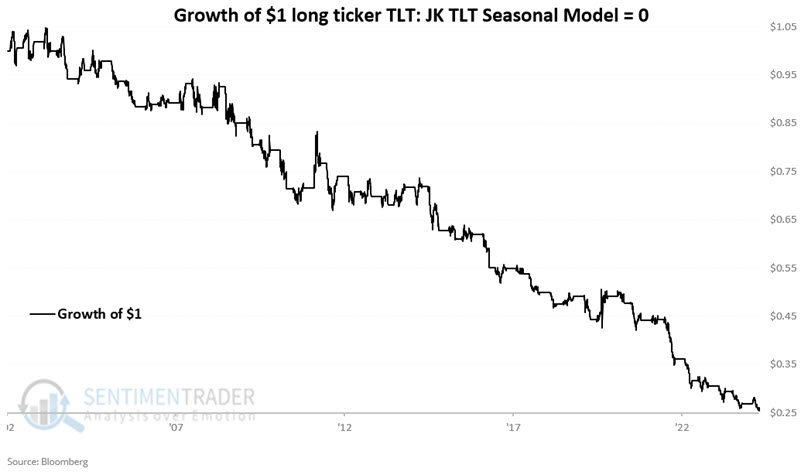
The JK TLT Seasonal Model will be above 0 starting on 2024-11-12 through the close on 2025-01-15.
The shiny metal is losing some luster
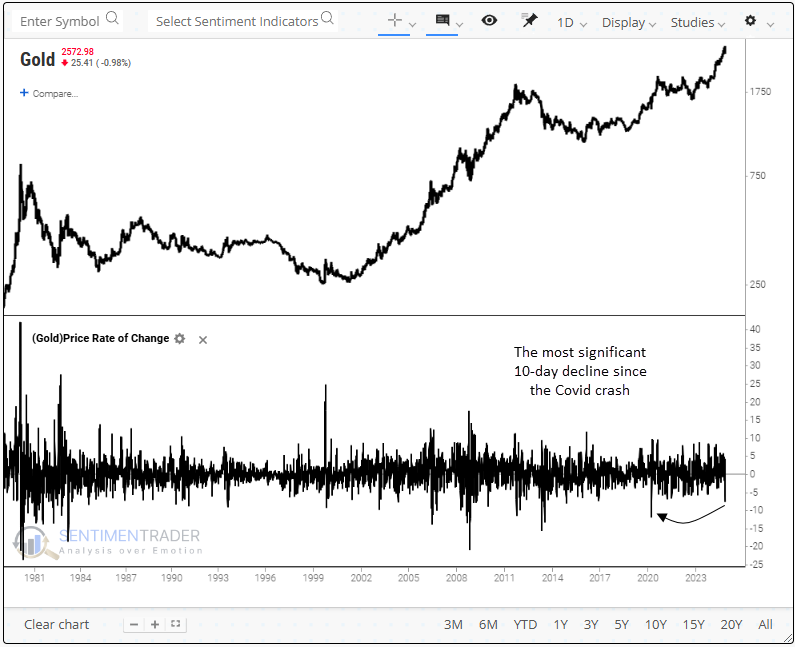
Gold futures declined over 7% in ten sessions from a 3-year high. Dean showed that following similar pullbacks, the precious metal rallied 80% of the time over the next two weeks.
In the past ten sessions, gold has fallen by over 7%, a decline that has occurred 51 times since 1975. However, when measured from a 3-year high to capture precedents similar to now, the number of instances drops to 11, a rare event.
Whenever gold declined 7% in ten sessions from a 3-year high, the precious metal tended to bounce back in the near term, rising 80% of the time over the subsequent two weeks. However, from one to three months later, the rally stalled and, in some cases, saw further downside price action. That was especially the case since 2003.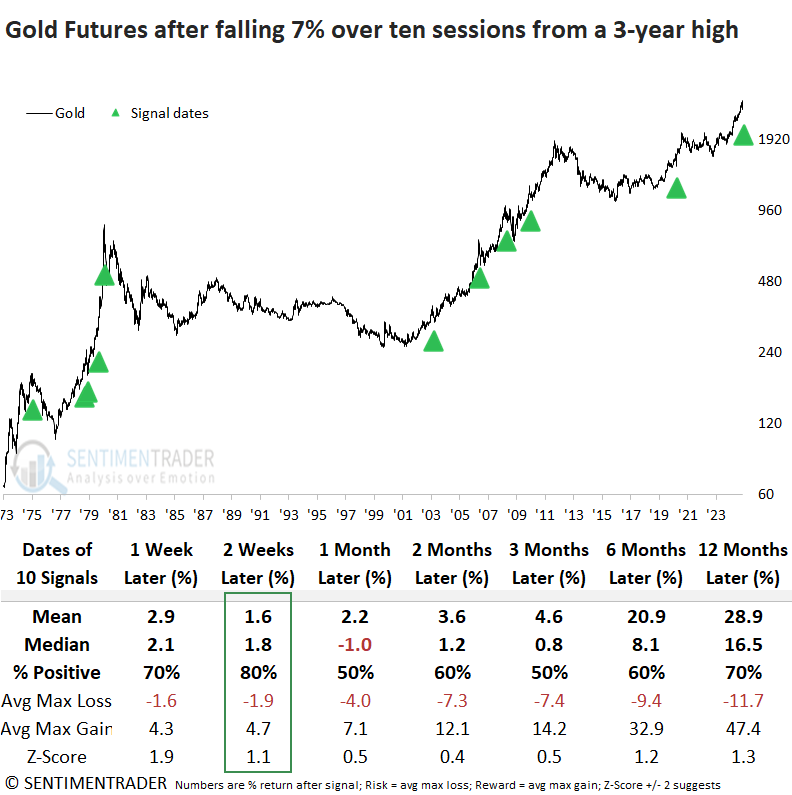
Since 2003, gold has recorded a gain in four out of five instances at the two-week mark. However, the max loss exceeded the max gain in the last four cases.
Although a new one-year high precedes a one-year low in 70% of cases, an immediate rebound to fresh highs appears unlikely. In similar scenarios, the time to reach a new high averaged 95 days, with a median of 61 days.
Subscribers can now review trend and relative trend scores for gold and other assets on the website. The gold ETF (GLD) currently displays 9 out of 10 trend-following indicators in favorable conditions. So, despite the recent swoon, gold remains constructive from a long-term trend-following perspective.
Bitcoin blastoff
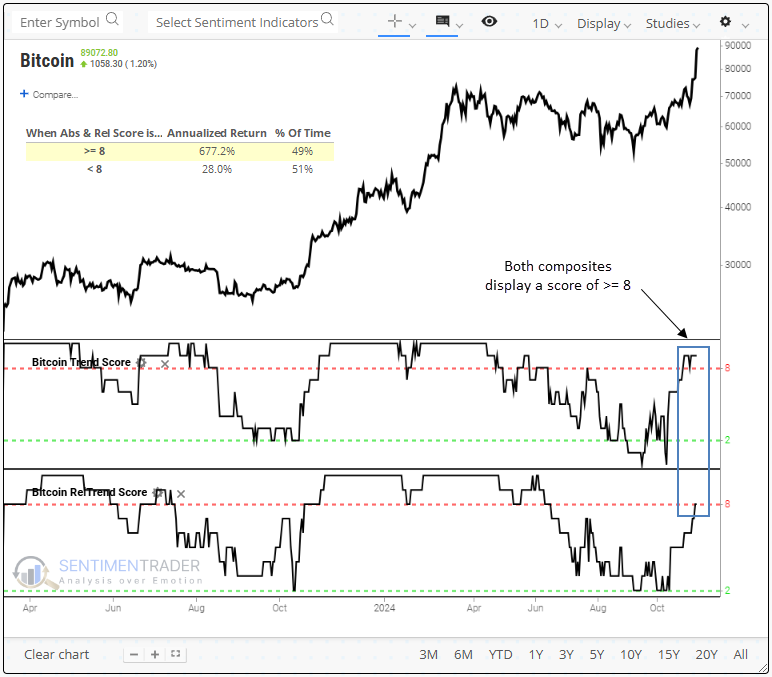
An overwhelming number of trend-following indicators for Bitcoin have shifted to a favorable condition. Dean highlighted a system that uses the new trend and relative trend indicators that triggered a buy signal for the cryptocurrency.
When the trend and relative trend composite scores hold at eight or above, Bitcoin has generated a remarkable 677% annualized return, significantly outpacing the 28% annualized gain when both indicators reside below that level.
With the new trend and relative trend score indicators added to the website and the multi-condition criteria functionality in Backtest Engine v2.0, users can now build sophisticated trend-following systems.
Entry Conditions:
- Bitcoin Trend Score > 7
- Bitcoin Relative Trend Score > 7
- Bitcoin closed at a 10-day high
Exit Conditions:
- Bitcoin Trend Score falls below 5
- Bitcoin Relative Trend Score falls below 5
Entry conditions require simultaneous triggers, whereas exit conditions act independently.
The following table provides each signal's entry and exit dates and the resulting profit or loss. A -37.35% loss in 2020 exemplifies how trend-following systems with long-term indicators are susceptible to significant drawdowns, given their tendency to respond more slowly to price fluctuations. That's especially the case with a risky asset like Bitcoin.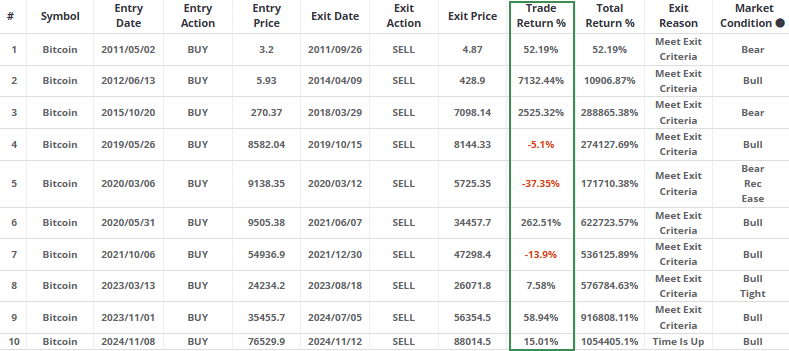
Although the system utilizes the trend scores for its exit criteria, an analysis of time intervals reveals that the entry signals have consistently led to a highly favorable outlook over the following three months, with Bitcoin posting gains in all but one instance.
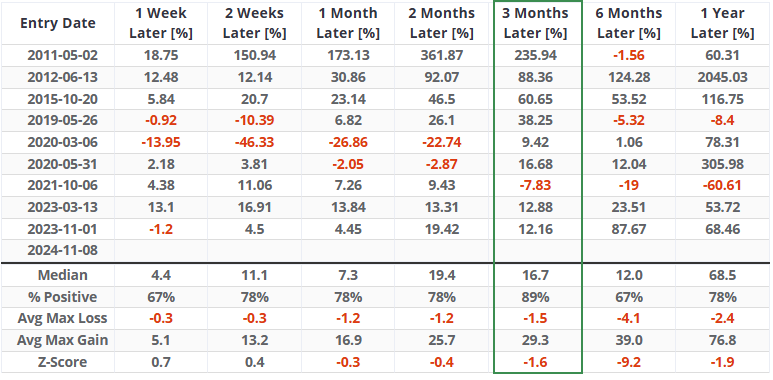 In the advantageous three-month time frame, Bitcoin recorded three maximum losses of more than 10%, the largest of which coincided with the extraordinary Covid crash. Remarkably, several precedents never experienced a loss.
Real estate season
In the stock market, the real estate sector has annual seasonal biases. Jay noted that if history proves accurate, this sector may perform very well between now and early February 2025.
Our annual seasonal trend charts display an average of annual historical performance. By looking at trading days of the year (TDY), we can identify periods that have tended to see meaningfully favorable - or unfavorable - price performance.
The chart below displays the annual seasonal trend for the iShares U.S. Real Estate ETF (IYR), with various favorable times of year highlighted.
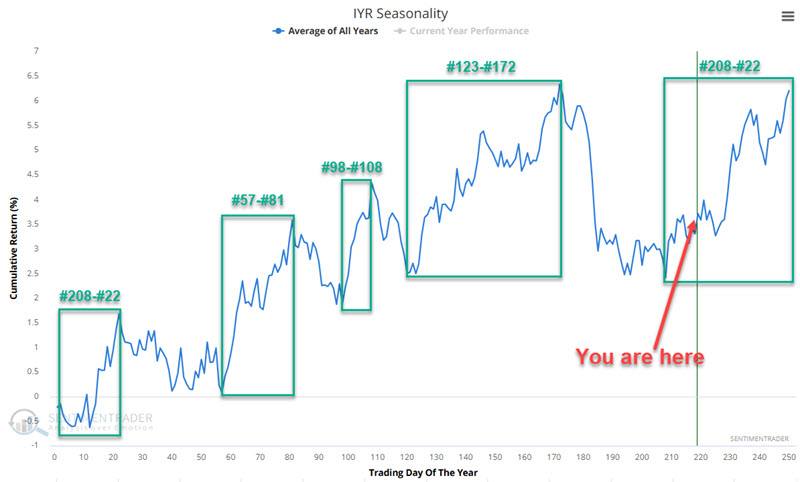
The good news is that a favorable seasonal period began on Trading Day of the Year #208 (2024-10-28) and extends through Trading Day of the Year #22 for 2025 (2025-02-03). The bad news is that so far, the real estate sector has been down roughly -2% since the close on October 28th.
To better handle expectations, let's examine the real estate sector performance during this favorable TDY #208 to TDY #22 period. We will use the S&P 500 Real Estate (SPRE) sector index starting in October 1953 for testing purposes. The chart below displays the hypothetical growth of $1 invested in SPRE from the close of TDY #208 through the close of TDY #22 the following year, every year since 1953.
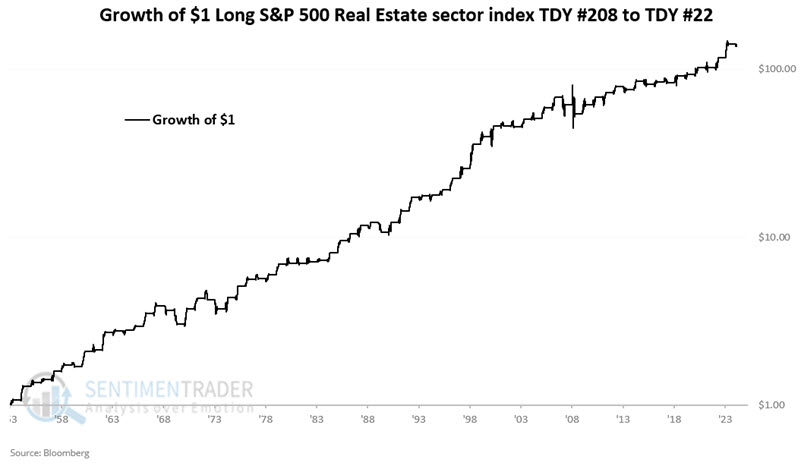
These periods showed a gain 80% of the time, with an average gain about double the average loss. The sector rallied more than +10% during 31 years, while losing more than -10% only 4 times.
About TradingEdge Weekly...
The goal of TradingEdge Weekly is to summarize some of the research published to SentimenTrader over the past week. Sometimes there is a lot to digest, and this summary highlights the highest conviction or most compelling ideas we discussed. This is NOT the published research; rather, it pulls out some of the most relevant parts. It includes links to the published research for convenience, and if you don't subscribe to those products, it will present the options for access.