
TradingEdge Weekly for Nov 11 - More signs of recovering sentiment, investor complacency, sector reversals

Key points:
- Price analogs show that the last year has been similar to 2008, but also years with more sanguine outcomes
- The VIX plunged with a relatively tame move in stocks, but it doesn't indicate complacency
- Some long-term sentiment measures are turning away from pessimism
- The post-CPI buying surge pushed more that half of stocks into long-term uptrends
- A way to limit FOMO by using a simple options strategy
- Investment banking stocks have broken out
- Emerging internet stocks gave a sentiment buy signal
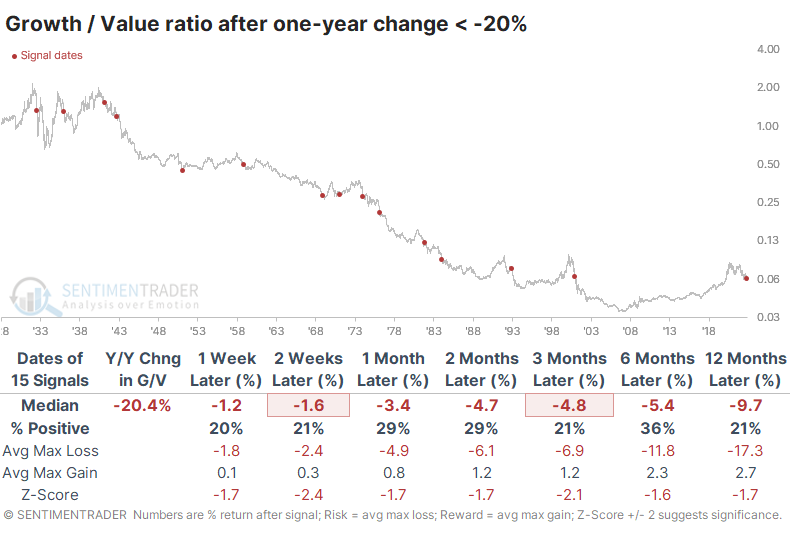
- The Growth / Value Ratio has plunged 20% in a year
- Stocks in the Hang Seng are recovering from a bout of historically extreme selling pressure
- The dollar has some major headwinds
This is like 2008...but also a lot of other years
Whenever stocks tumble, social media fills up with some version of a chart lining up the peak in the S&P 500 a year ago with the peak in 2007 and points out how the squiggly lines look similar. The conclusion, of course, is that we're about to crash. It was popular again early this week.
As we usually do, let's use an objective approach. We'll go back to 1928 and look at the highest-correlation one-year periods to the past year. There were 22 periods that had a correlation of more than +0.80 (on a scale from -1.0 to +1.0).
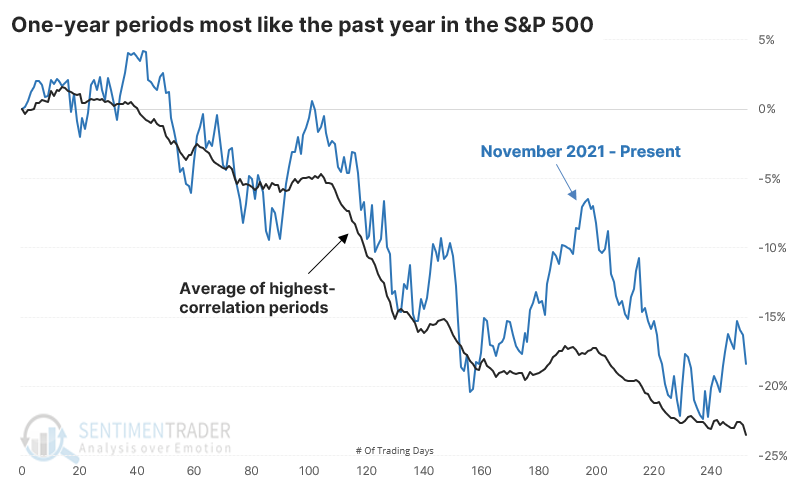
As always, we're more interested in what happened going forward than what happened going backward. The table below shows the S&P 500's returns in the year following the highest one-year analogs.
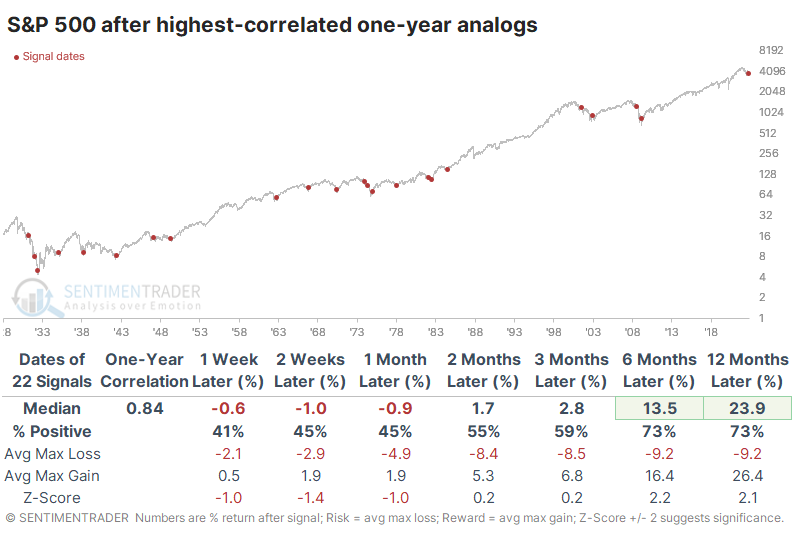
Interestingly, the five analogs with the highest correlation, close to +0.90 or above, showed some of the best returns going forward.
The meltdown in tech stocks has ushered in other dire warnings. The bears tell us that if this isn't a repeat of 2008, then surely it is of 2001. Since the 1971 inception of the Nasdaq Composite, there have been 14 years with a high correlation to the past year.
Over the next year, the Nasdaq suffered some drastic losses...and some even more dramatic gains. Only 2 out of 14 analogs suffered a negative return over the next six months, and the maximum gain averaged nearly three times the average decline.
But investors are too complacent! Not really
The latest hand-wringing about the recent rally suggests that the VIX has dropped too far and too fast. Traders are pricing in much less future volatility despite relatively minor gains in the S&P 500. From its two-month peak, the VIX has plunged more than 25% while the S&P only rallied about 5%.
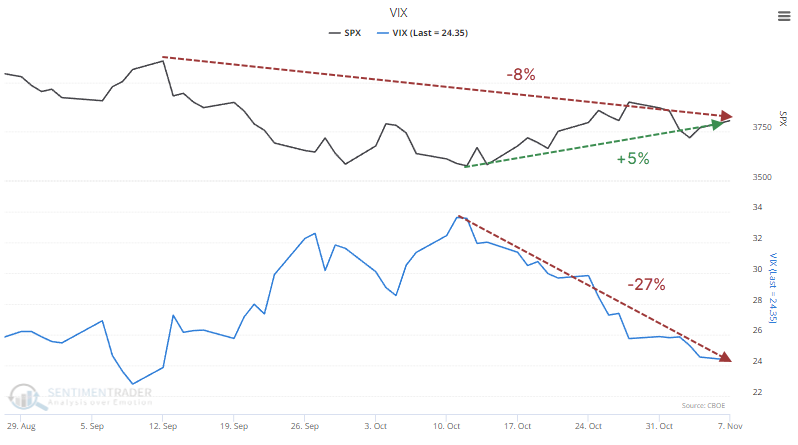
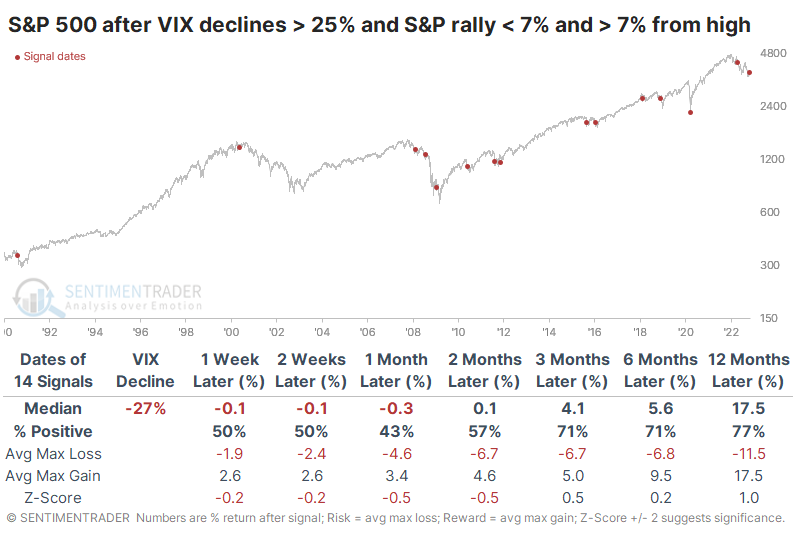
Since 1990, when the VIX declined 25% or more from its highest level of the past two months, the S&P 500 was within 1% of its two-month high on average. This time, it was far below, and that's unusual.
The table below shows every date since 1990 when the VIX declined at least 25% from its highest point of the past two months. At the same time, the S&P 500 rallied less than 7% from its lowest point and remained at least 7% from its highest point. Supposedly, this would show us times of complacency.
The S&P did suffer some poor shorter-term returns, but it didn't consistently and negatively impact medium- to long-term returns.
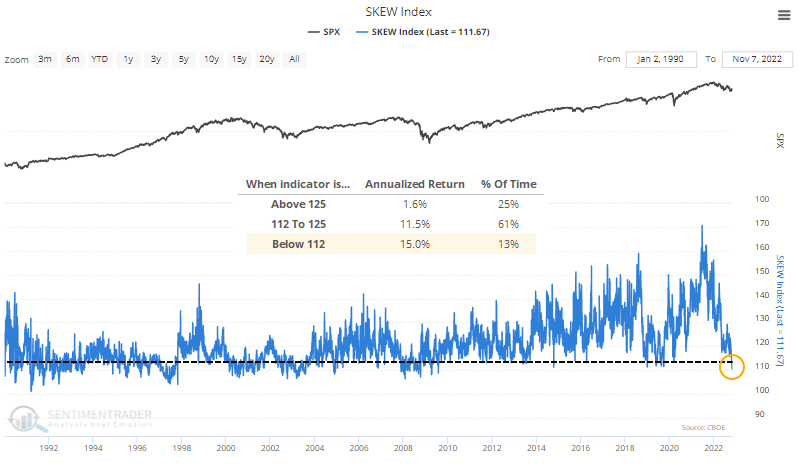
SKEW shows how expensive put options are relative to calls. The higher the figure, the more expensive puts are. It was designed with the assumption that high readings would be equivalent to "fear" and replace the VIX as a gauge of investor anxiety. In practice, it has worked in precisely the opposite way.
With backdated data available to 1990, high readings preceded an annualized return of only +1.6% in the S&P 500. But very low readings, which are supposed to indicate complacency and which we are seeing now, preceded returns of +15.0.
Put/call ratios are starting to show some of this anxiety that seems to be lurking just under the surface. Thanks largely to a surge in put trading in Tesla stock, the Equity Put/Call Ratio surged to one of its highest-ever levels on Tuesday.
There were seven times put trading exceeded calls by 20%, all leading to gains in the S&P 500 over the next three months. The Backtest Engine shows that when put trading outpaced calls by even 5%, the S&P 500 rose over the next three months 29 out of 36 times.
Pessimism is starting to ebb
Jay showed that some long-term models are starting to turn up from extreme pessimism.
Our Panic/Euphoria model inputs are NYSE short interest, margin debt, Nasdaq vs. NYSE volume, Investor's Intelligence survey, AAII survey, retail money market funds, put/call ratios, commodities prices, and retail gasoline prices.
Like most sentiment surveys, this is generally a contrarian indicator when it reaches extreme readings. The chart and table below highlight S&P 500 performance after the Panic/Euphoria Model crossed back above -0.17 which it recently did.
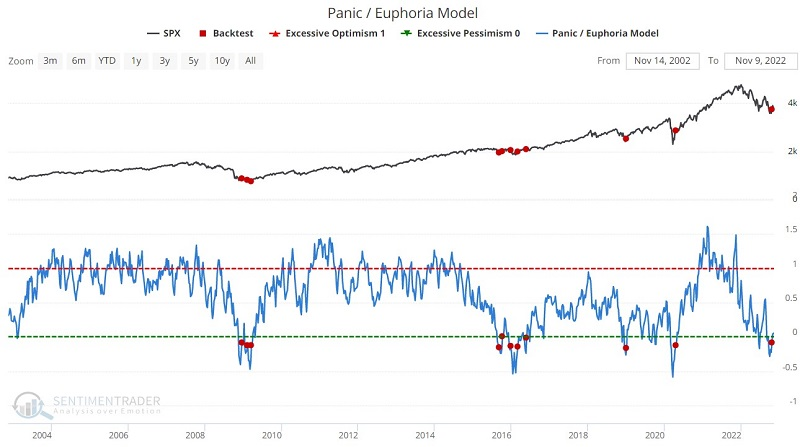
Like many sentiment indicators, signals may not necessarily market the exact bottom in the stock market. But they invariably suggest better days ahead and send a bullish message to investors.
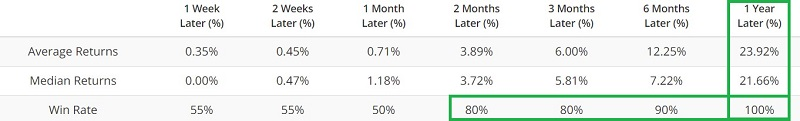
Jay also showed that a survey of small business optimism was an at extreme low. Since that survey's inception, readings this low preceded gains in the S&P 500 over the next year 86% of the time.
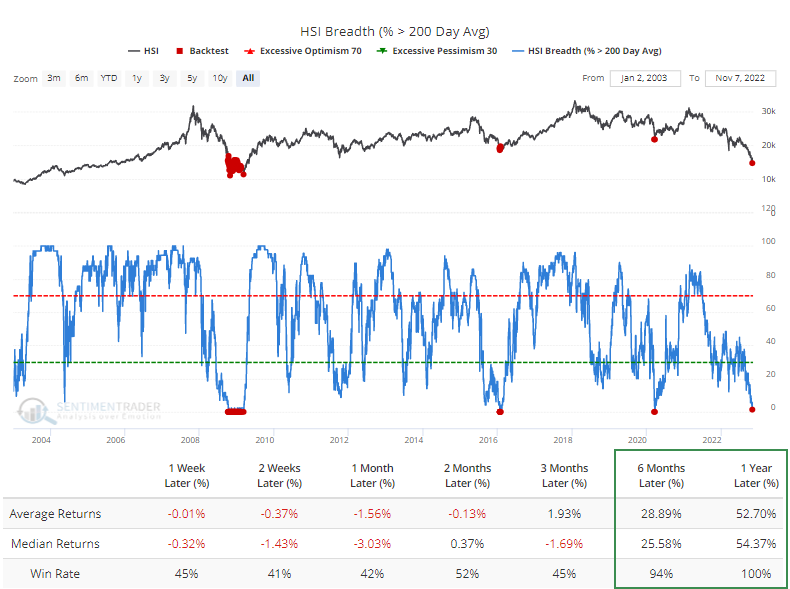
The post-CPI buying surge pushed more than half of stocks into uptrends
Thanks to a better-than-expected CPI report on Thursday, investors wasted no time discounting an inflation peak. The panic buying sent several indexes up more than 5%, which led to an impressive recovery in breadth-based indicators.
Dean showed that one such indicator, the percentage of S&P 500 members above their 200-day average, increased above 50%. The recovery in long-term uptrends occurred after fewer than 12% of members traded above their average as recently as late September.
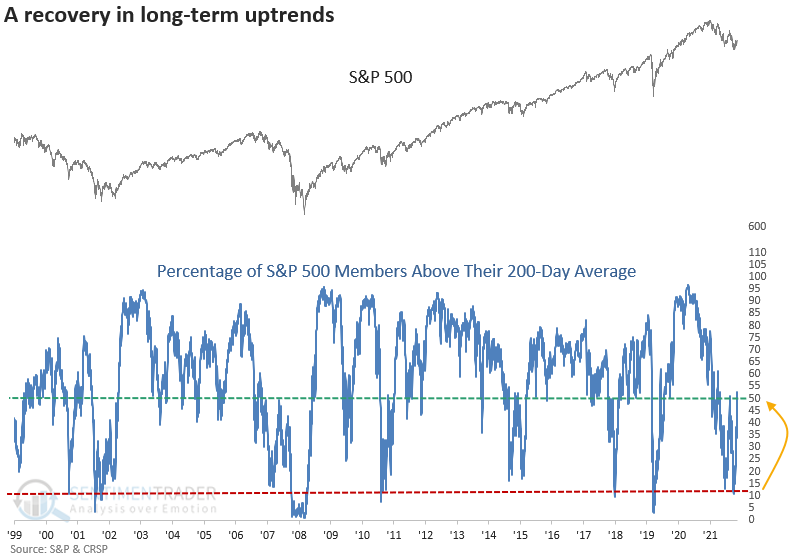
When the percentage of S&P 500 members above their 200-day average cycles from < 12% to > 50%, large-cap stocks show solid results on a long-term basis. However, we need to be mindful of a handful of notable failures post the 1929-42 period, like 1969, 1973, 1982, and 2001. The signals occurred in bear markets that were accompanied by a recession.
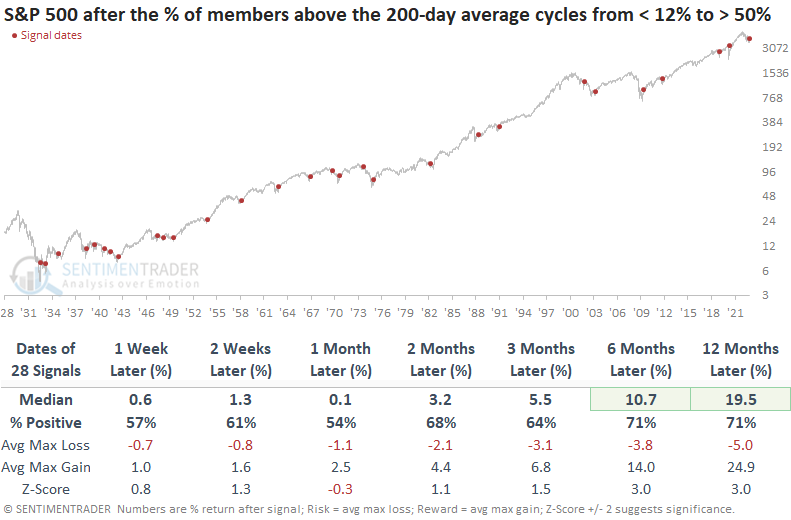
Value-based sectors are leading the recovery in long-term uptrends, which is rare. When Energy, Industrials, and Financials had more than 60% of their respective members above the 200-day average with fewer than 53% for the S&P 500, returns were positive every time two months later, but mixed after. The 2000-02 Dotcom bust continues pop up in breadth-based studies.
Using options to help with FOMO
The huge jump in stocks triggered some Fear Of Missing Out among investors, and Jay showed a way to help limit risk while still participating.
An option strategy that may help investors in this predicament is the out-of-the-money calendar spread, one possible alternative to using a bunch of cash to buy stocks and potentially suffer large losses.
An example Jay showed is:
- Buy the SPY Feb17 2023 455 call @ $1.76
- Sell the SPY Dec30 2022 455 call @ $0.30
The maximum dollar risk for a 1-lot is $146. Let's also say that the trader will commit roughly 2% ($1,000) of their capital to the trade. A 7-lot of the trade above would cost $1,022. The table and chart below display this trade's particulars and risk curves.
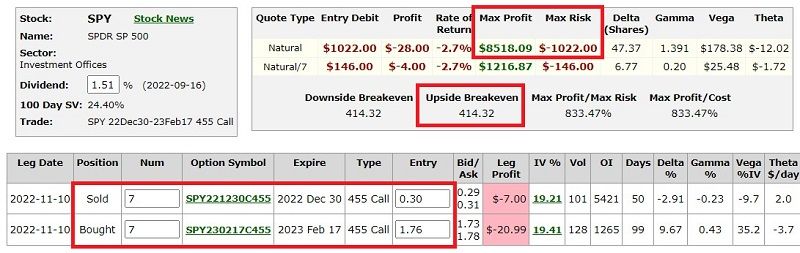
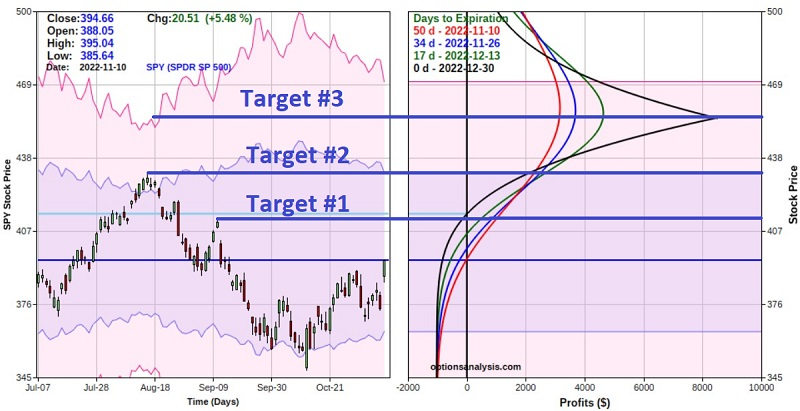
The $1,022 cost to enter a 7-lot is also the maximum risk on the trade. If SPY declines instead of advances, the worst case is -$1,022, or roughly -2% for our hypothetical $50K investor.
The S&P 500 must advance between now and year-end for this trade to show a profit and the expected break-even price at expiration is $414.32, or roughly 5% above the current price for SPY.
An important sector breakout
On Monday, the Investment Banking & Brokerage Sub-Industry closed at a new 126-day but not a 252-day high. Dean noted that the breakout is an interesting development for an industry that suffers in volatile periods like now, as deal flow across the capital markets tends to slow.
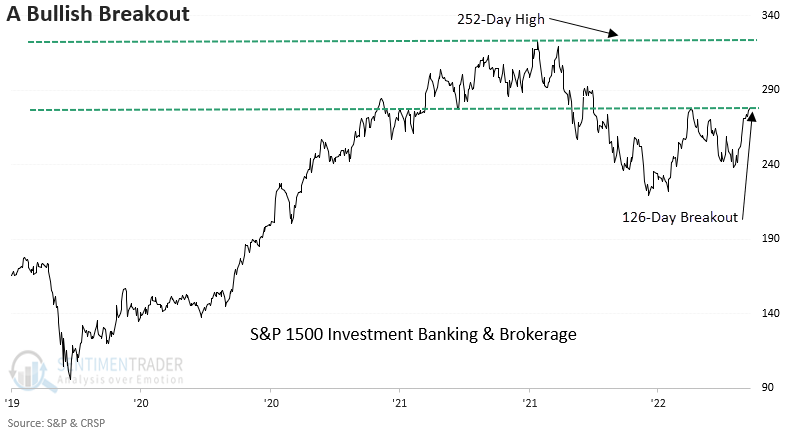
When the Investment Banking and Brokerage Sub-Industry Group closes at a 126-day high but not a 252-day high, the bullish price pattern tends to foreshadow positive returns across all time frames. The signal shows 31 out of 35 winners at some point in the first two months.
While long-term results are solid, a handful of significant drawdowns are worth noting, especially in 1973 and 2002.
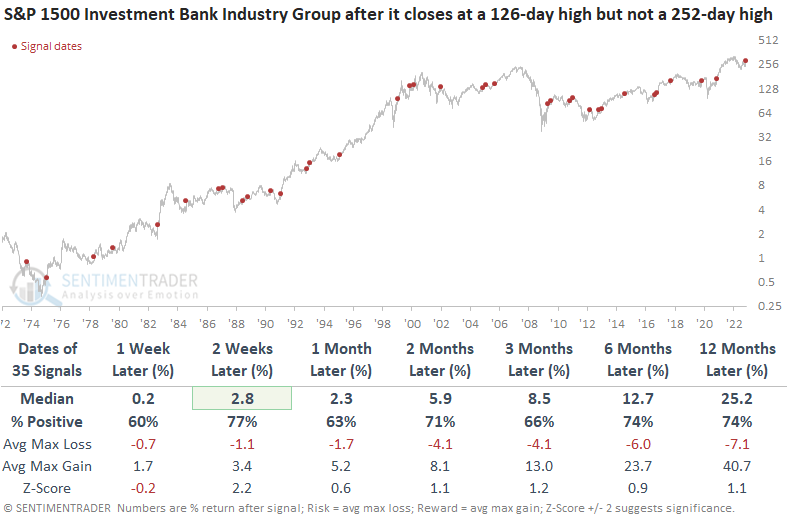
Returns, win rates, and z-scores look even better when I apply the signals to the S&P 500. So, what's good for a component within financials is good for the broad market.
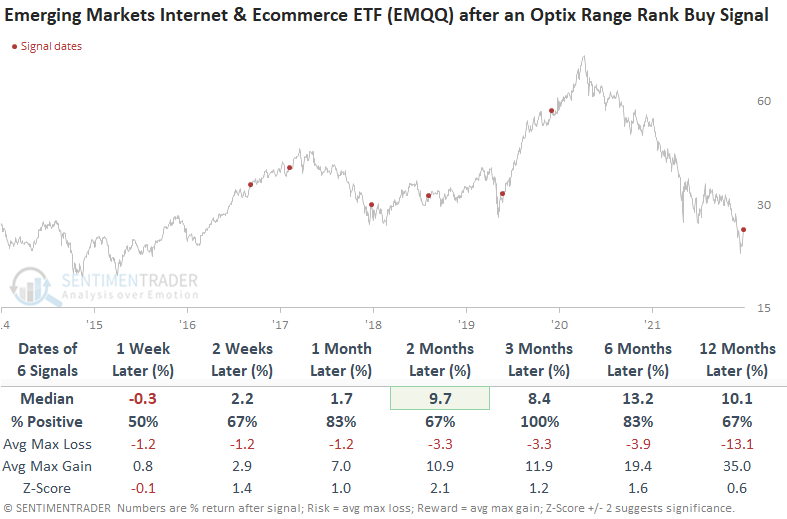
Emerging market internet stocks are seeing rebounding sentiment
Dean also noted that internet and e-commerce stocks have been some of the hardest hit issues in the current global bear market. He created a trading model for the SentimenTrader Optimism Index to take advantage of bearish to bullish sentiment reversals.
The model applies an 84-day range rank to the 10-day moving average of the Optimism Index for the EMQQ ETF. A new buy signal triggers when the range rank exceeds the 73rd percentile and ETF momentum turns positive.
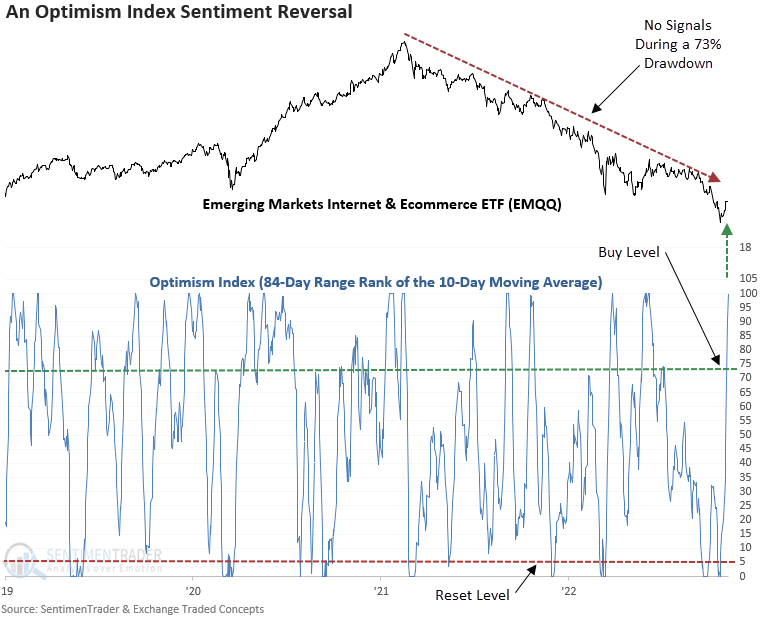
The EMQQ ETF is a relatively new security. So, the sample size is small. While the model has enjoyed the benefit of mostly bull market environments, it did an excellent job of avoiding whipsaw alerts during bear markets.
Growth stocks have plunged relative to Value
Thanks to a jump in interest rates, investors have fled from pretty much anything growth-related and shifted to companies making "things" and throwing off cash.
The ratio of the total return in the Growth factor versus Value has therefore plunged over the past year. It's one of the most dramatic shifts in investor preferences in 30 years.
There have been a handful of larger one-year shifts since 1928, but a 20% decline between the factors is historically significant. It's chilling to note that the only other time in 80 years when the rate of change cycled from above +40% to below -20% was in December 2000, as the internet bubble got pricked.
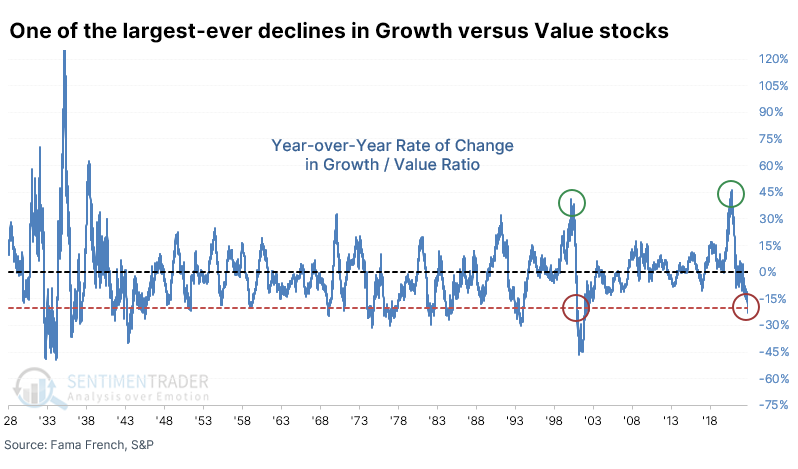
That 2000 precedent preceded some nasty months for the most benchmarked index in the world. But other times when the Growth / Value Ratio fell 20% or more for the first time in a year did not necessarily lead to similar outcomes. It led to terrible returns in 1941, 1969, and 1974, but that's about it.
More tellingly, dramatic declines in the ratio were not effective contrary signals.
When a drastic shift in preferences hit Growth stocks, they tended to keep underperforming relative to Value. Over the next three months, the ratio increased only 3 times out of 15 attempts, and the underperformance was significant. Over the next year, the ratio declined by nearly 10% on average.
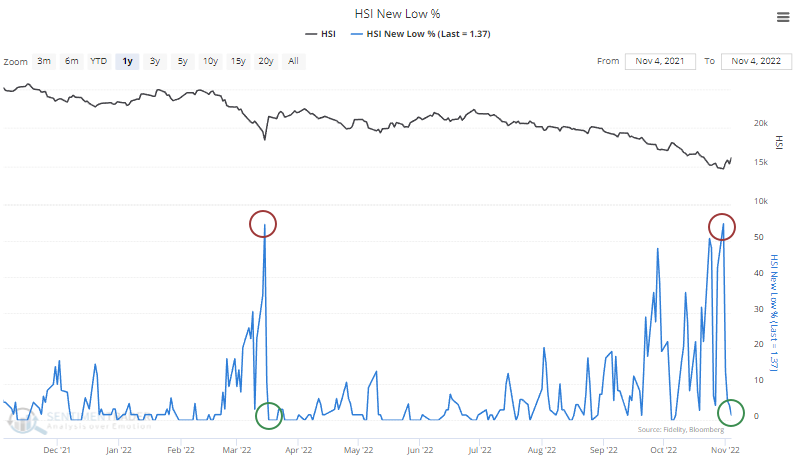
In Hong Kong, a major reversal in breadth
Asian stocks suffered a historic bout of selling pressure at the end of October, Now, bulls have to hope it's not a repeat of March.
Last week, more than half of the stocks in the Hang Seng index fell to a 52-week low. That was the most since the plunge in March and among only 22 other days in nearly 20 years. With the rally so far in November, the stocks recovered well, and new lows dropped to a minuscule amount.
When there was a cycle of more than half of stocks in the Hang Seng falling to a new low, then that dried up to almost nothing, the index tended to rebound. It was rocky, though; over the next couple of months, more than half the signals showed a negative return, and the last instance was a complete failure. But over the next year, there were only two losses, one of which was insignificant and erased in the months following.
The plunge in those stocks pushed nearly all of them below their 200-day moving averages. There have only been a handful of days matching this level of coordinated selling pressure. Short-term returns were poor, according to the Backtest Engine, but six months later, losses were rare. A year later, there were none, and the Hang Seng averaged a return of about 54%.
The long-term McClellan Summation Index has turned up from one of its most oversold levels, thanks to the severe selling heading into last week and then the explosive rally. The only two periods with similar behavior were October 2008 and September 2015. Neither one was an impressive buy signal, but over the next 1-2 years, the maximum gains far outweighed the maximum losses.
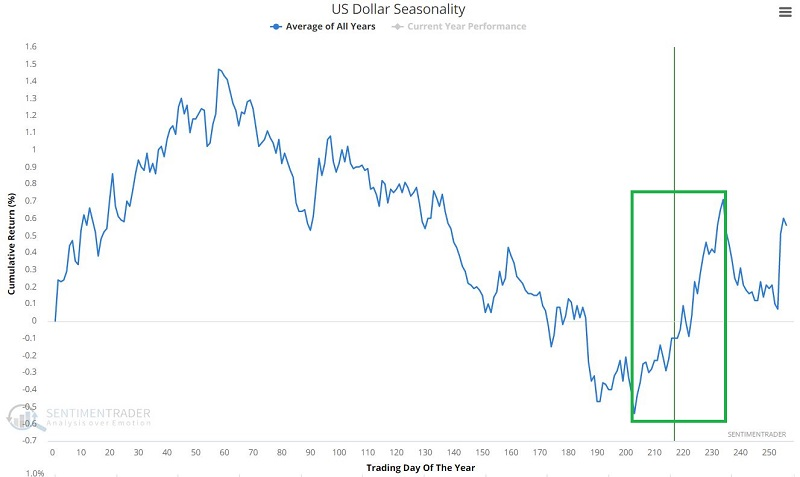
The dollar has a seasonal tailwind, but stronger headwinds
The price trend for the U.S. Dollar remains favorable and seasonality is also favorable but Jay showed that sentiment just flashed an important warning and several other little-known indicators recently flashed longer-term warnings for the Dollar.
The chart of Invesco DB U.S. Dollar Index Bullish Fund (UUP) shows that the powerful uptrend for the U.S. Dollar remains intact, with price well above a rising 200-day moving average. Seasonality is confirming this favorable trend. The annual seasonal tendency for the Dollar is now in a favorable period.
While those are worth considering, dollar bulls should note that our Optimism Index (Optix) indicator recently flashed an important warning regarding the Dollar in the year ahead. The chart and table below highlight those times when the 50-day Dollar Optix dropped below 0.72.
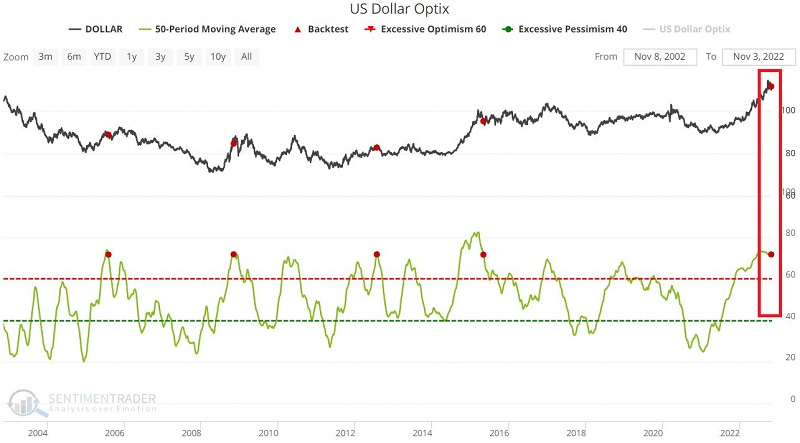
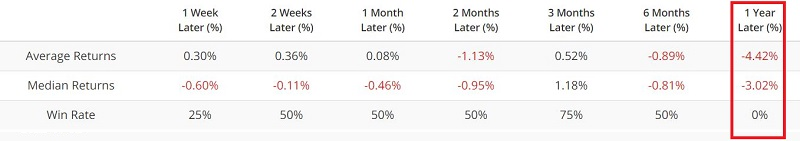
The sample size is small, but results during the six months after a signal are essentially a coin flip, while all four previous signals saw the Dollar lower 12 months later.
Options traders have been betting on big moves in currencies like the British Pound, where the risk reversal recently reached an extreme. The chart below displays those rare occasions when the British Pound risk reversal crossed below -3.2 for the first time in six months and the subsequent performance of the U.S. Dollar.
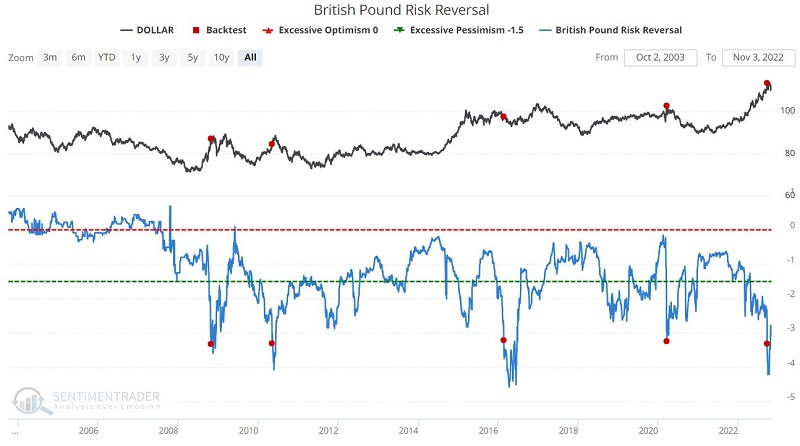
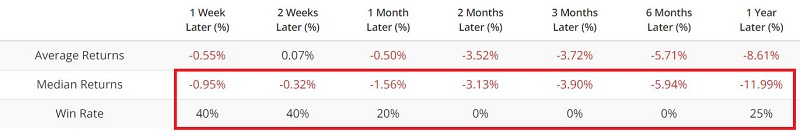
We can see similar behavior among traders in Canadian dollar options. Once again, the caveat regarding the small sample size applies. Nevertheless, the results following previous signals have been overwhelmingly unfavorable for the Dollar.
About TradingEdge Weekly...
The goal of TradingEdge Weekly is to summarize some of the research published to SentimenTrader over the past week. Sometimes there is a lot to digest and this summary is meant to highlight the highest conviction or most compelling ideas we discussed. This is NOT the full research that's published, rather it pulls out some of the most relevant parts. It includes links to the published research for convenience; if you don't subscribe to those products it will present the options for access.