
TradingEdge Weekly for Nov 1 - Continuation signals, November seasonals, copper/gold messages

Key points:
- Breadth was negative for a week but didn't have much impact
- Some continuation signals for stocks are firing
- November is ahead, and stocks tend to do well
- The VIX, however, does not
- There has been a buying strike in India's Nifty 50 stocks
- The 10-year yield has risen rapidly despite being in a rate-cut cycle
- The copper/gold ratio plunged to another multi-year low
- There are some mixed signals for gold
- Bullish indications are triggering for bitcoin
Most stocks are falling but not having much impact
Each trading session over the last week saw more S&P 500 stocks fall than rise. Dean showed that similar breadth conditions near a high tended to precede a multi-week consolidation.
Stocks demonstrated resilience by ignoring the typically weak seasonal periods of August and September. However, last week's market breadth was poor, as the number of declining stocks in the S&P 500 exceeded advancing issues in each trading session.
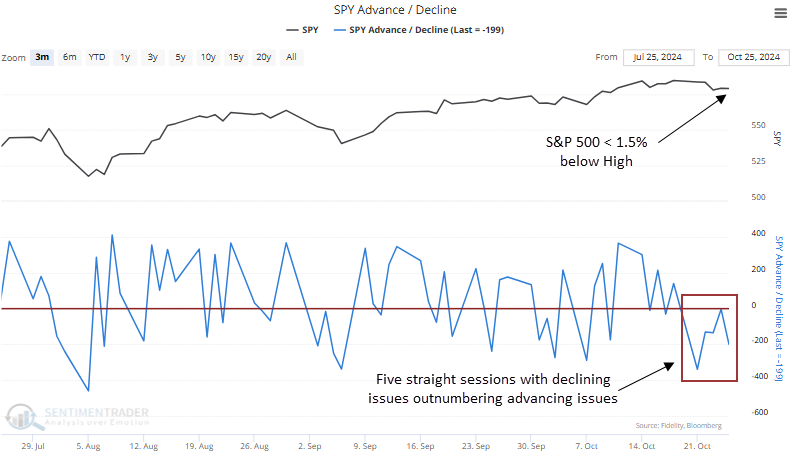
Whenever declining issues for the S&P 500 exceeded advancing issues for five straight sessions, with the index hovering less than 1.5% below a 5-year high, the world's most benchmarked index tended to undergo a multi-week consolidation. At some point over this time frame, the index displayed a loss in 15 out of 19 instances.
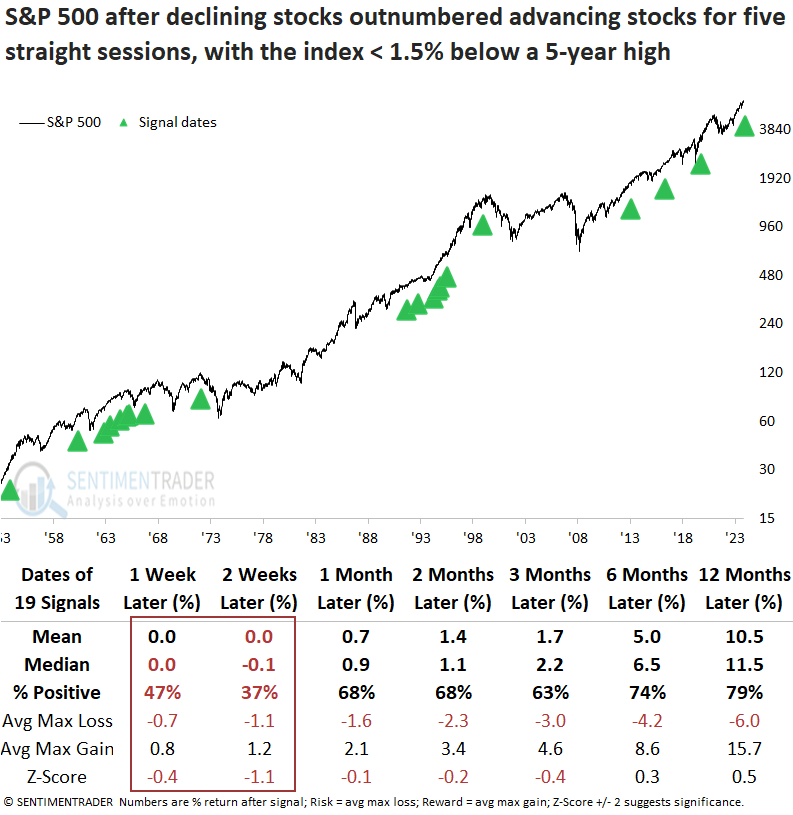
Over the subsequent six months, the S&P 500 sustained just two instances of a maximum loss exceeding 10%, a threshold that has not been breached since before 1973.
As illustrated in the table below, today's trading session marks the last day of a seasonally weak period ahead of the presidential election. If you're seeking an explanation for last week's negative breadth, the typical jitters associated with pre-election periods might be the cause.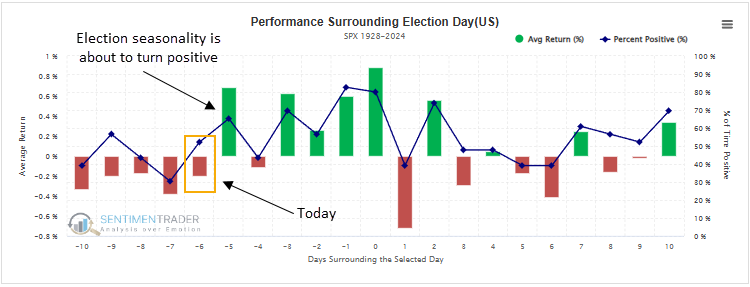
Some more continuation signals
Jay noted that a variety of indicators have flashed continuation signals recently.
Bullish insider activity was everywhere, while the stock market bottomed out in 2022. Since then, insider activity has cooled off as the stock market continues to hit new highs.
Regarding the 100 constituent stocks comprising the Nasdaq 100 Index (NDX), buying and selling have been on the low side recently. At first blush, there does not appear to be much valuable information to glean from this, but it has historically preceded gains for that index.
Jay also showed that the IPO / S&P 500 Relative Ratio Rank indicator compares the performance of an IPO (Initial Public Offerings) Index to the performance of the S&P 500 Index. The indicator shows where the ratio is relative to its range over the past four months. When the relative ratio is high, investors are showing risk-on behavior.
The chart below highlights all dates when the indicator crossed above 99 for the first time in one month while the Invesco QQQ Trust (QQQ) was above its 200-day moving average. The most recent signal occurred on 2024-10-22.
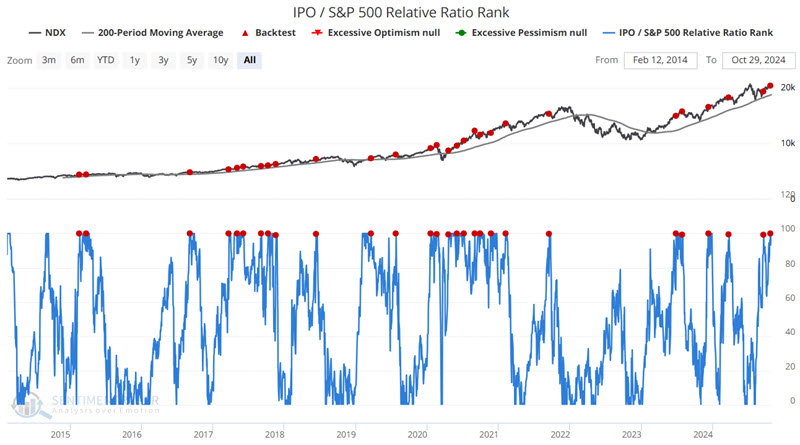
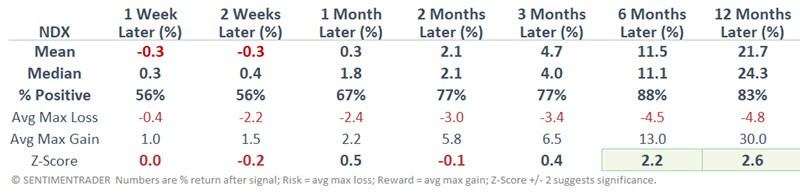
Overall, this signal has been useful in helping to identify additional buying opportunities in an ongoing bull market.
November ahead
Jay showed that November through April tends to be favorable for stocks, more often than not, even when there's election uncertainty.
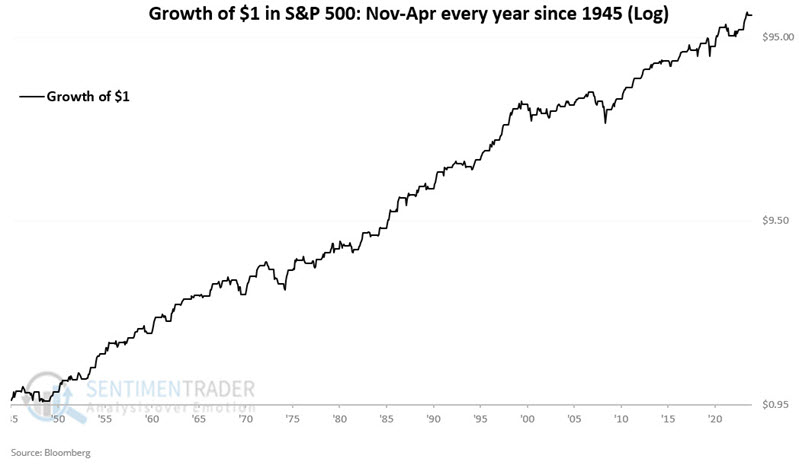
The legendary Yale Hirsch, founder of the Stock Traders Almanac, first popularized the "Best Six Months of the Year" phenomenon, which purportedly extends from the close of October 31st each year through the close of April 30th of the following year. We will analyze the performance of the S&P 500 Index during the post-WWII era, i.e., starting in late 1945.
The chart below displays the hypothetical growth of $1 in the S&P 500 only during November through April every year starting in 1945. $1 grew to $125.63.
Since this is 2024, let's look at the results if we bought the S&P 500 at the end of October only during years ending in "4" (1954, 1964, etc.). The chart below displays the hypothetical growth of $1 in the S&P 500 only during November through April every year starting in 1945. $1 grew to $1.86.
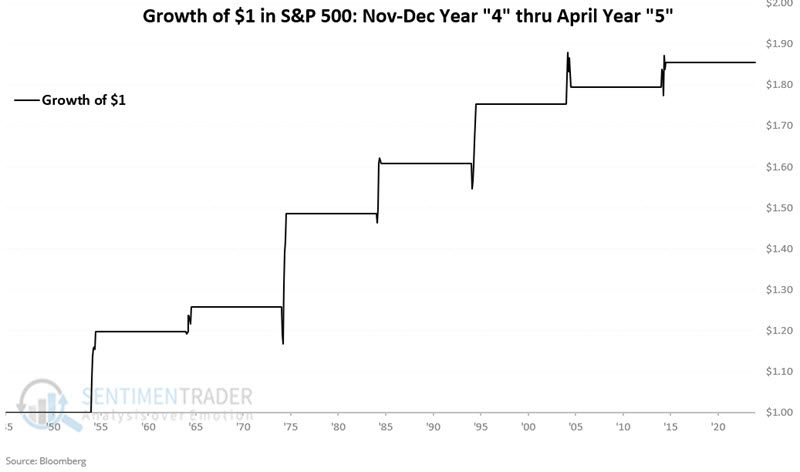
While the overall return doesn't sound like much, there were only seven periods. All seven showed a gain, averaging +9.4%.
Now let's look solely at the Presidential Election years. The chart below displays the hypothetical growth of $1 in the S&P 500 only during November through April if November involves a U.S. presidential election. $1 grew to $2.07.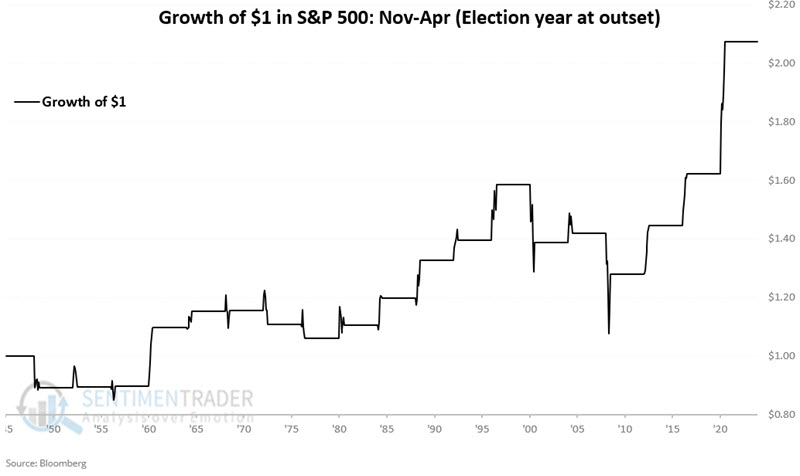
These stretches rallied 74% of the time, with two gains larger than +15% and no losses larger than -15%.
How about the VIX?
Jay further noted that November has a history of being a bullish month for stocks, and a decrease in options volatility often accompanies this.
He previously highlighted the tendency for the VIX Index to rise during October of election years. October 2024 held to form. So, how does volatility behave during November? The chart below shows the hypothetical fluctuations of the VIX Index (using $1.00 as a baseline starting point) during October since 1986.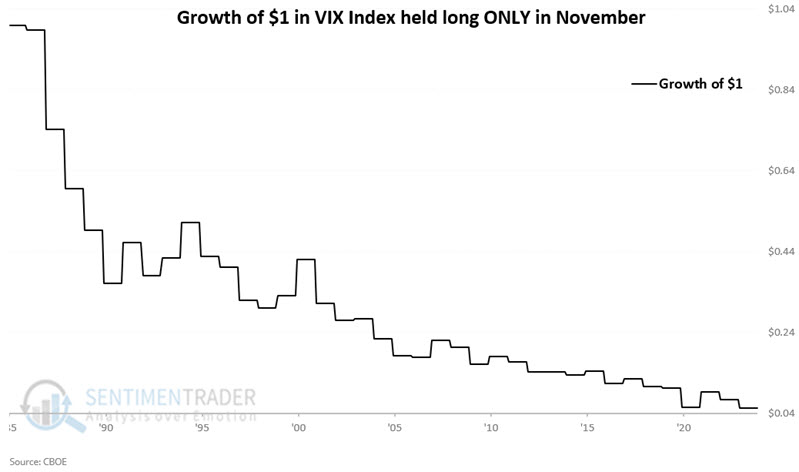
Now, let's consider VIX's November performance during the presidential election years. The chart below shows the hypothetical fluctuations of the VIX Index (using $1.00 as a baseline starting point) during the month of November since 1986, only during presidential election years (i.e., only 1988, 1992, 1996, etc. are considered).
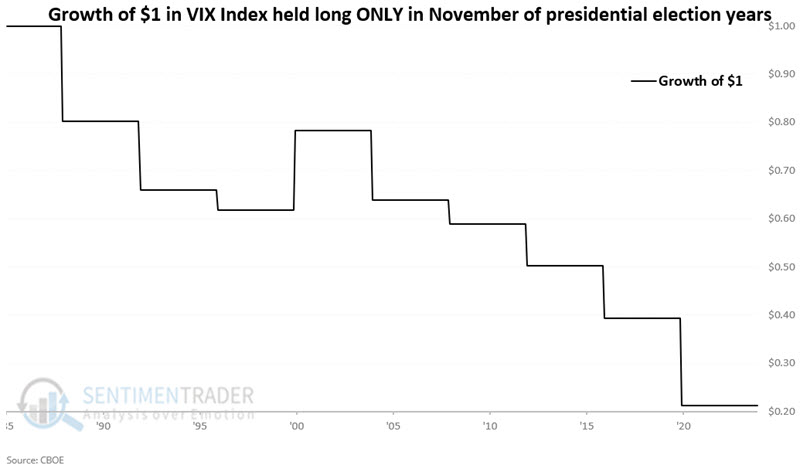
The gauge rose only 11% of the time, with its sole rally being more than +15%. It declined eight times, with five of those being more than -15%.
Buyers on the Nifty have been thrifty
For a while, Indian stocks were all the rage. But, like most things, gravity eventually catches up to some degree. Selling over the last couple of weeks in the 50 largest companies on the National Stock Exchange has been relatively severe.
Over the past two weeks, about 11 more stocks have declined than rallied on an average day, the 2nd-most severe selling pressure in four years.
That other instance, in May 2022, nearly marked the low for the Nifty. It was also a somewhat different context since the index was trading below its 200-day moving average at the time, while it's still above that long-term trendline now. Over the past 25 years, there have only been a handful of days with such severe multi-week selling during long-term uptrends. Each saw the Nifty 50 resume its rally over the next 2-3 months.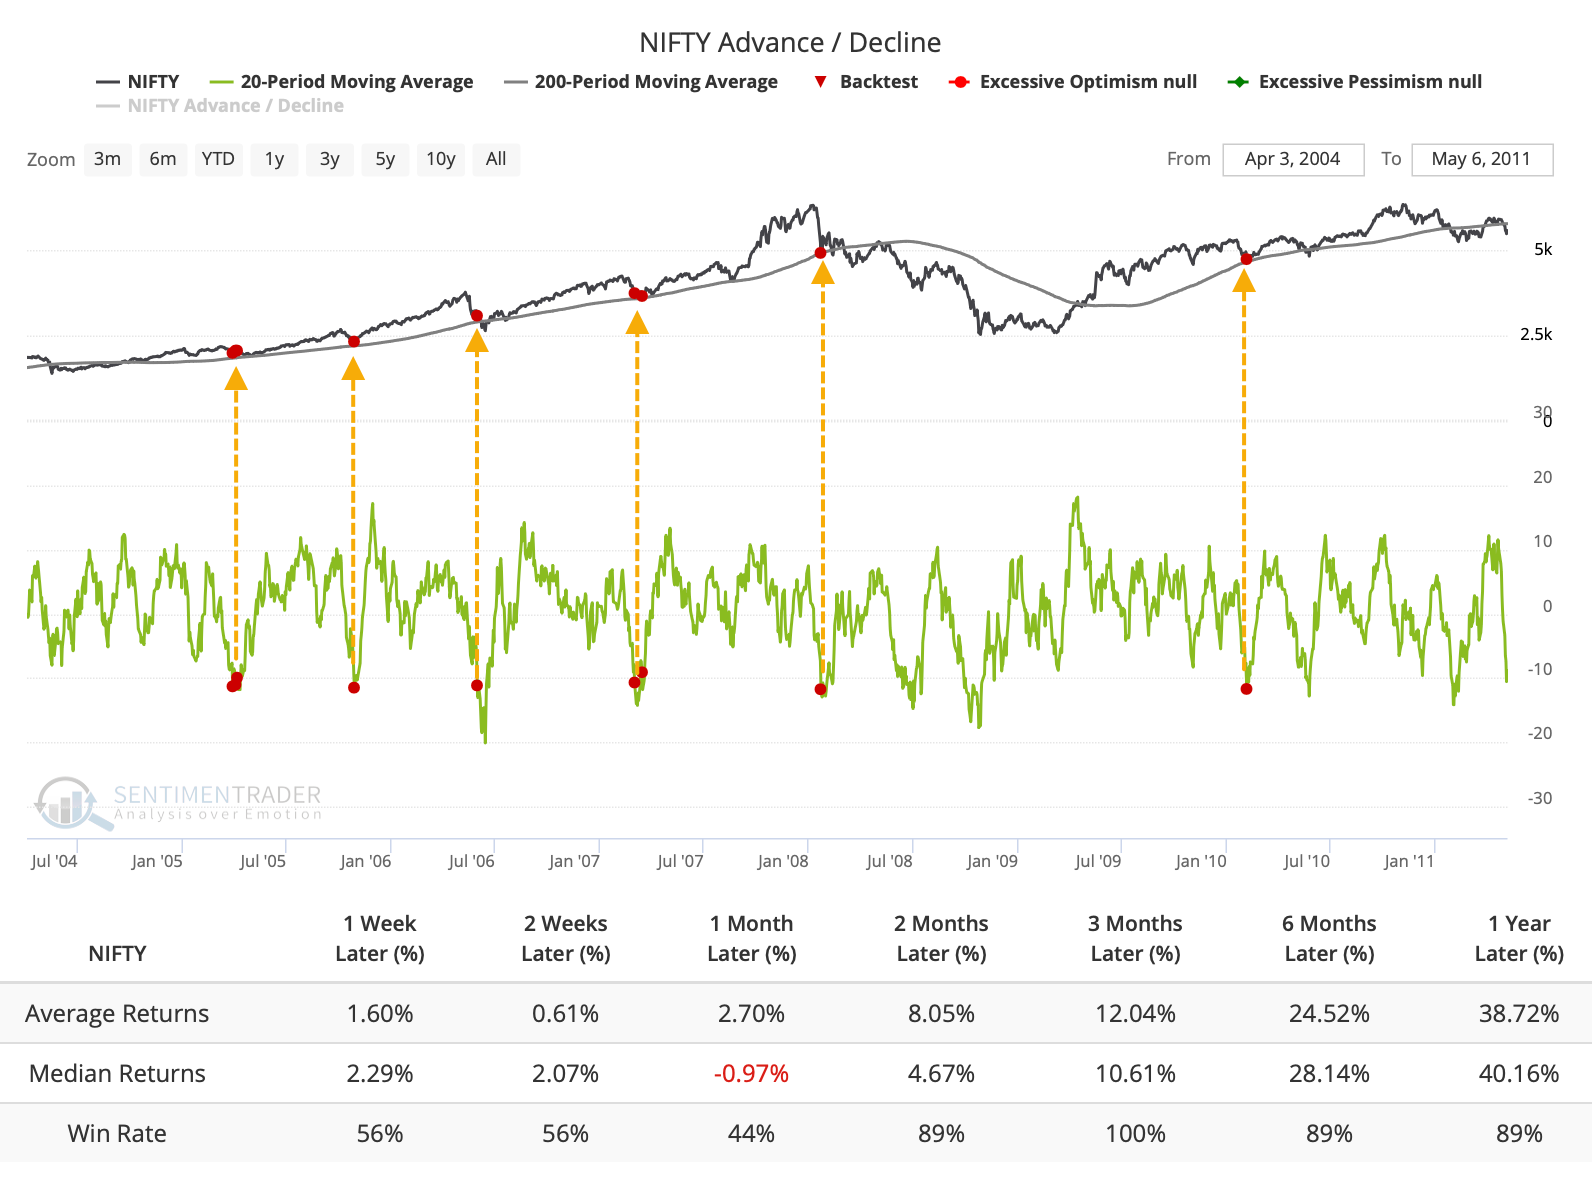
The selling pressure has caused the long-term McClellan Summation Index for the Nifty to decline to +1,000 for only the third time since it began its post-pandemic run. The other two marked the best risk/reward opportunities for investors during this stretch.
We like to get context by looking at cycles in indicators, when they travel from one threshold to another. The Nifty's Summation Index had enough momentum to exceed +2,500 before returning to neutral territory. Similar cycles preceded further gains almost without exception.
The jump in breadth indicators showing widespread and severe selling pressure has caused the Panic Breadth Composite to spike to 45 from what had recently been under 5. The last 11 times it cycled like this, the Nifty rallied over the next month. All 15 signals sported a positive return either one or three months later.
This would be a good time of the year for the index to rally. Over the past 30 years, the Nifty 50 has done well in November and (especially) December, with the latter being the most consistently positive month with by far the best average return.
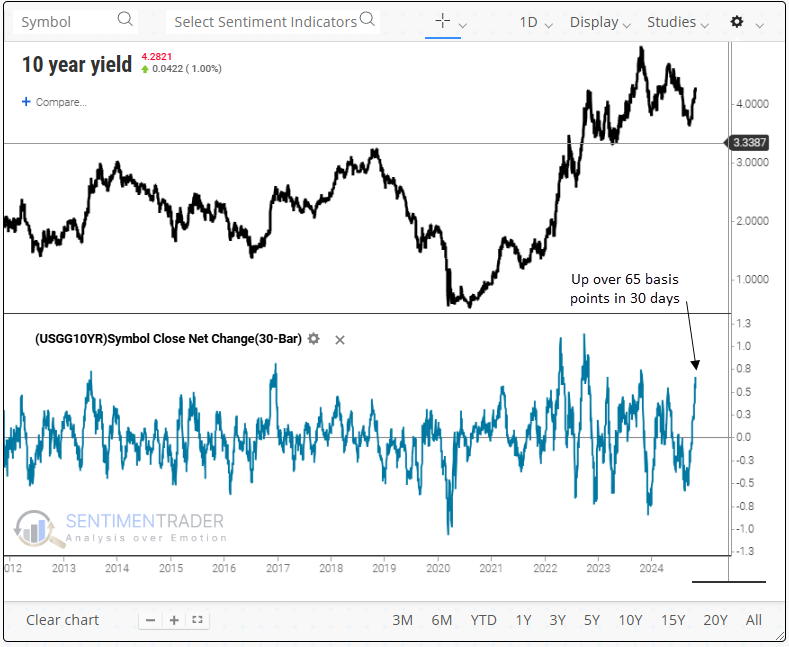
Rapid rise in yields
The 10-year Treasury yield has risen more than 65 basis points over 30 days. Dean noted that similar surges with the Fed easing policy suggest the 10-year yield could decline in the near term.
Over a rolling 30-day period, the 10-year Treasury yield has climbed over 65 basis points, a magnitude of change exceeded in only 4% of trading days since 1962. Although a 65 bps increase over 30 days has occurred 47 other times when using a reset below zero to eliminate repeats, none took place in tandem with the Federal Reserve's initial rate cut until now.
Whenever the 10-year Treasury yield rose by 65 basis points over 30 days, coupled with a Fed easing cycle featuring one to three rate cuts, the benchmark yield often decreased over the following months. From three to twelve months later, yields dropped in the 1980s, whereas post-1995, they tended to increase.
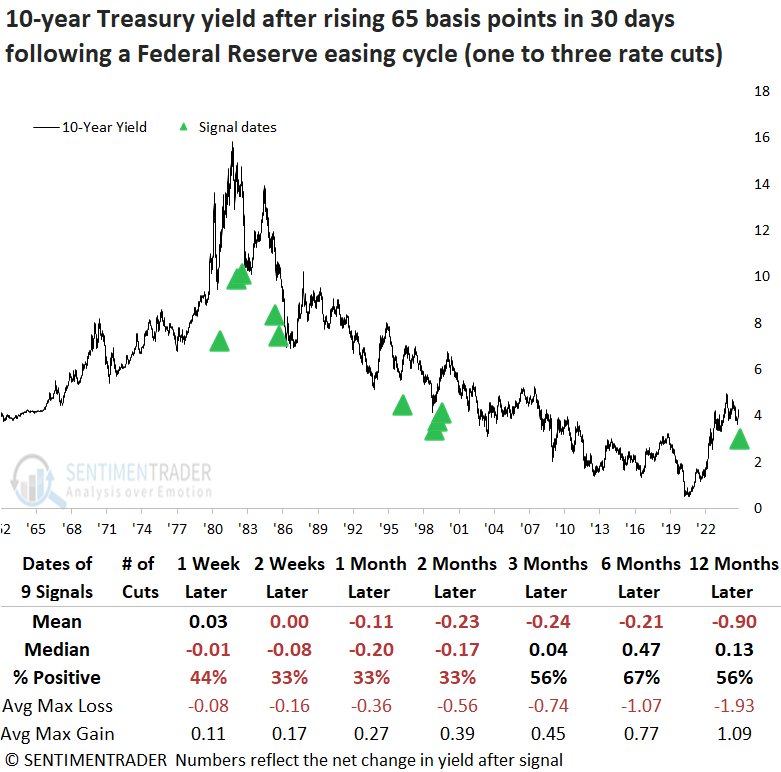 Except for an untimely signal in 1981, which occurred within the context of a bear market, a scenario unlike today, the S&P 500 rallied consistently across all time frames, culminating in a 100% win rate over the next year.
The market's ability to absorb a sudden and sharp rise in rates suggests that economic fundamentals were healthy during these periods, providing a positive backdrop for equities. Consistent with their defensive nature, sectors such as Staples, Health Care, and Utilities lagged the S&P 500 over the initial six months. A year later, most sectors, particularly technology, achieved robust returns.
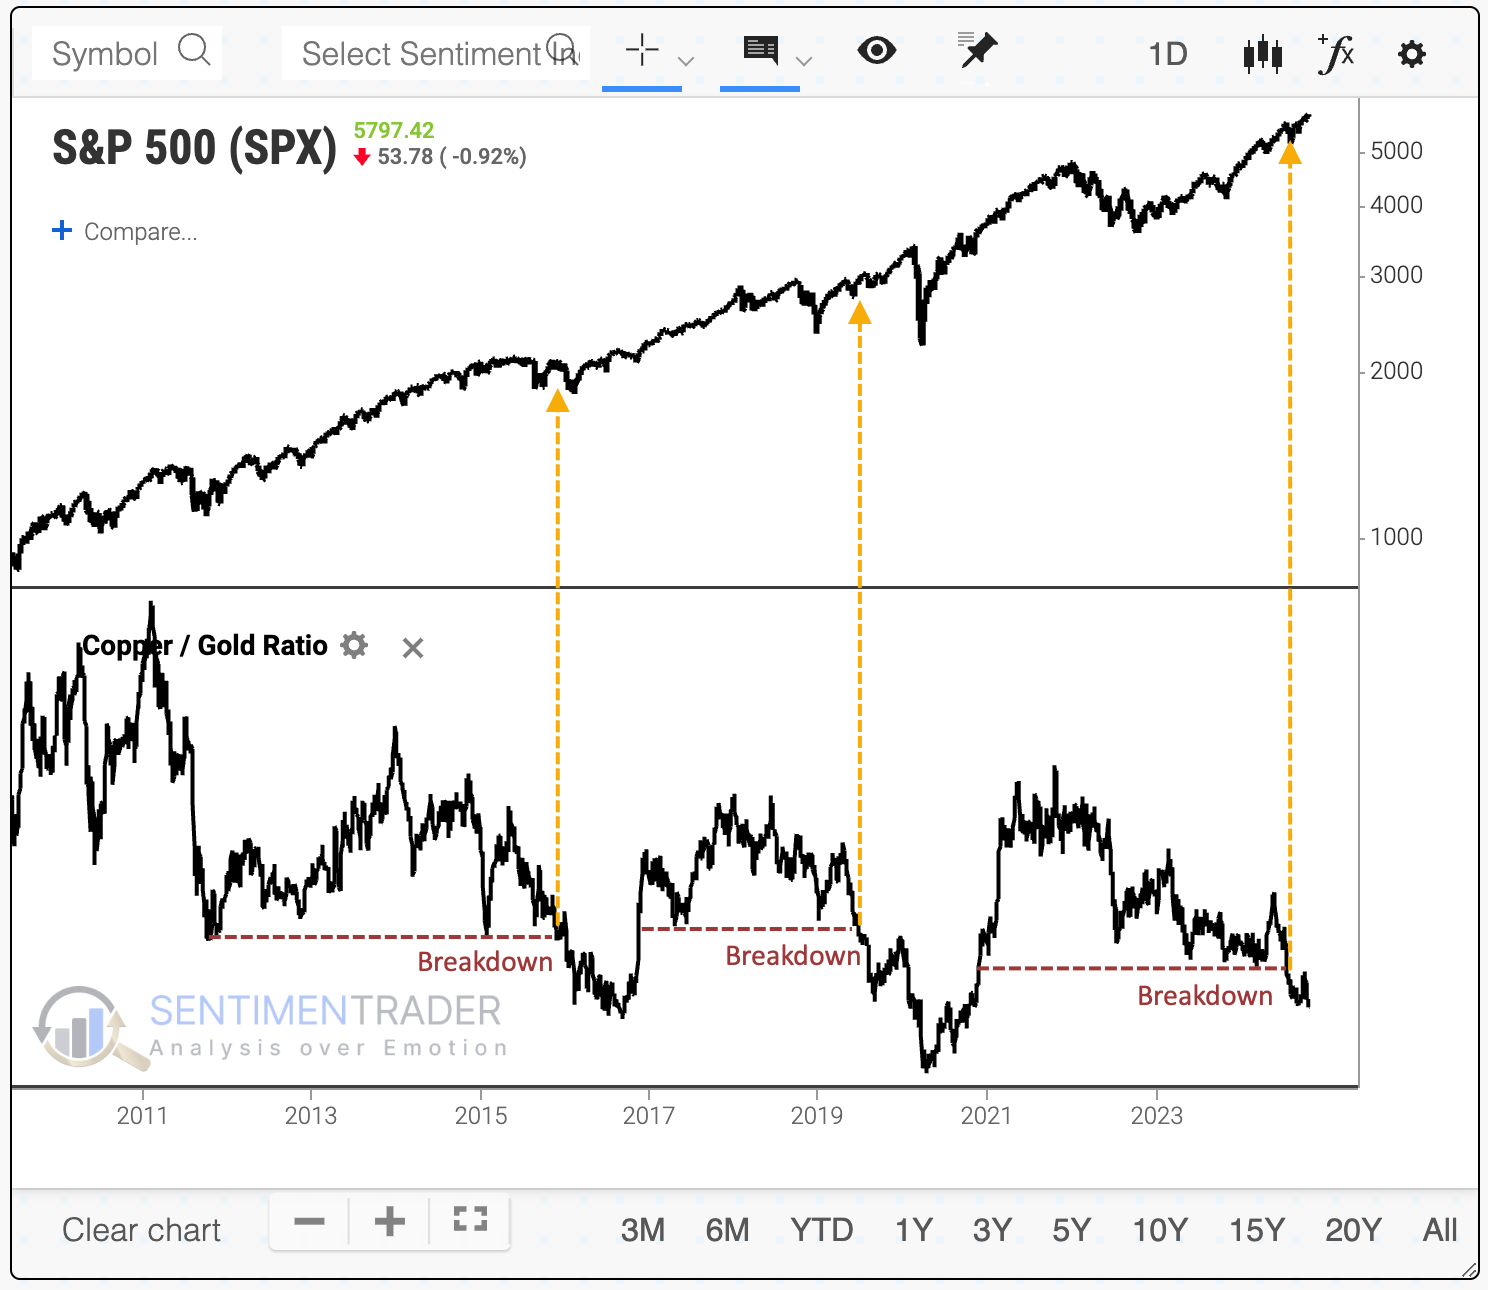
The copper/gold ratio has been most effective for copper
Market analysts love to look at intermarket relationships.
We're seeing more attention now on the interplay between copper and gold since it just fell to another multi-year low. The theory is that copper represents economic activity while gold reflects some sort of safe haven. If the ratio of copper to gold falls, then it means that investors are anxious about poor economics.
The chart below shows that the last two times the copper/gold ratio broke down to a multi-year low, the S&P soared in the year(s) ahead, though the last one was interrupted by the pandemic. It would be a stretch to suggest that the plunging copper/gold ratio predicted that event.
Over the medium- to long-term, the S&P's returns were just fine, with only 3 losses out of 27 attempts over the following year, and none of those losses were significant.
A drop in the ratio to a multi-year low didn't lead to anything particularly consistent for the 10-year yield. It tended to dip over the next couple of weeks, then rise. Over the following year, yields rose 80% of the time by an average of 94 basis points, or about 1%.
For gold, these signals exhibited a modest tendency to rise in the months ahead, with its best performance over the next 6-12 months, when its average returns were well above any random time.
It was a better signal for copper. Over the next three months, that metal gained 89% of the time, with a healthy reward-to-risk ratio. While consistency declined over the next year, copper still rallied about three times out of four, and its average returns and risk/reward ratio were impressive.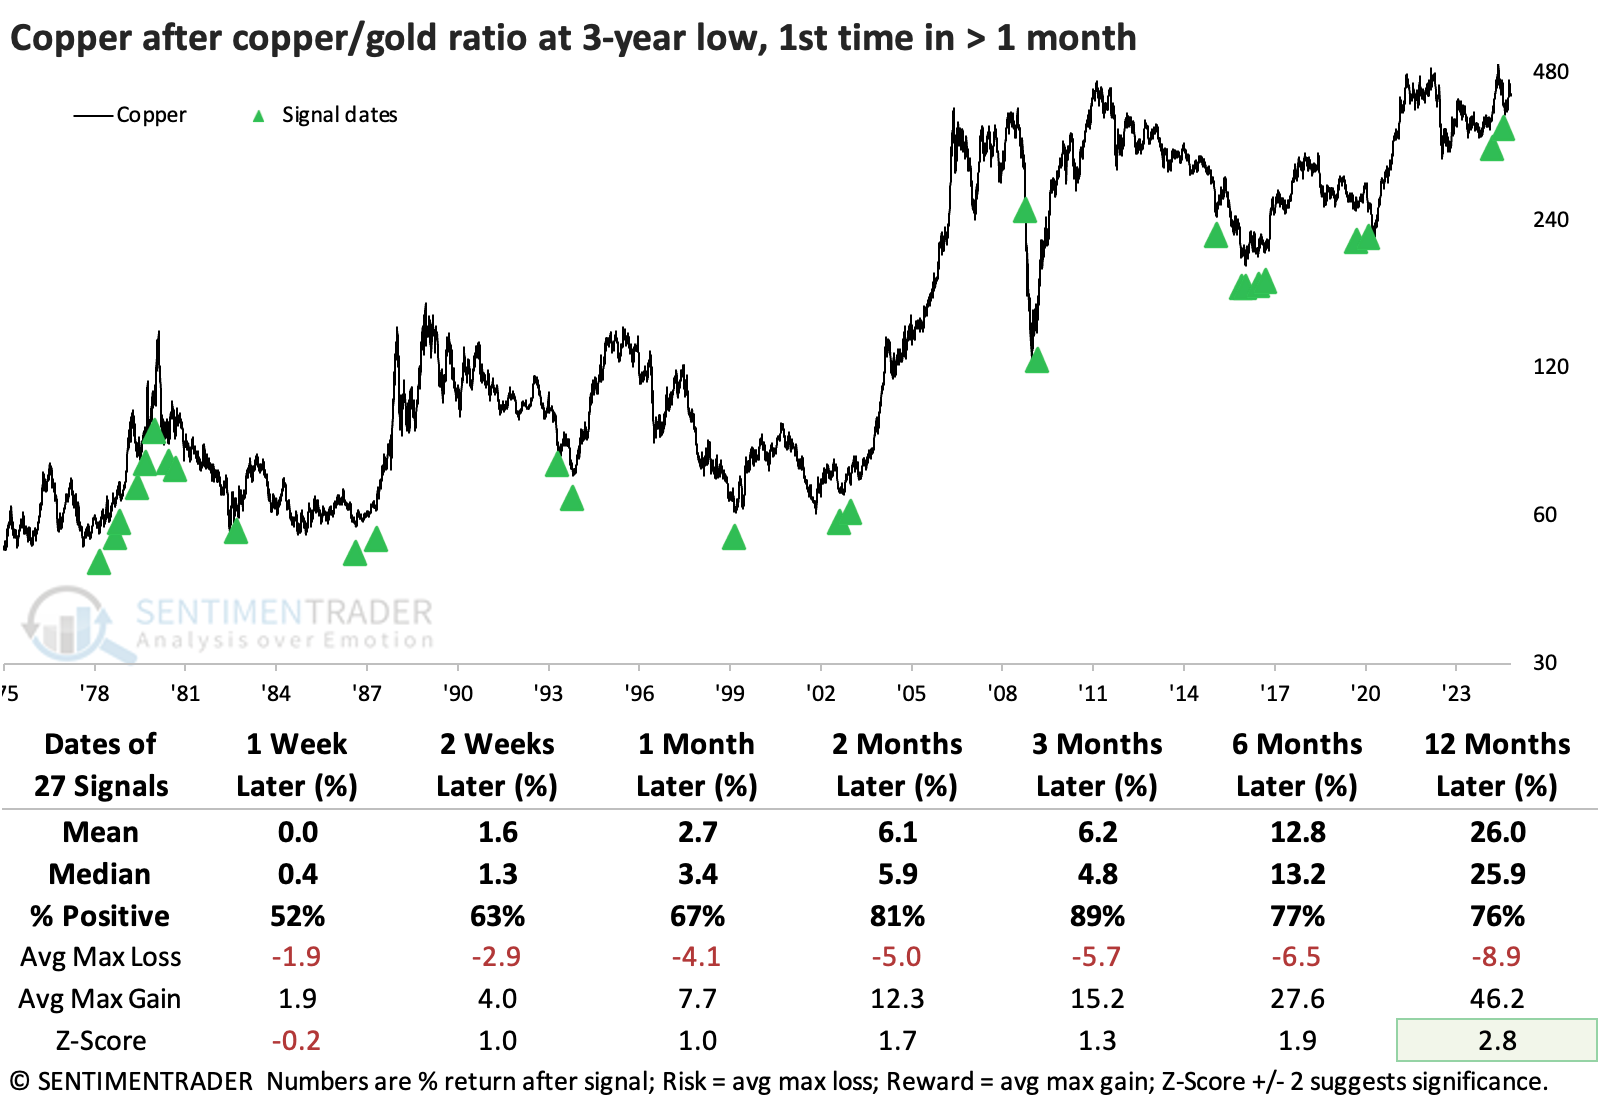
Mixed signals for gold
Jay suggested that for the first time in gold's recent advance, several shorter-term warning signs have appeared.
He showed a slightly longer-term look at the copper/gold ratio. When it was this persistently low over a long period, gold showed a strong tendency to rise over the longer-term.
However, It comes as no surprise that gold traders are becoming more bullish as gold rockets higher. Up until recently, sentiment remained in the "normal" range. But a longer-term view of our Gold Optix indicator finally flashed an overly bullish warning sign recently. The chart below highlights those dates when the 200-day moving average of our Gold Optix indicator crossed above 69%. The most recent signal occurred on 2024-10-24.
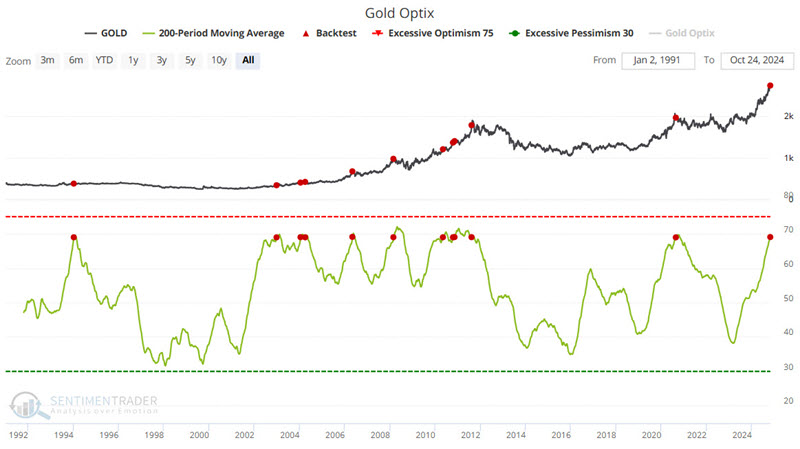
With commodity markets, it is very possible for something to go on a vertical tear and leave any and all worries in the dust. The potential for gold to go parabolic as it did in the late 1970s and early 1980s is real.
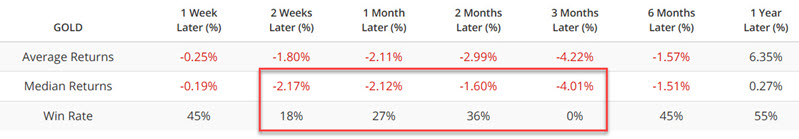
Our Correlation Pattern Match Tool is a new Basktest 2.0 tool. Jay asked the tool to look at the 2024-06-26 to 2024-10-22 period and find periods in the past that showed a correlation of 95% or higher. The goal is to see how gold performed following such periods in the past. Through three months after a period end date, gold's performance has been pretty dreadful. Most notably, 1-month showed a Win Rate of 22%, a Median Return of -2.4%, and a Z-Score of -4.7.
Talk about mixed signals. From a trend-following perspective, you can't ask for much more from gold. A powerful uptrend with confirmation from two reliable indicators can give a long-term investor the confidence to keep riding. As we saw just above, however, there is a high potential for at least a meaningful correction in the weeks or months ahead.
Bullish bitcoin
The RSI for Bitcoin shifted to a favorable position, triggering a buy signal for the cryptocurrency. Dean showed that when the RSI maintains a bull regime status, the cryptocurrency produces an annualized return of 1000%.
Bitcoin's high volatility makes it an ideal candidate for momentum trading. The Relative Strength Index (RSI) is particularly well-suited for detecting these momentum shifts, as it measures the speed and degree of price movements.
A simple trading system that uses the (RSI to identify bullish or bearish momentum regimes triggered a buy signal for Bitcoin when the RSI rose above 68. This bullish status will persist until the RSI dips below 37, at this point, the model shifts back to a bear regime.
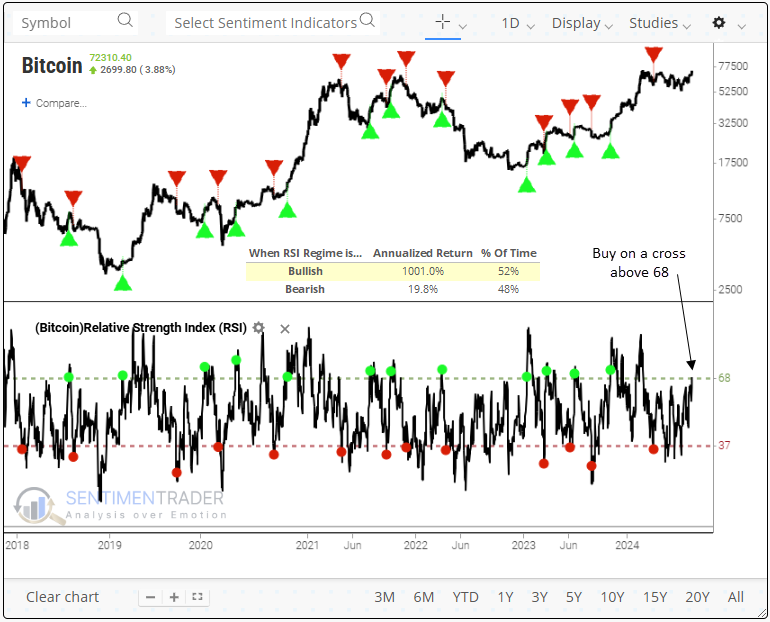
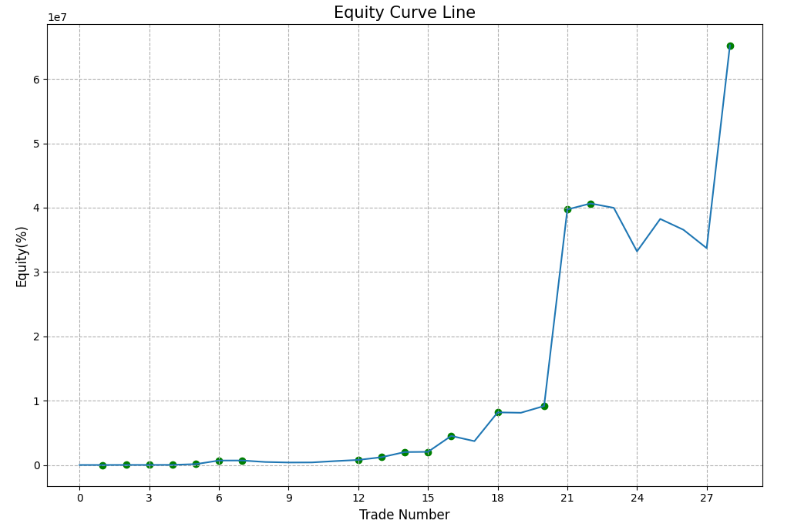
Since 2010, the RSI system has generated 28 bull regime signals with a 71% success rate, achieving an average gain of 184% per win, while losses averaged -12.5%. An equity curve visually represents how a system's signal has performed over time, helping to evaluate the model's effectiveness. As a guiding principle, it should progress steadily from the lower left to the upper right, which the Bitcoin RSI system has generally accomplished.
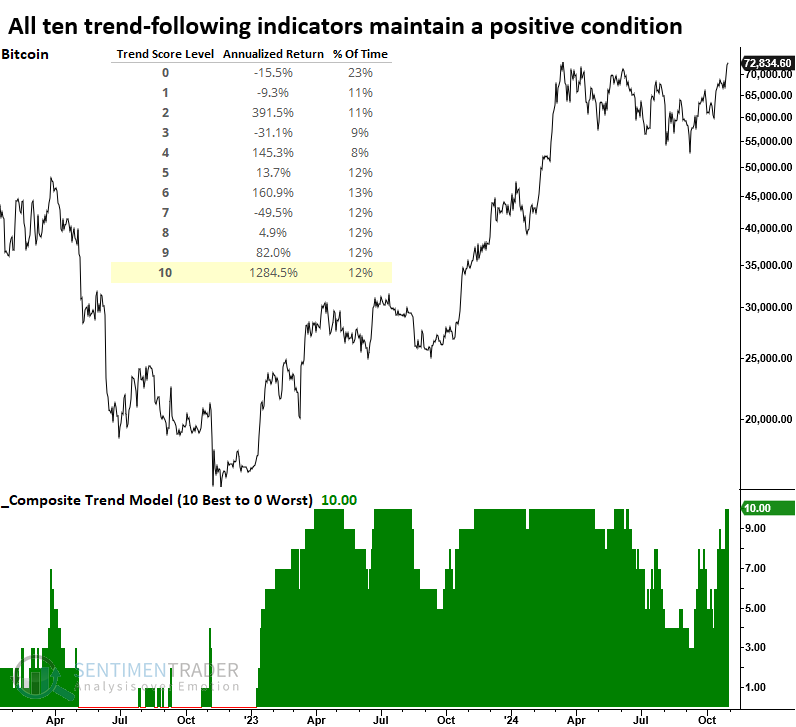
The composite trend model for Bitcoin has returned to a score of ten, indicating that all components maintain a positive status. Trend score readings of ten have yielded the highest annualized returns for digital currency, achieving a remarkable 1284% gain. We'll soon be rolling out the trend score indicators to additional assets, including Bitcoin, on the website.
Like stocks, Bitcoin is about to enter a seasonally advantageous period. Furthermore, November historically shows the highest average returns of any month.
About TradingEdge Weekly...
The goal of TradingEdge Weekly is to summarize some of the research published to SentimenTrader over the past week. Sometimes there is a lot to digest, and this summary highlights the highest conviction or most compelling ideas we discussed. This is NOT the published research; rather, it pulls out some of the most relevant parts. It includes links to the published research for convenience, and if you don't subscribe to those products, it will present the options for access.