
TradingEdge Weekly for May 6 - Heavy selling, extreme sentiment, dollar surge

Key points:
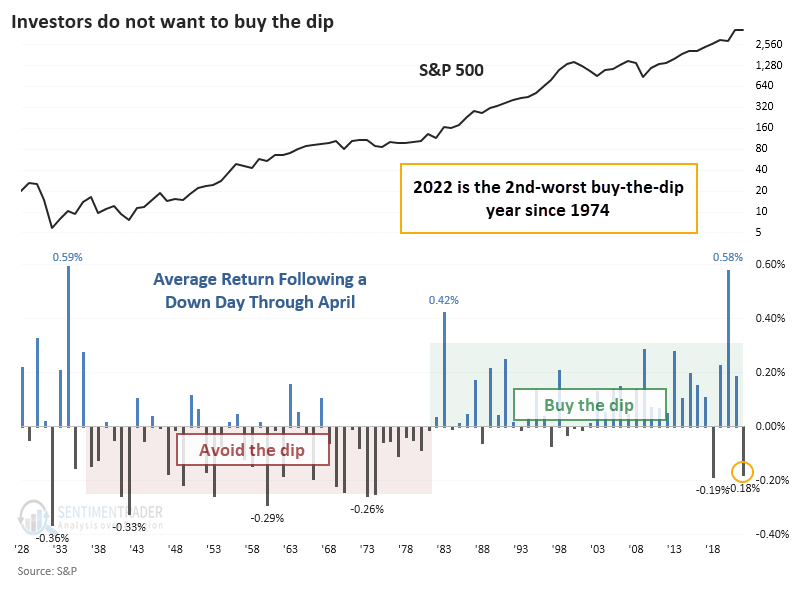
- Buy-the-dip activity in 2022 is among the worst on record as April showed historic losses in stocks
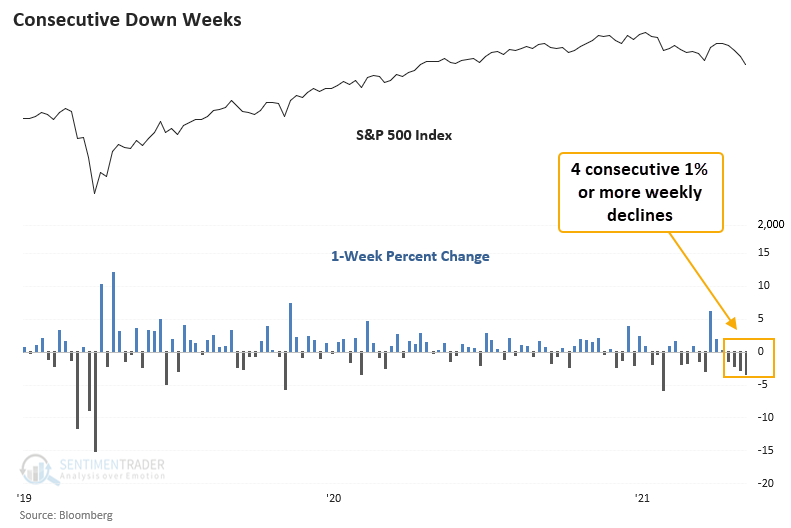
- That was thanks to 4 consecutive weeks of at least 1% losses
- There has been a cluster of heavy selling days, with no intervening days with overwhelming buying
- Seasonality is another headwind, with generally poor returns during the summers of mid-term election years
- At least sentiment has become stretched into the excessive pessimism zone
- Medium- and long-term uptrends in Financials are becoming hard to find
- Energy stocks are showing much better participation
- The dollar has surged, which has typically led to even more gains
- Silver may struggle with its seasonal trend
Buy-the-dip is dead
This has been one of the worst starts to a year ever for investors, and it's caused them to abandon BTFD (Buy The F**king Dip).
Bloomberg notes that the tendency of investors to step in after a down day is waning, and S&P 500 pullbacks are lasting longer. They're not wrong - the S&P 500 has returned an average of -0.18% after a down day through April. This is a remarkable change from the past 40 years, when investors greedily snapped up bargains after a down day.
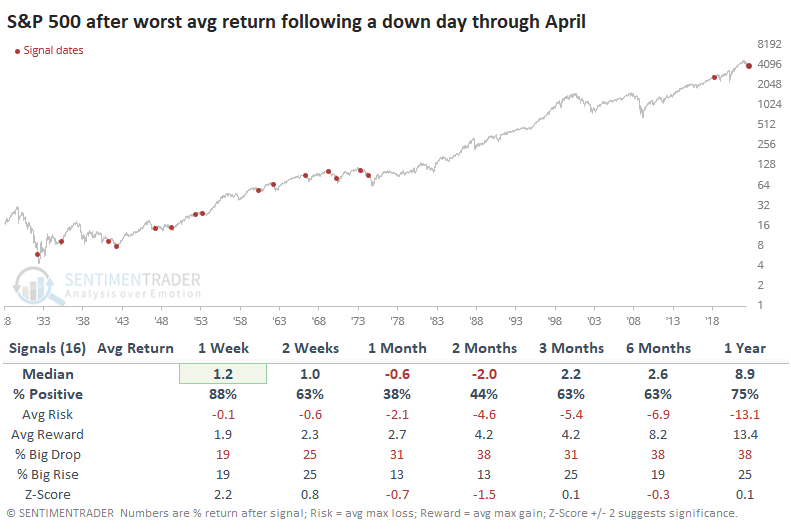
The avoidance of buy-the-dip was an excellent sign for contrarians four years ago; the S&P dipped a few more days into early May, then rose steadily through September. Historically, though, it wasn't a consistent buy signal. The "sell in May" phenomenon typically put a damper on rallies, and over the next one and two months, returns were poor.
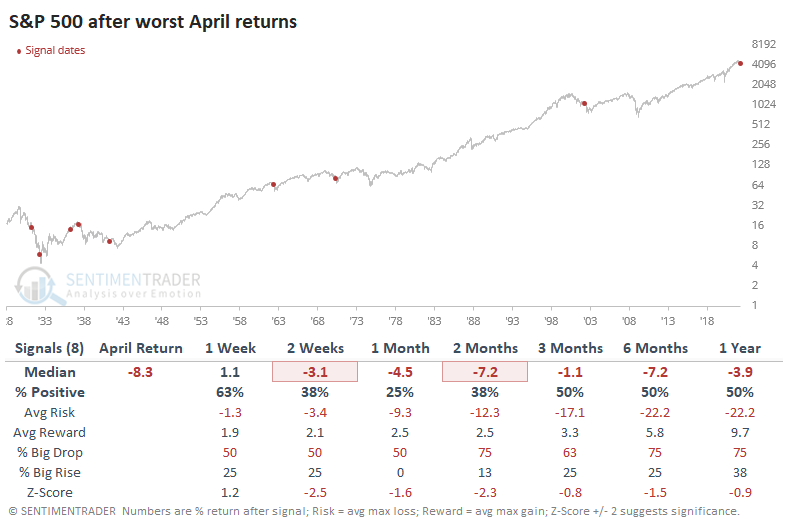
April tends to be a good month for stocks. When it bucks that historical tendency, it tends to lead to even worse losses. About the only solace is that there are few precedents in modern times.
A persistent streak selling pressure
The S&P 500 declined 1% or more for 4 consecutive weeks heading into this week, which Dean notes has been a negative sign. This type of selling pressure is somewhat rare, with the last instance occurring over a decade ago.
This study generated a signal 30 other times over the past 93 years. After the others, S&P 500 future returns, win rates, and risk/reward profiles were uninspiring in the 1-8 week range. The long-term results look better, especially after the 1929-32 bear market.
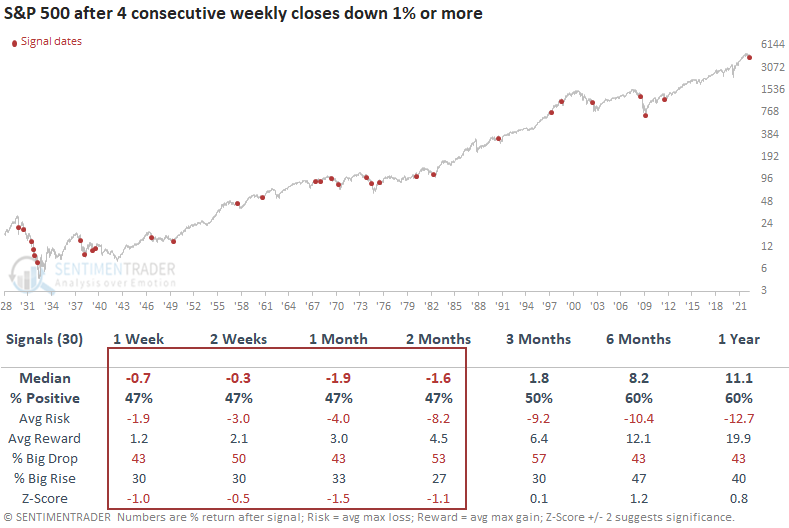
When Dean isolated instances when the index was down 15% or less from a multi-year high as today, the study shows weak results in the near term. However, the long-term outlook is constructive, with an 89% win rate 1 year later.
Heavy selling days with no subsequent buying interest
As noted earlier, buy-the-dip mentality is lacking this year. Even after big selling days, buyers aren't stepping up.
There have been several recent days with extremely poor breadth on the NYSE. Heading into the end of April, three out of six days had an Up Volume Ratio of less than 15%, and none of the days saw more than 85% Up Volume.
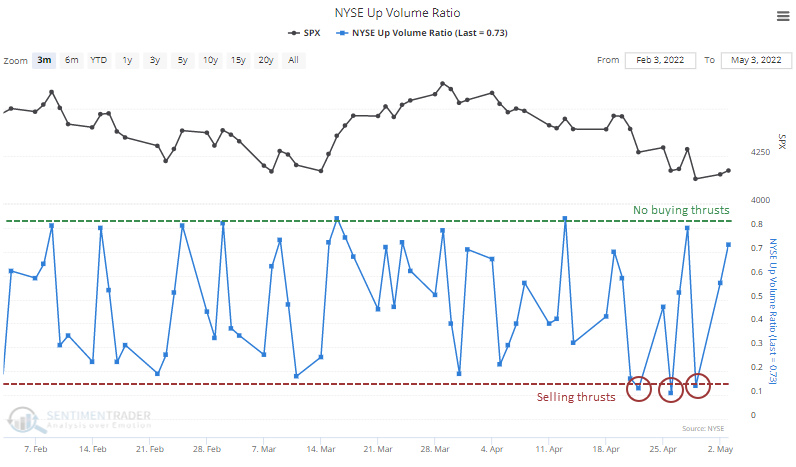
The negative volume was spread out, as the Up Issues Ratio held below 20% on those days, with no days above 80%.
Stocks have struggled when markets have suffered a cluster of heavy selling days with no accompanying days of buying interest. The table below shows every time over the past 60 years when there were at least three out of six days with extremely low Up Volume and Up Issues but no days with the opposite extremes.
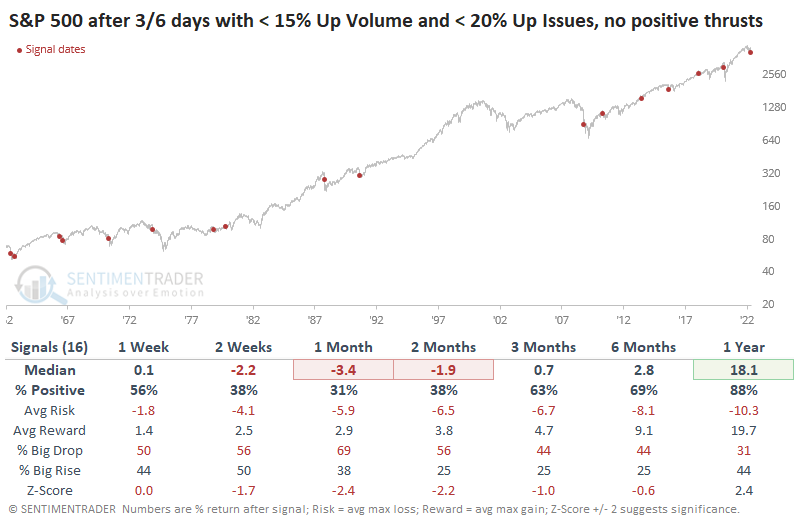
In 2013 and 2015, this was a great sign of oversold conditions, and buyers stepped up immediately. I wanted to wait a bit with this study to see if we'd have any follow-through this time, and so far, stocks are lagging. Based on prior signals, this also isn't a great sign.
Seasonality is another headwind
Mid-term election years have a demonstrated something of a "split personality" over the last 90 years. Jay noted that the first nine months typically witness a great deal of volatility and often significant market weakness, while the last three months of the year have seen the S&P 500 Index rise 84% of the time.
Within the first nine months, the summers were particularly troublesome. The chart below displays the cumulative price return for the S&P 500 held only from May through September during every mid-term election year starting in 1934.
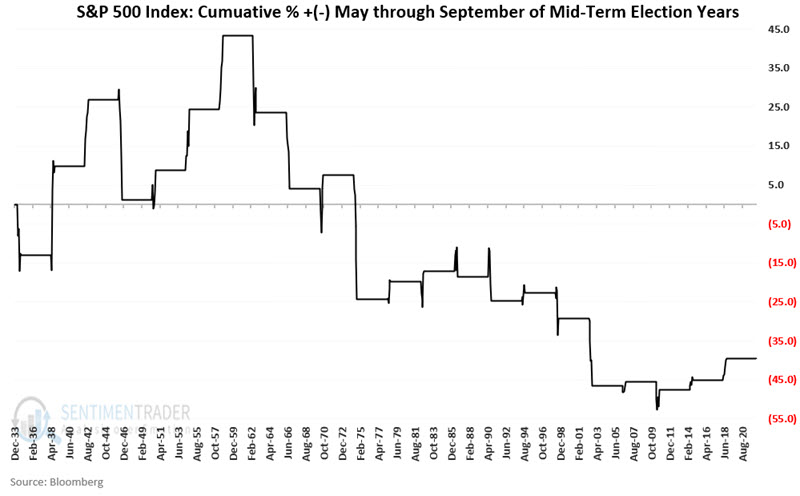
The cumulative return was a wretched -39.6%. While the S&P rose more often than it declined, its average loss was significantly larger than its average gain. When it lost, it tended to lose big, but when it won, the gains were more subdued.
One possible relief - sentiment has become too pessimistic
Jay showed that our Medium-Term Risk Levels indicator for stocks has fallen to a favorable level, suggesting the potential for a rally in stocks. He also looked at a particular option strategy that is well suited for traders looking for a low dollar-risk play.
The chart below displays the S&P 500 and its forward returns from the Backtest Engine after days when the Medium-Term Risk Level stood at a level of 1.
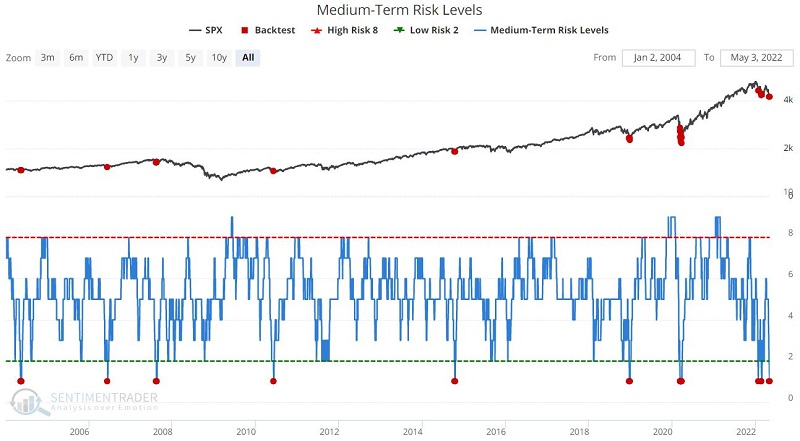
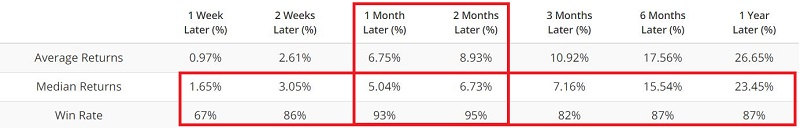
If history proves an accurate guide (and unfortunately, there is no guarantee that it will), the stock market could stage at least a decent bounce in the next 1-2 months. An out-of-the-money call butterfly option strategy is well-suited to this environment with a potential rally in the coming months.
Financial stocks need to get in gear
For anyone other than the most current generation of investors, trouble in Financial sector stocks sends a shiver down the spine. The meltdown in 2008 leaves the kind of scar that never fully heals.
For investors in these stocks, the past few weeks have not been fun. It's hard to find a Financial that's even trading above its 50-day average. The percentage of stocks in the sector trading above their 50-day moving average just fell below 5% after diverging from index prices for much of the past year.
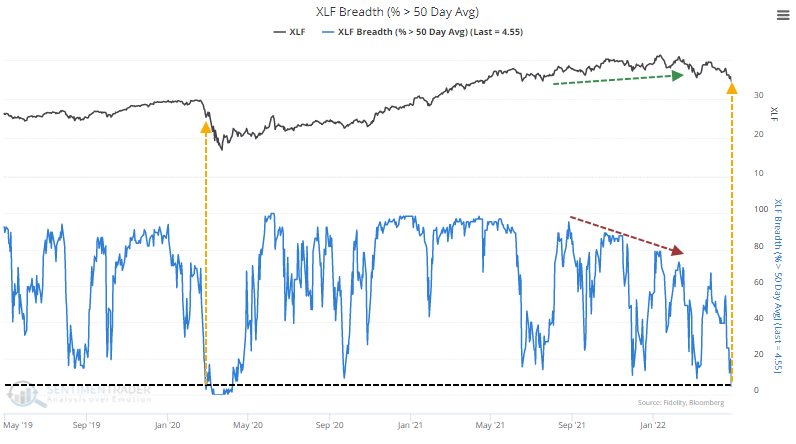
It's also worrisome that fewer than 40% of Financials are holding above their long-term 200-day moving averages, which is what we see during unhealthy environments.
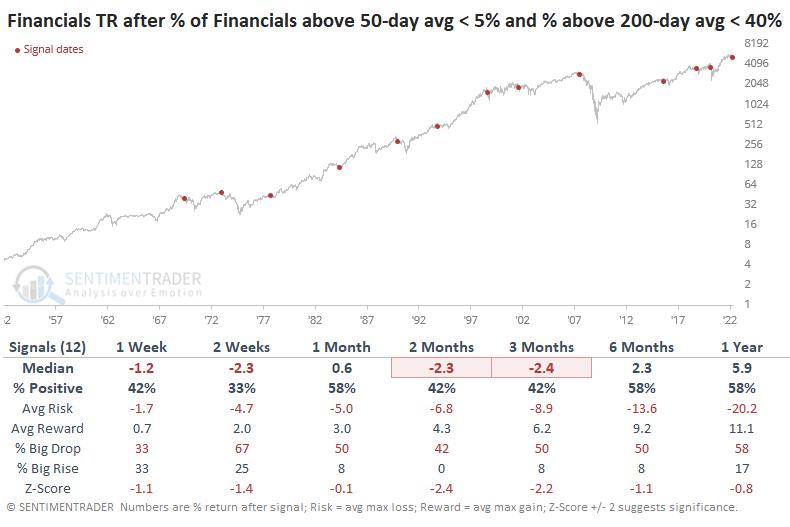
When fewer than 5% of Financials were trading above their 50-day averages and fewer than 40% were above their 200-day averages, the sector's total return was negative over the next 2-3 months.
Equity investors do not want to see trouble in Financials. Traders tend to sell these stocks and ask questions later because a single over-leveraged client can bring down an entire institution. With investors avoiding stocks in this sector to the degree that they are now, it's a worrying sign for all of us.
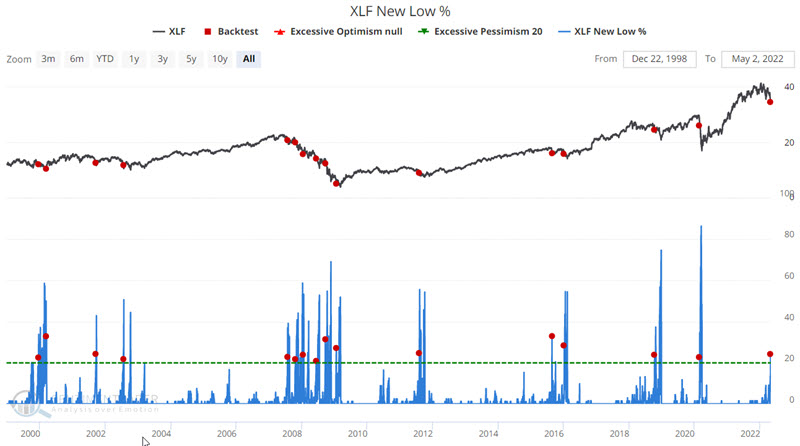
Further, Jay noted that the percentage of Financials making new 52-week lows recently crossed above 20%. A reading above 20% typically signals weakness and/or a breakdown in the sector. This can cause a ripple effect across a number of related markets and sectors.
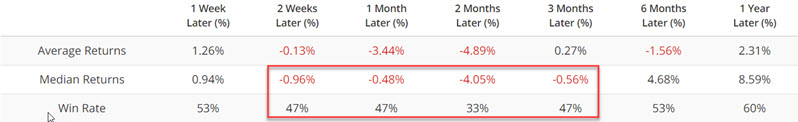
The figure below displays a chart of ticker XLF and highlights the times when XLF New Lows % was above 20% for the first time in 60 days and a summary of performance results. Over the next two months, XLF rallied only 33% of the time.
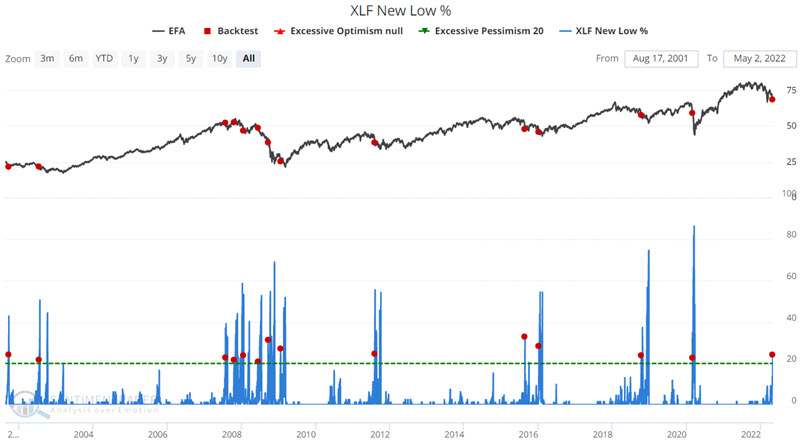
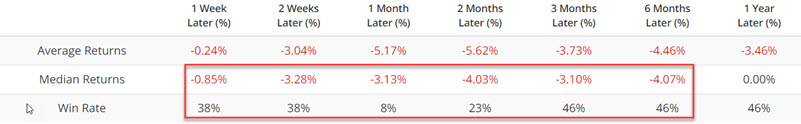
Now let's look at a broad international index. The figure below displays a chart of ticker EFA (iShares MSCI EAFE ETF) after the same signals. Even though it seems like it should be unrelated, weakness in Financials bled over to other domestic and even overseas indexes.
Energy stocks are rebounding from a deeply oversold conditon
Dean noted that the McClellan Oscillator for the energy sector surged from an oversold condition, within the context of solid sector participation trends. After other signals, the industry has rallied 70% of the time over the next couple of months.
The McClellan Oscillator is a market breadth indicator that measures the momentum of the underlying members of an index. Momentum is positive when it is above zero; below zero, it is negative. It also works as an overbought/oversold indicator when it pushes above +100 or below -100, respectively.
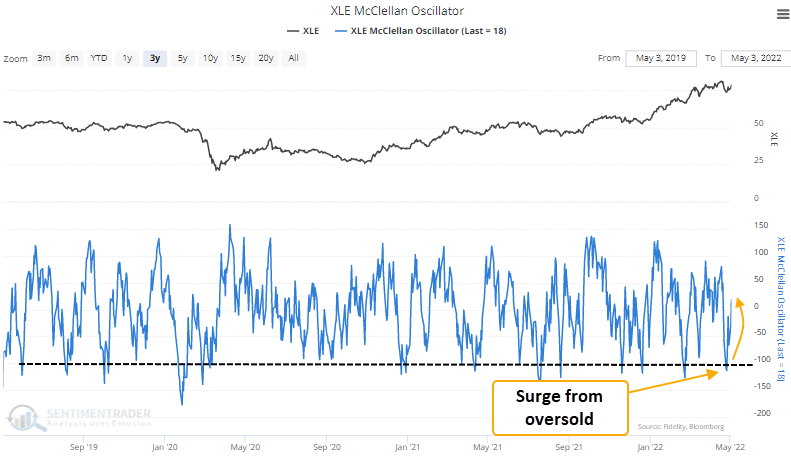
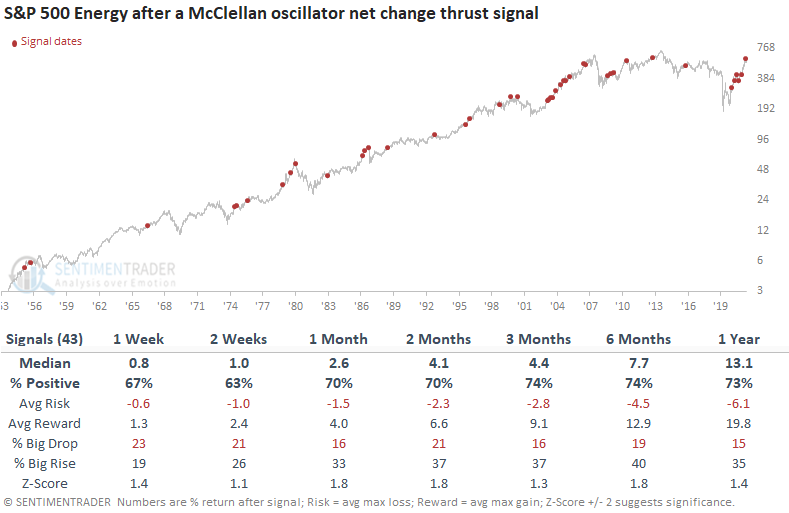
The model identifies a breadth thrust from an oversold condition within the context of bullish long-term participation trends. It generated a signal 43 other times over the past 68 years. After the others, energy sector future returns, win rates, and risk/reward profiles were solid across all time frames. While non of the signals showed a z-score with significance, several time frames got close. The current alert represents the 6th instance in the current energy bull market, which suggests this environment looks more and more like 2003-08.
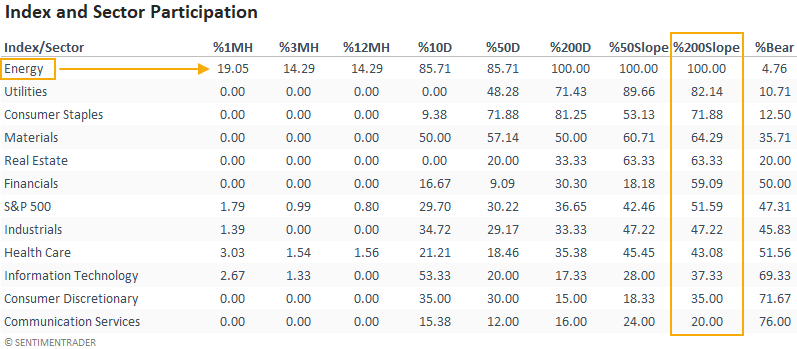
Energy sector participation looks solid across short, medium, and long-term indicators, and new highs are starting to expand again.
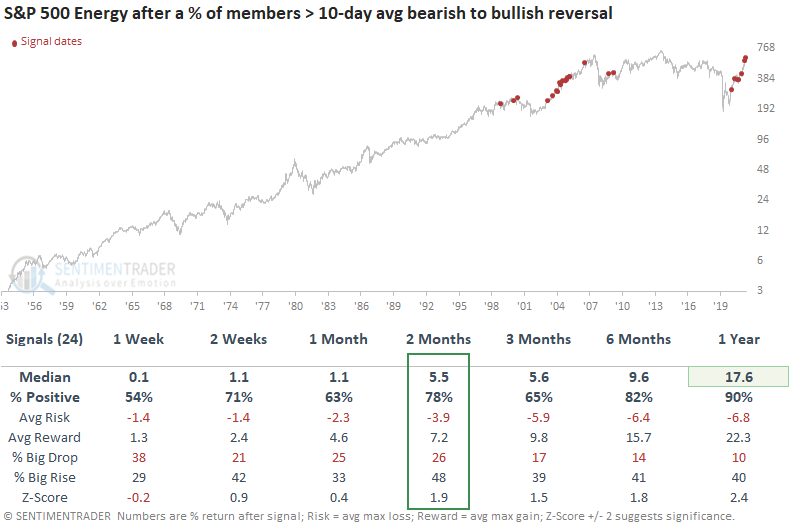
Dean also noted that the percentage of Energy stocks above their 10-day average just reversed from below 10% to above 90%.
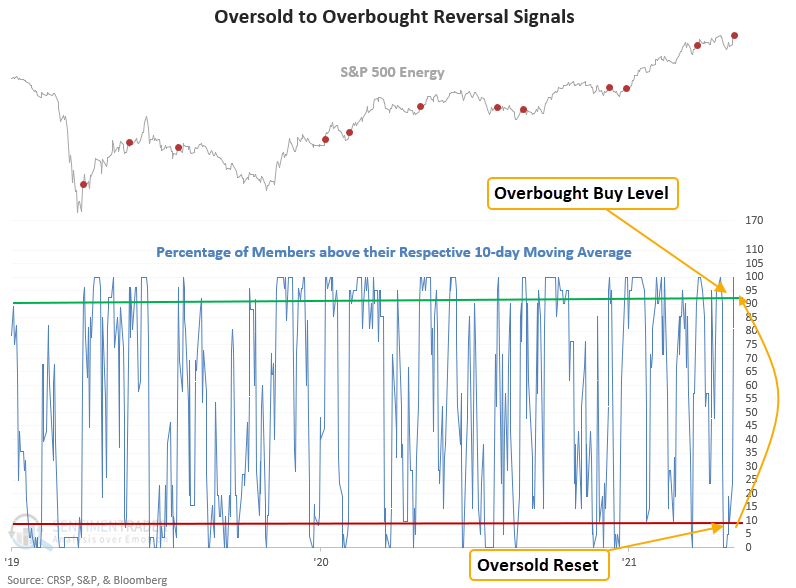
When he included a trend filter that requires 90% or more energy members to have a rising 200-day moving average when the reversal occurs, this model generated a signal 24 other times over the past 23 years. After the others, the energy sector showed positive returns across all time frames.
It would help if the dollar would decline, but...
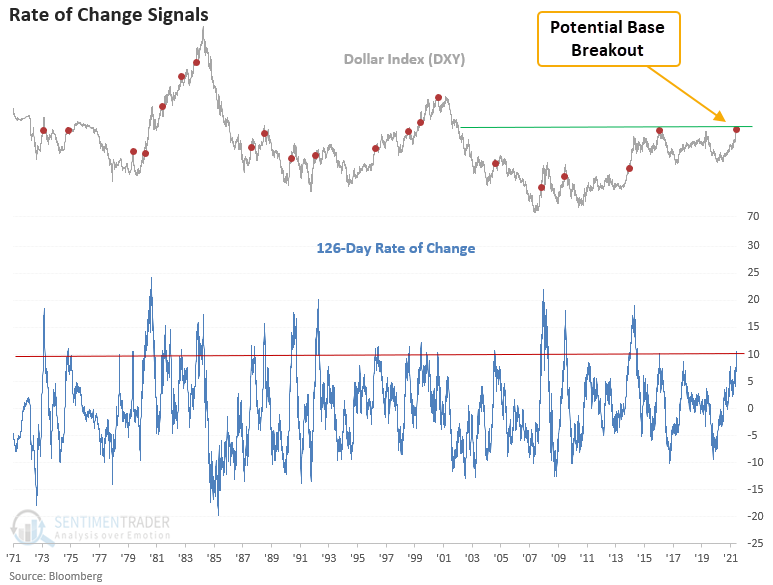
The Dollar Index (DXY) has jumped by 10% over the last six months. Dean showed that surges of this magnitude suggest the dollar can continue higher in the near term.
This study generated a signal 20 other times over the past 48 years. After the others, the Dollar Index's future returns, win rates, and risk/reward profiles look solid in the 1-4 week time frames. And, more recent signals look even better, with 13 out of 14 winners at some point in the first month.
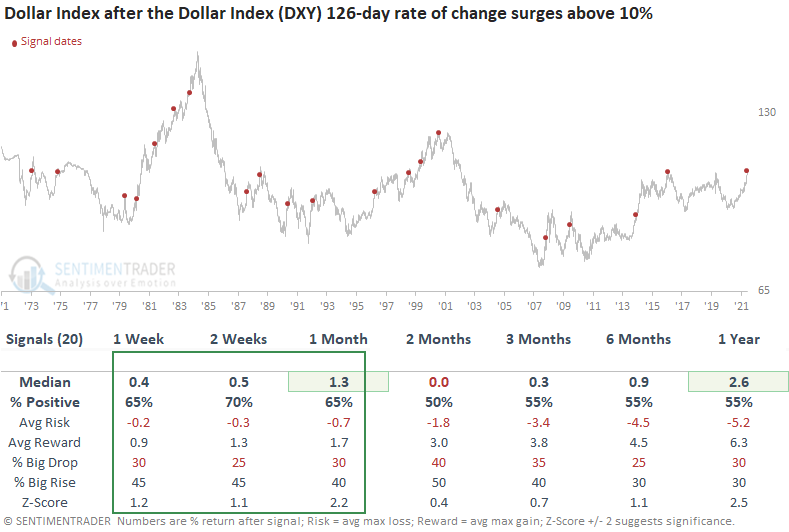
Commodities, oil, copper, gold, and stocks all tended to show weak returns in the weeks and months following these dollar surges.
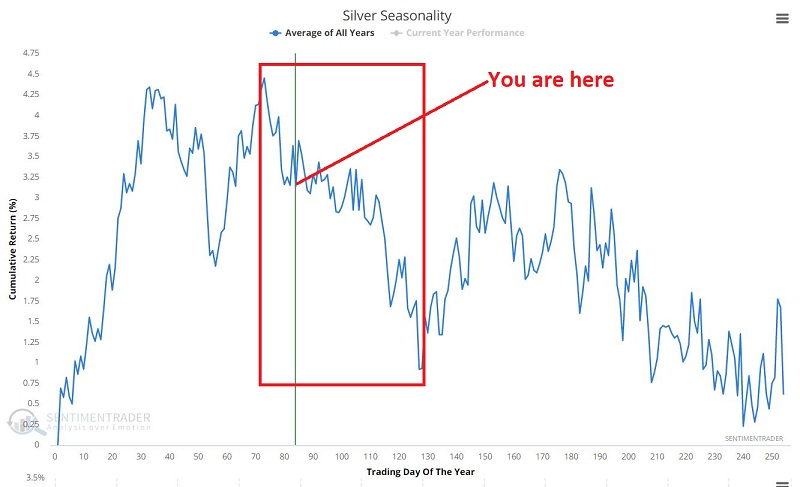
Silver's seasonal headwind
Jay looked into the annual seasonal trend for silver futures. It reached its seasonal peak a few weeks ago and tends to decline for several more months.
Let's "zoom in" just a bit and highlight the performance for silver futures only from the close on the 2nd trading day of May through the close on the 19th trading day of June.
The chart below displays the hypothetical $ +(-) achieved by holding a long position in silver futures only during the period described above each year since 1970.
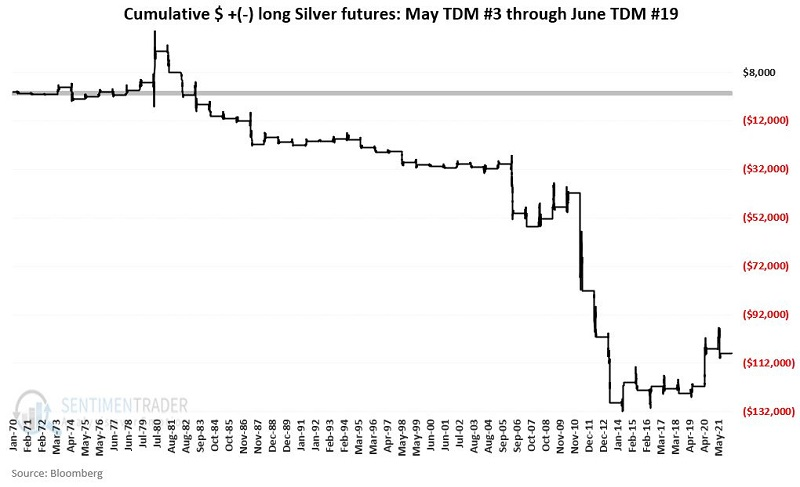
The Win Rate drops to 36%, and the cumulative loss increases from -$95,630 to -$108,095.
About TradingEdge Weekly...
The goal of TradingEdge Weekly is to summarize the research published to SentimenTrader over the past week. Sometimes there is a lot to digest and this summary is meant to highlight the highest conviction or most compelling ideas we discussed. This is NOT the full research that's published, rather it pulls out some of the most relevant parts. It includes links to the published research for convenience; if you don't subscribe to those products it will present the options for access.