
TradingEdge Weekly for May 29 - RSP recovery signals, European breadth thrust, PE/VIX spread, energy and corn seasonality

Key points:
- RSP recovered from an 8% drawdown in ~42 trading days; 6 prior signals all showed RSP higher 6 months later (avg +9%)
- PE/VIX spread crossed back above 5.5 after a 63-day absence; 21 signals show SPX higher a year later 81% of the time, but VIX tends to spike alongside the rally
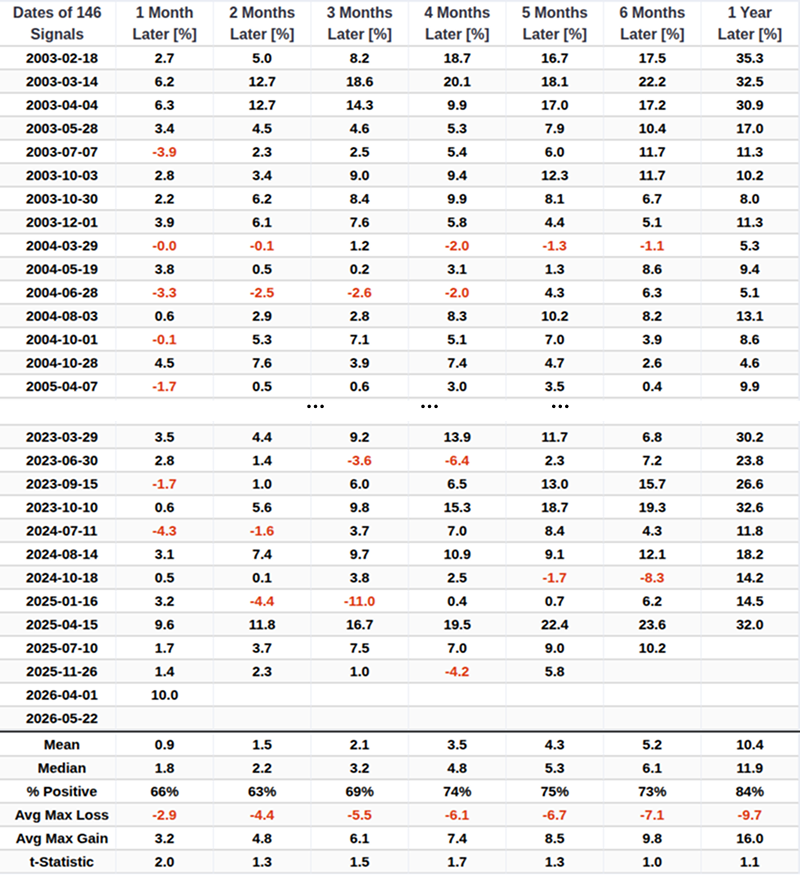
- European breadth surged from below 25% to over 75% in under a month; historically a potent bullish signal for the S&P 500
- Energy (XLE, OIH, XOP) enters a historically weak period mid-June through September (XLE cumulative -73% in this window)
- Corn futures enter seasonal bearish window (May 21 - Aug 14); 22% win rate since 1981, but exceptions like 2012 gained over $7K
House view:
- Stocks:
- Short-term: Modestly bullish . The VIX and CDX remain in healthy territory. U.S. equities achieved a historic breakthrough, with all three major indices setting new closing highs simultaneously. The dual catalysts of "ceasefire expectation" and "core inflation cooling" ignited strong risk appetite, while robust corporate earnings provided solid micro support. Tech and AI sectors led the rally, with small-cap stocks also surging as interest rate pressure eased. Furthermore, analysts highlighted last week that the underlying risk of a potential market pullback remains, and investors should maintain appropriate hedging instruments. Historically, June tends to be a sluggish month for the SPY, as the index often faces seasonal headwinds.This time frame covers 1-4 weeks.
- Intermediate-term: Bullish. Market momentum (80.95) has improved significantly, signaling a return to risk-on sentiment. The medium-term upward trend remains firmly established. Moderating inflation data has reduced pressure for further interest rate hikes, while the potential de-escalation of geopolitical tensions will help repair corporate profit margins. The market's profit-making effect is expected to attract more incremental capital. This time frame covers 1-5 months.
- Long-term: Bullish. U.S. economic resilience persists relative to global peers. The long-term trajectory is supported by multiple positive factors: the continuous expansion of AI industry applications will drive long-term economic growth, and the gradual cooling of inflation creates room for future policy adjustments. Despite potential short-term fluctuations, the overall upward trend remains intact. This time frame covers 6-12 months.
- Overweight: AI software giants with strong monetization capabilities, consumer leaders that beat earnings expectations, and small-cap stocks sensitive to interest rate changes
- Underweight: Traditional energy stocks facing price pressure, defensive sectors with weak growth drivers
- Maintain a high allocation to U.S. core assets while reserving appropriate hedging tools against geopolitical risks
- Bonds: Long-term cycles remain bearish. U.S. Treasury yields pulled back from recent highs, with the 10-year yield falling notably. The cooler-than-expected core PCE data was the primary driver of the yield decline, easing market worries about aggressive monetary policy tightening. Bond prices rebounded, providing favorable conditions for the recovery of high-valued equity assets.
- Commodities: Commodities showed mixed performance, with energy markets experiencing sharp volatility and precious metals staging a rebound.
- Crude Oil: Oil prices fell sharply after the ceasefire news, as concerns about long-term shipping disruptions eased significantly. However, before the formal implementation of the peace agreement, the market will remain highly sensitive to geopolitical developments, maintaining wide price swings.
- Gold & Silver: Precious metals rebounded strongly after hitting lows, supported by falling Treasury yields that reduced the opportunity cost of holding non-interest-bearing assets.
- Crypto: We follow several simple systems for U.S.-traded bitcoin, which we consider the equivalent of the S&P 500 for crypto. Amid the market's paradigm shift to real assets and fiat credit doubts, crypto assets face valuation revaluation pressure from tech stock sell-off contagion, but long-term fundamental support from tokenization remains. Market volatility rises with the overall financial market, and short-term price performance is dominated by risk appetite shifts, with structural opportunities tied to institutional adoption and underlying technology innovation.
- Triple 40: Bearish
- RSI Momentum: Bullish (Warning: About to fall below 37)
- Trend and Relative Trend: Bearish
- PMI: Bullish
- M2 ROC: Bearish
- Notable Moves in Global Markets:
- Europe: European equities failed to partake in Wall Street's exuberance. Bucking the broader trend, European markets trended lower, standing in stark contrast to the rally in U.S. stocks. Investors engaged in "sell the news" trading following the ceasefire announcement, while renewed military actions raised lingering concerns about energy security.
- Japan: The Nikkei index consolidated after consecutive gains. While lower oil prices benefited the import-dependent economy, yen exchange rate volatility and uncertainties about central bank policy kept investors cautious, leading to a technical correction.
- Hong Kong & Asia-Pacific: Emerging markets in Asia-Pacific were under significant selling pressure. Hong Kong stocks were hit hard by declines in technology and real estate sectors. Foreign capital shifted from regional assets to U.S. equities with higher certainty, showing obvious "siphon effect" of capital flows.
Where we're at
Most investors have the most riding on equities. We feel that the most significant determinants of success for investors are whether to adjust their allocation to that asset class based on factors that have historically had a good record of preceding above- or below-random returns in the months ahead.
Those factors include the probability of a looming recession, sentiment, price action, volatility, breadth, and the bond market. The chart below summarizes the main indicators and composite models we watch for those factors, and they're mostly in bullish regimes. Valuations are not part of these factors since the relationship has been too inconsistent on time frames under one year.
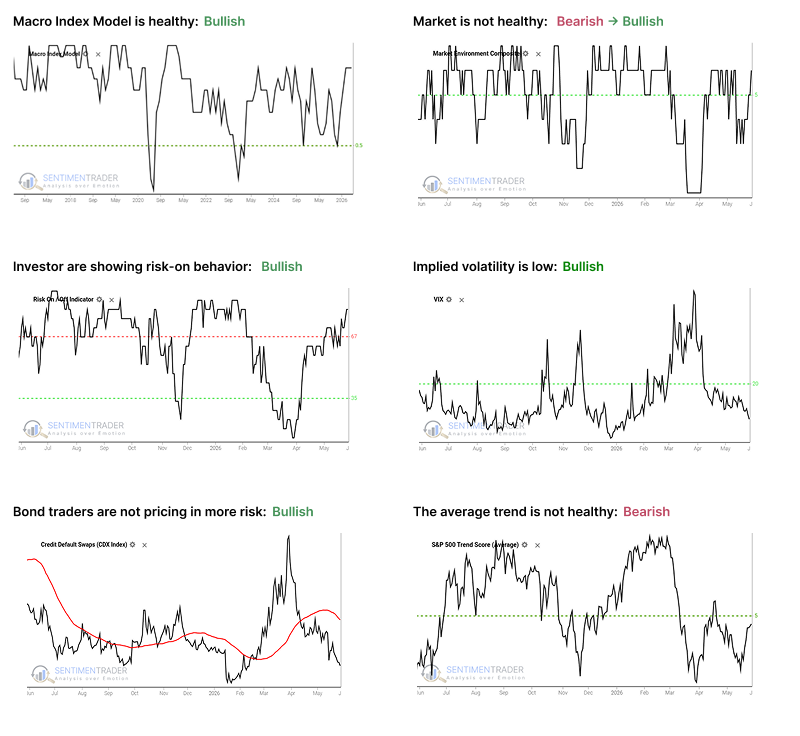
- The Macro Index Model is above the 50% threshold, which has been a vital level as outlined here.
- The Market Environment has been skittish, but is currently healthy. Future returns, especially for higher-beta indices, has been markedly better, with less risk, when the environment is healthy as outlined here.
- The Risk On / Off Indicator shows that investors are still in risk-on mode. This has been a good sign for future returns as outlined here.
- Implied volatility remains below 20, showing a calm environment. The S&P 500 has perfomed well when this is the case as outlined here.
- Credit default swap spreads are below their 50-day moving average, which drastically improves stock returns as outlined here.
- A composite of trend measures in the average S&P 500 stock have dropped below 5, which shows weak trend conditions.
RSP completes one of the fastest 8% drawdown recoveries on record
The equal-weight S&P 500 fell 8% from a three-year high in early April, then clawed back to breakeven by late May - roughly 42 trading days from trough to recovery.
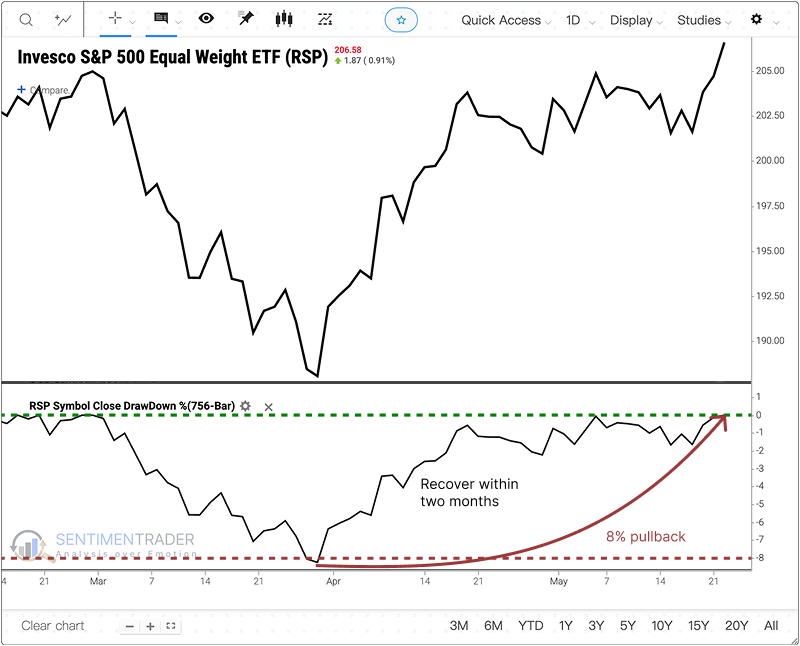
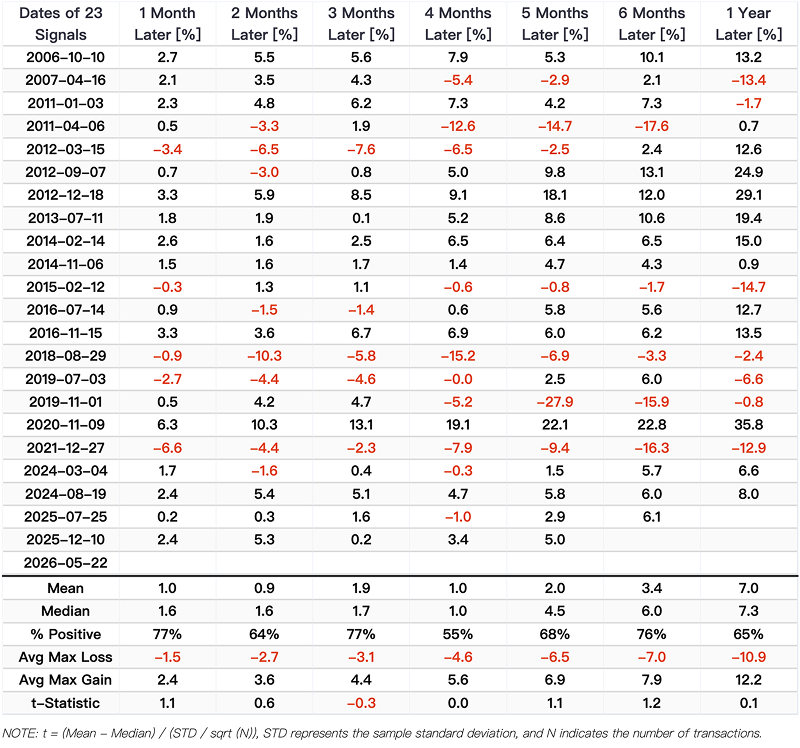
Require -8% to 0% within 42 trading days and the sample shrinks to six prior signals. Six months later, RSP was higher every single time, averaging more than 9%. A year out, five of six were positive, averaging over 14%. The worst loss over a full year was under 8%.
Loosen the filter to -5% drawdown and we get 22 signals. Forward returns remain tilted positive across every horizon. The failures clustered in 2007, 2015, and the 2021 signal that preceded the 2022 bear market - all softening macro backdrops.
PE/VIX spread back above 5.5: stocks rally, but volatility spikes alongside
The spread between the S&P 500 forward P/E ratio and the VIX has crossed back above 5.5, landing at 5.96, the first time in more than three months. Require at least a 63-day gap between signals and the sample tightens to 21 prior signals.
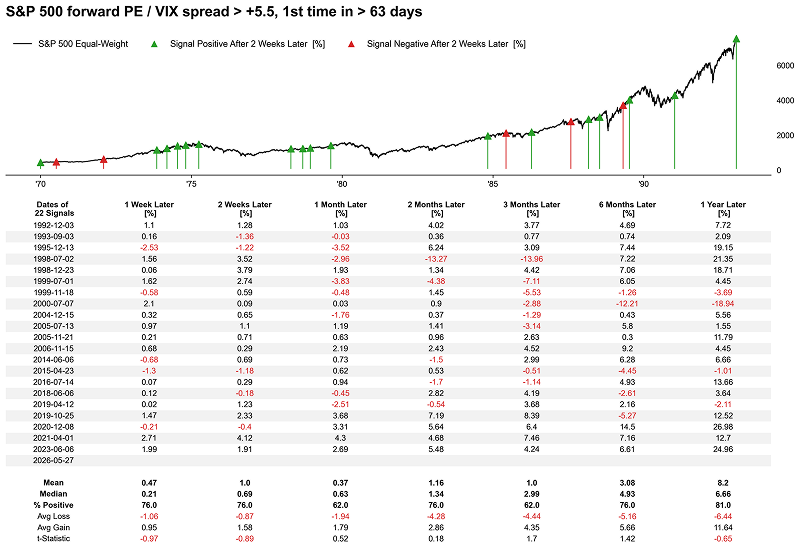
Short-term returns were choppy, but six to twelve months out the S&P 500 rallied. A year later, it was higher 81% of the time, averaging an 8.2% gain. The median max loss was 4.5%; strip out the six exogenous shock signals and it drops to 3.7% with a 93% win rate.
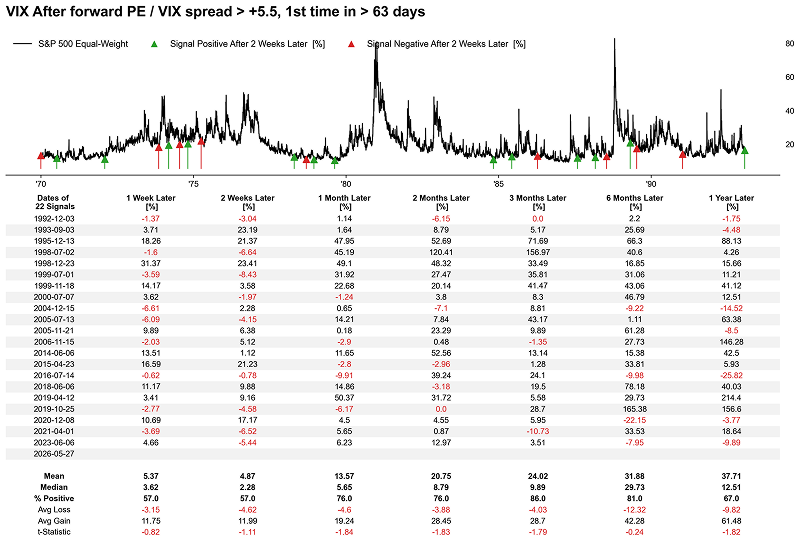
The catch: the VIX was higher three months later 86% of the time. The historical pattern is one or two pullbacks of less than 5% in the first three months, VIX spikes into those dips, and both stocks and vol end the year higher.
European breadth surge: a bullish signal for US equities
European equities staged a massive rally after a sharp March drawdown. Aggregating short-term breadth across the UK, Switzerland, France, and Germany, the metric currently sits at 76.5 and trending higher.
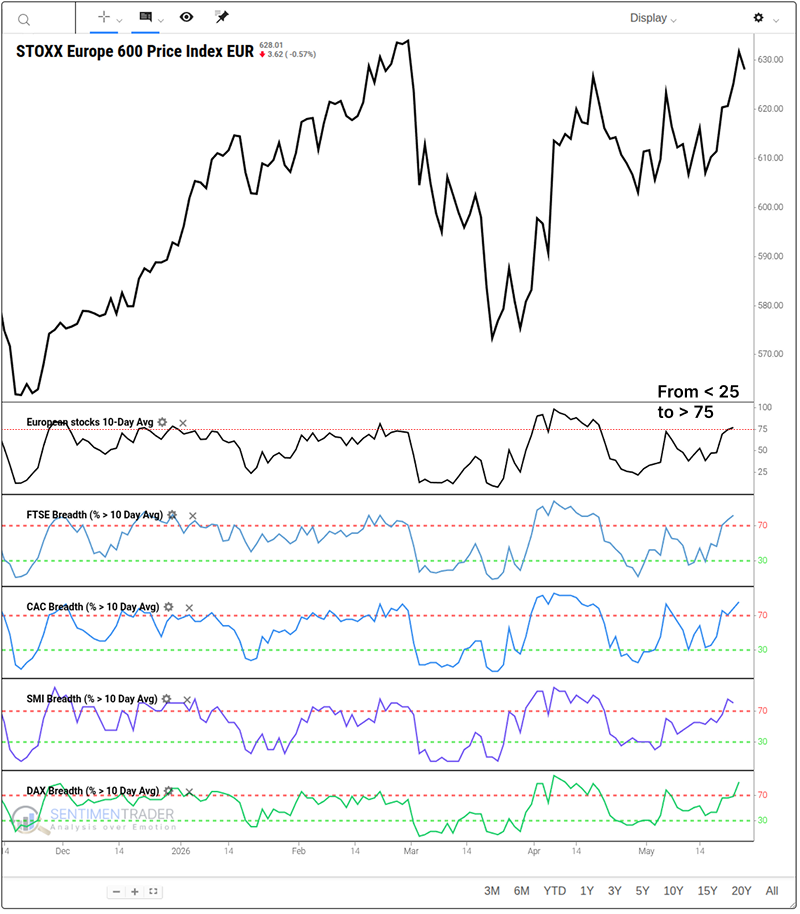
For the STOXX 600 itself, forward returns are passable but risk/reward is skewed - severe drawdowns outweigh massive gains in the near term. However, these breadth thrusts in Europe serve as a potent bullish signal for the S&P 500, which consistently outperforms across medium-to-long-term horizons.
Energy seasonality: summer weakness ahead
XLE enters a strong window (May 26 - June 10) that has gained in 17 of 27 years (+63% cumulative). But the following period (June 10 - September 25) shows weakness: only 11 of 26 years with gains and a cumulative -73%.
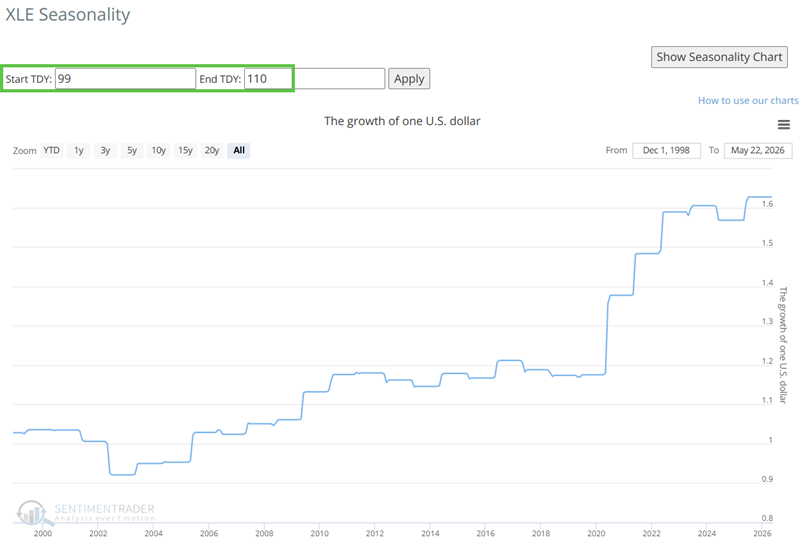
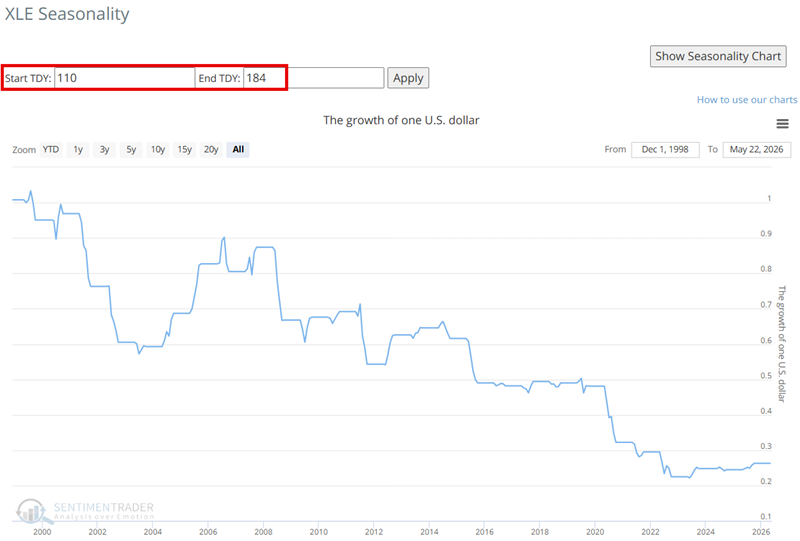
OIH and XOP show the same pattern. Fundamentals remain strong for now, but seasonality suggests it may be time to consider profit-taking strategies or trailing stops.
Corn enters the seasonal 'Danger Zone'
For 2026, the bearish seasonal window extends from May 21st through August 14th. Each one-point move in a corn futures contract is worth $50. The long-term downside bias is obvious, but a 22% win rate means corn has moved higher roughly once every five years during this period, including gains exceeding $7K in 2012.
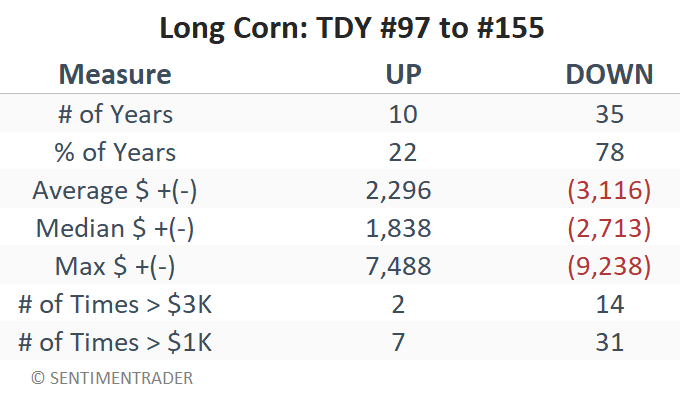
Non-futures alternatives are limited: shorting the CORN ETF requires margin and carries unlimited risk; options on CORN have extremely thin volume and wide spreads.
About TradingEdge Weekly...
The goal of TradingEdge Weekly is to summarize some of the research published to SentimenTrader over the past week. Sometimes there is a lot to digest, and this summary highlights the highest conviction or most compelling ideas we discussed. This is NOT the published research; rather, it pulls out some of the most relevant parts. It includes links to the published research for convenience, and if you don't subscribe to those products, it will present the options for access. For a visual breakdown of this report, please click here to watch the companion video.