
TradingEdge Weekly for May 23 - Price momentum, healthcare discount, option collars

Key points:
- The S&P 500 and Nasdaq 100 enjoyed perfect weeks last week
- Thanks to that spurt, their Trend Scores showed notable improvement
- The Nasdaq held about its 10-day average for a month
- Healthcare stocks are in a historic drawdown relative to the market, as insiders buy
- An example of using an options collar to hedge a stock
- Several sectors are showing seasonal strength
- Wheat's window is weak, however
- Other commodities are also showing weak seasonal windows ahead
Perfect weeks
In what would have been inconceivable for most investors a little over a month ago, the S&P 500 and Nasdaq 100 just enjoyed perfect weeks. They both managed to rise every day of a 5-day workweek, and with good gains to boot. This was the S&P's 2nd-longest winning streak of the year.
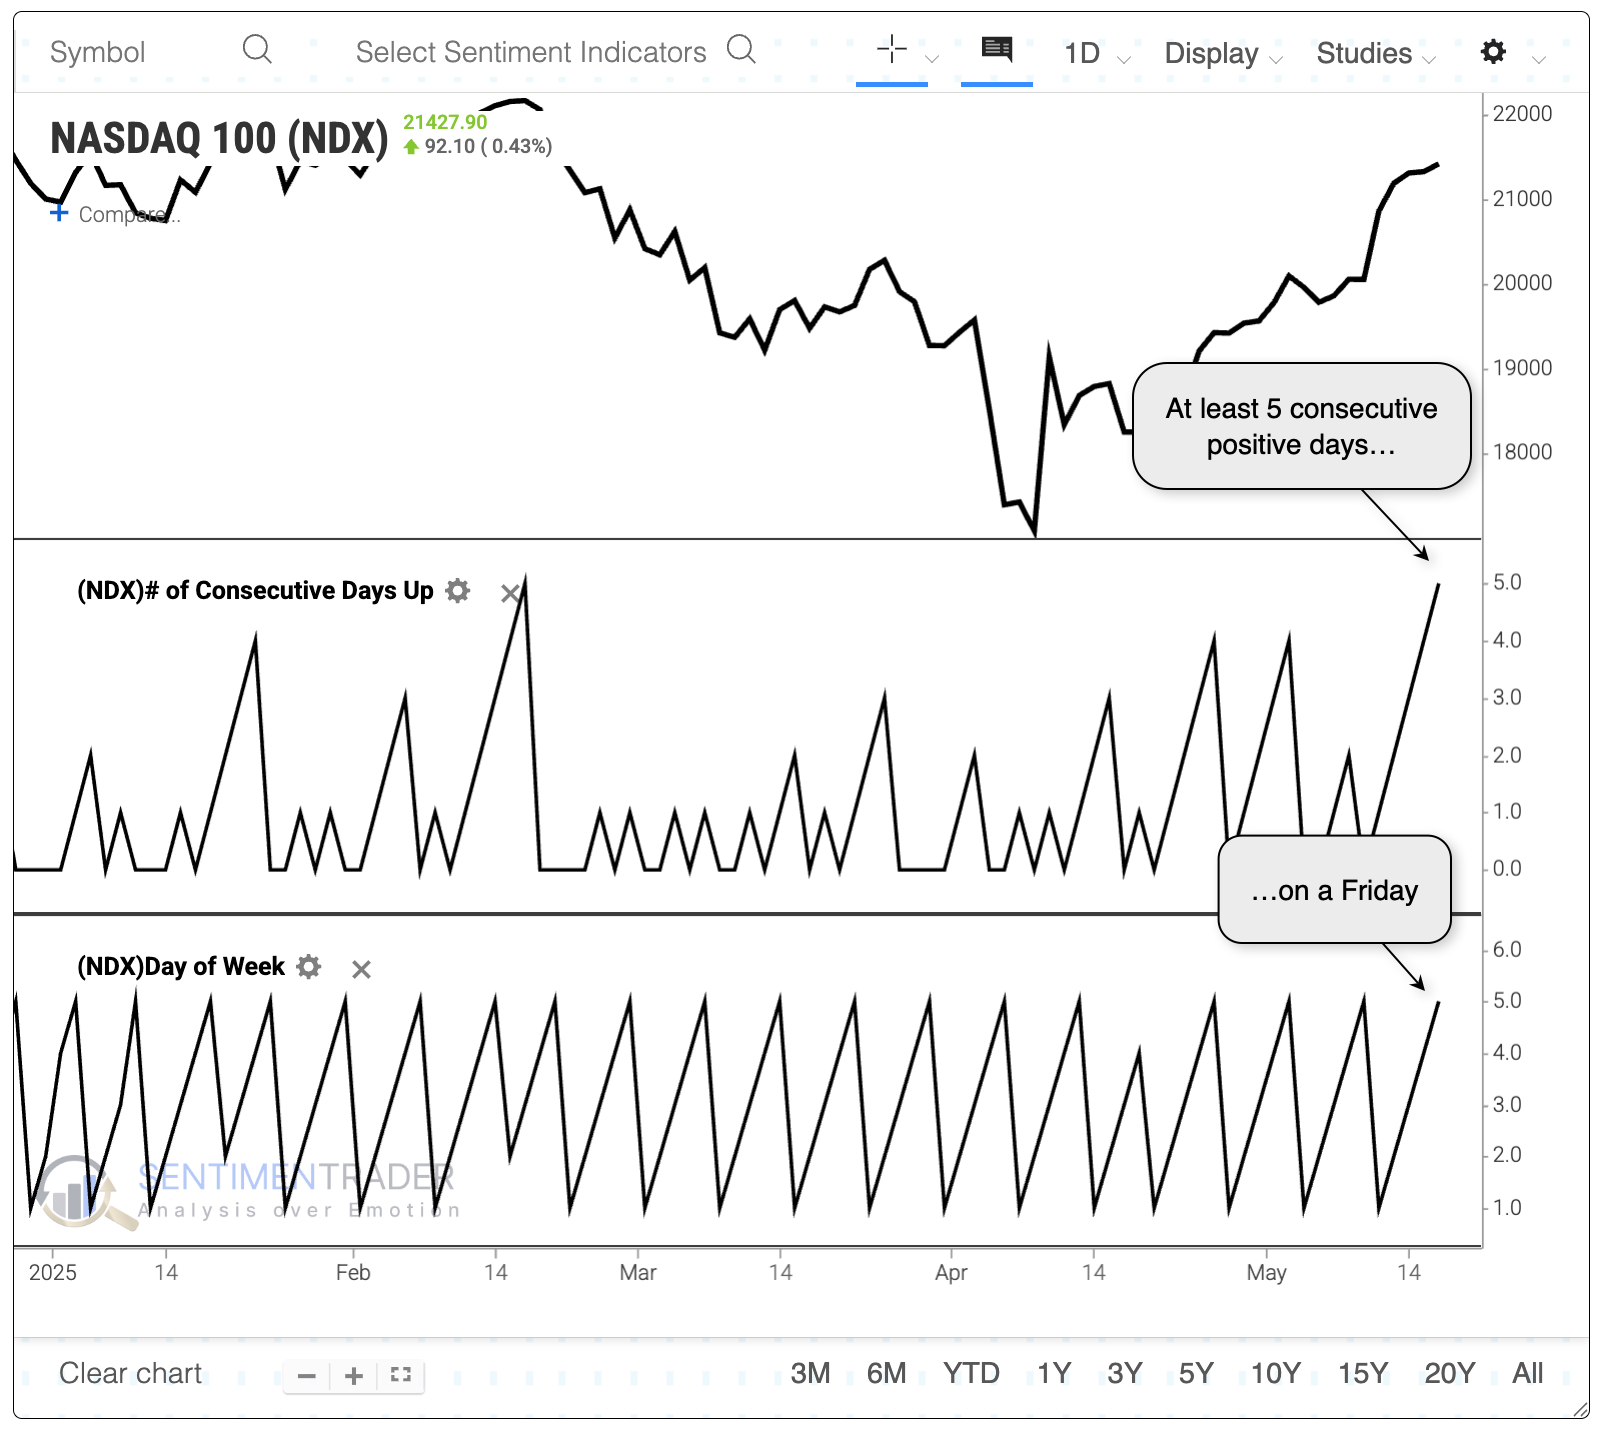
During ongoing bear markets, investors tend to get too nervous to allow both indices to enjoy perfect weeks. Outside of 2011 (if that can be considered a bear market), a dual perfect week never happened during an ongoing bear market.
When both indices score a perfect week, the S&P 500's returns were above average in the months ahead. The Nasdaq 100 fared even better after these dual perfect weeks. Two months later, it was higher 85% of the time, with an average return significantly above random.
What's even more notable is that both indices gained at least 3%, which puts them into rarified air. Perfect weeks with significant gains tended to precede even larger average returns in the S&P 500.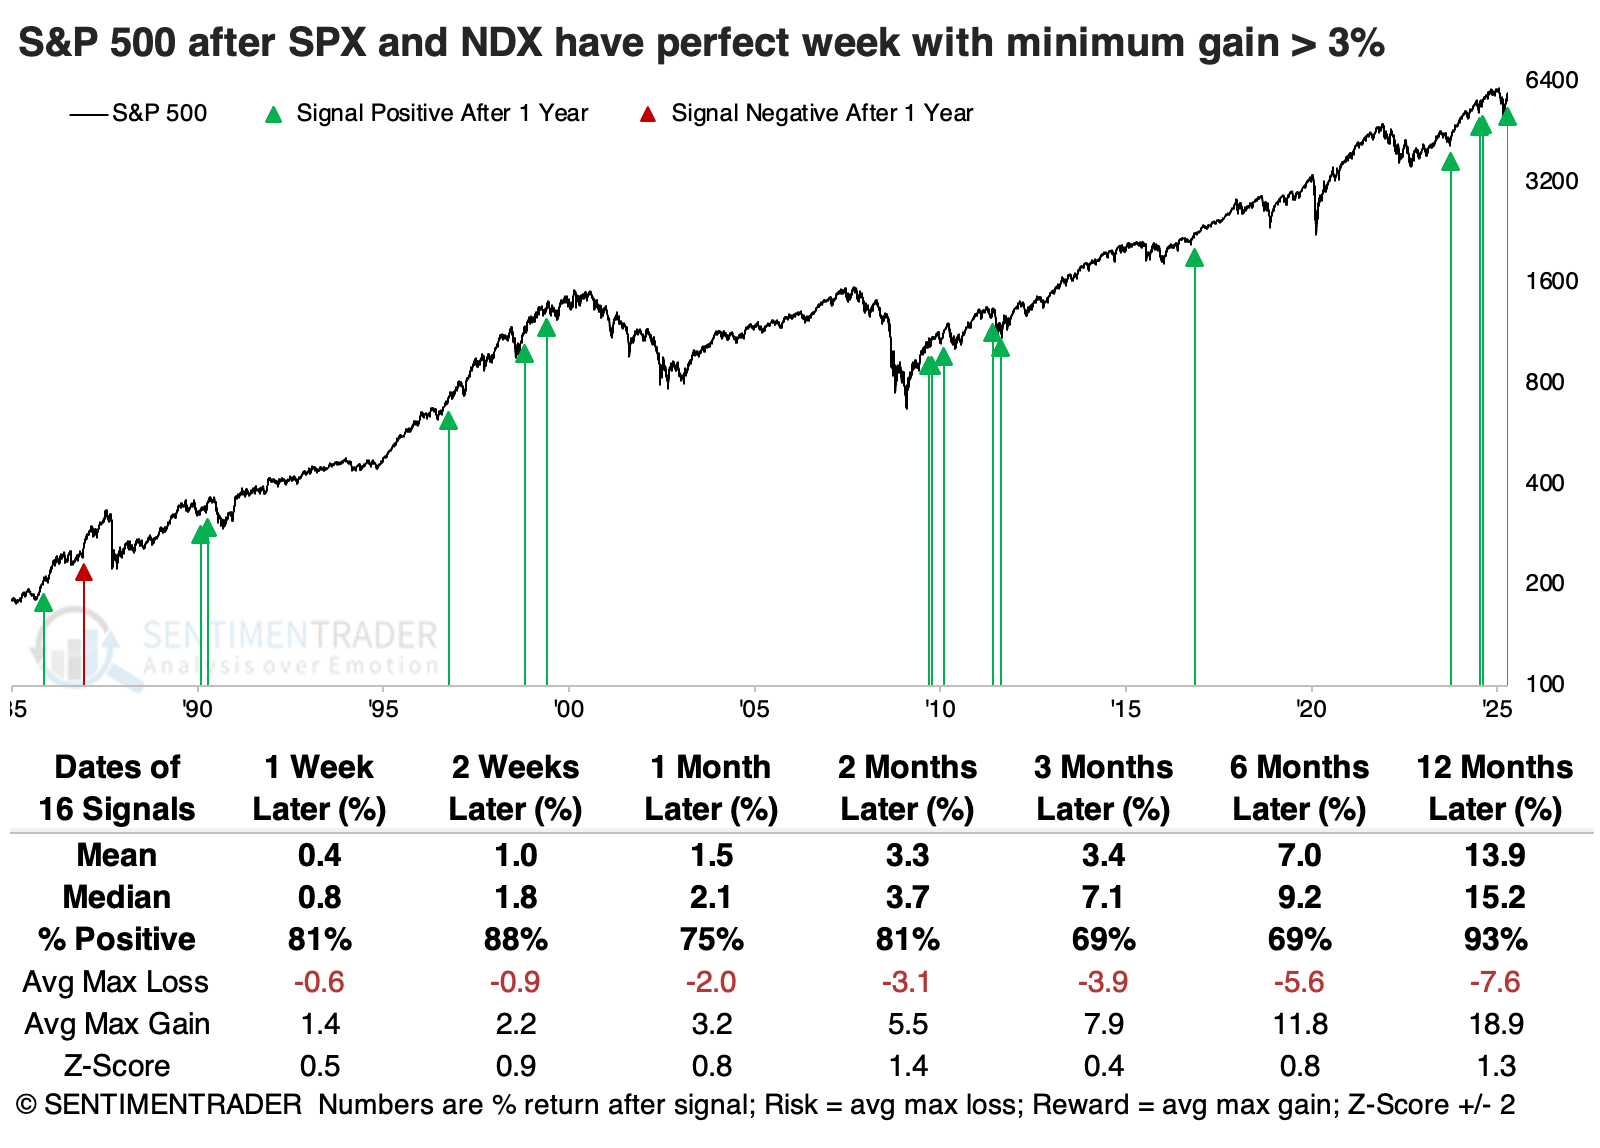
Again, the Nasdaq 100 fared even better. The index rallied every time a year after these dual perfect weeks, with an excellent risk/reward profile. It suffered more than a -10% drawdown four times, while rising at least +10% fourteen times. Discretionary and technology stocks enjoyed among the highest returns from three months and beyond.
Rising trend scores
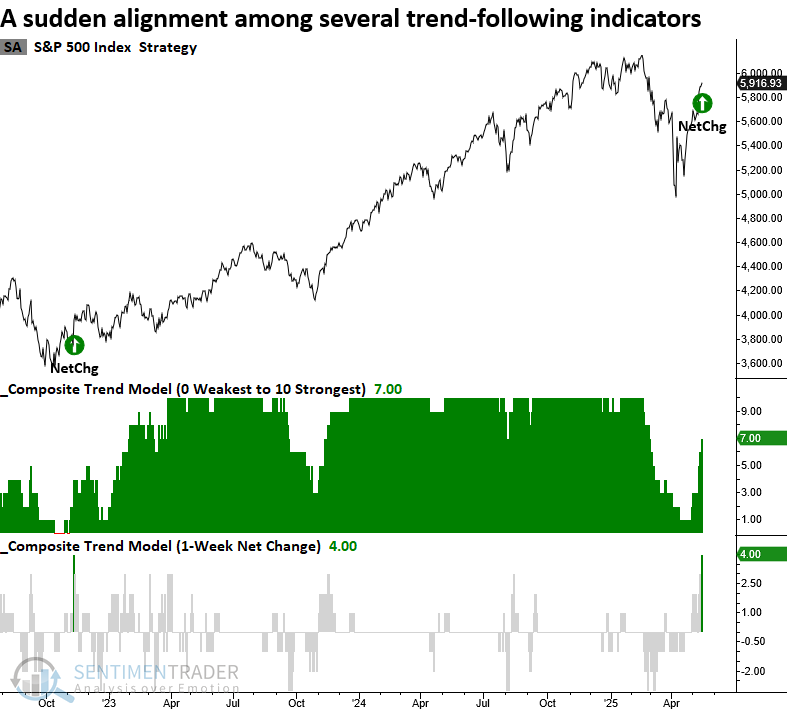
Thanks to the perfect week, the S&P 500's trend score rose four points over five days. Dean showed that similar trend shifts saw the S&P 500 rise 86% of the time over the subsequent year. The Nasdaq 100 also registered a buy signal.
Further supporting the shift from a downtrend to an uptrend, the S&P 500 and Nasdaq 100 saw notable increases in trend scores, marking their first net change signals since the recovery from the 2022 bear market.
Whenever the S&P 500's trend score climbed by four points over five days, the world's most benchmarked index displayed excellent returns and consistency over the next year. Of the five instances when the S&P 500 declined a year later, all but one,1965, occurred during a well-established downtrend, with signals emerging 169 to 584 days after the peak. By contrast, the latest signal emerged just 61 days from the high.
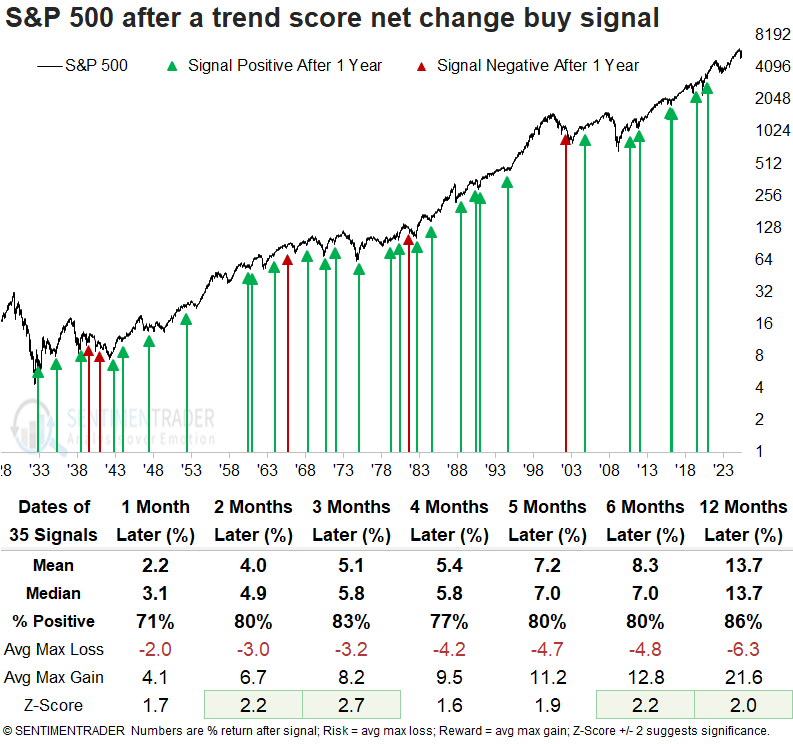
A year later, the S&P 500 declined more than 10% only eight times. In contrast, it posted rallies of over 10% in 28 cases, suggesting a favorable risk/reward scenario.
The Nasdaq 100 also triggered a trend score net change signal, the first occurrence since January 2023. The Nasdaq 100 posted strong and consistent gains after a trend score surge, advancing in all but one instance over the next year, with the sole decline a negligible -0.02%.
When Nasdaq 100 signals are extended to the S&P 500 and its sectors, it shows the world's most benchmarked index rose 100% of the time a year later, with technology outperforming all groups.
Another impressive streak
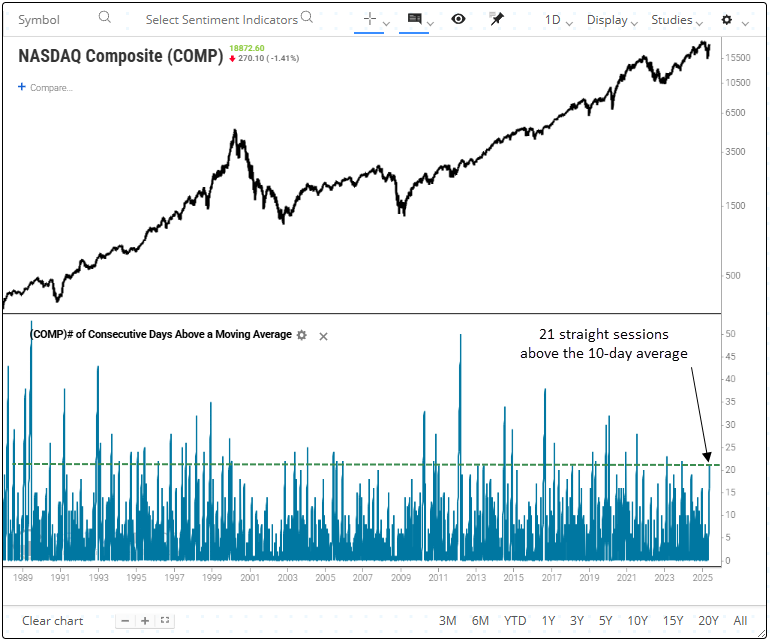
The Nasdaq Composite closed above its 10-day average for 21 straight days, following a six-month low. Dean noted that similar win streaks saw the tech-heavy index rise 92% of the time over the next year.
In volatility-driven bear markets, it's rare for indexes to maintain strength above a short-term moving average like the 10-day. Sustained closes above this level typically indicate that buyers are in control and that the path of least resistance has shifted back to the upside. Although the S&P 500 failed to generate a signal, the Nasdaq Composite did, marking its 27th occurrence since 1973.
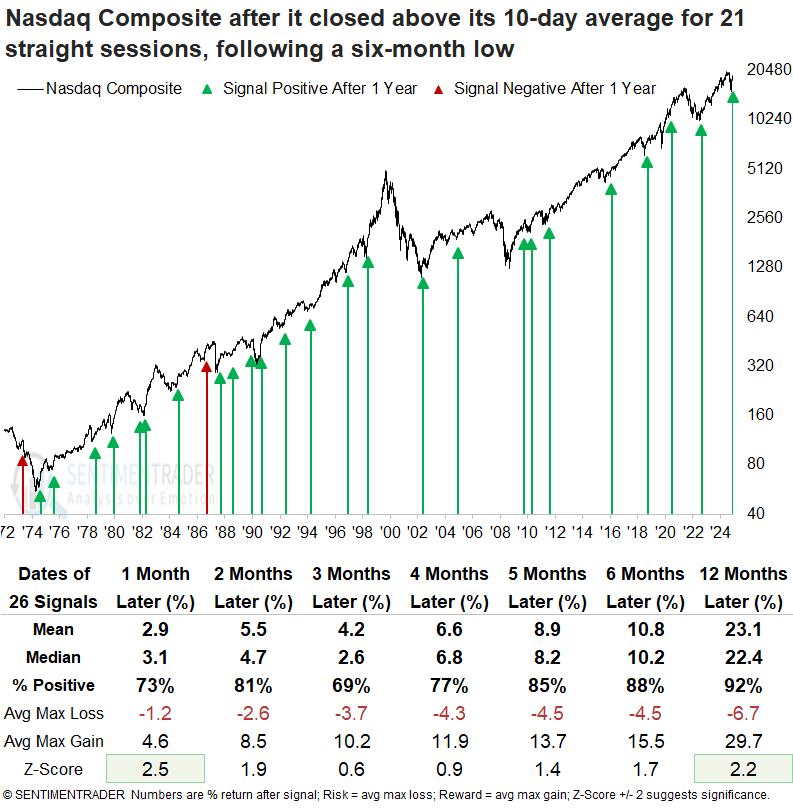
Whenever the Nasdaq Composite sustained above its 10-day average for 21 consecutive sessions following a six-month low, the tech-heavy index displayed outstanding returns and consistency, especially a year later, rising 92% of the time. Only two instances occurred within the context of a bear market rally: 1973 and 1990 .A year later, the Nasdaq Composite declined more than 10% only five times. In contrast, it posted rallies of over 10% in 24 cases, suggesting a favorable risk/reward scenario.
The technology sector dominates the proportion of stocks on a win streak above the 10-day average, with 59% of their members sustaining above the short-term average for more than 20 sessions, indicating bullish price momentum.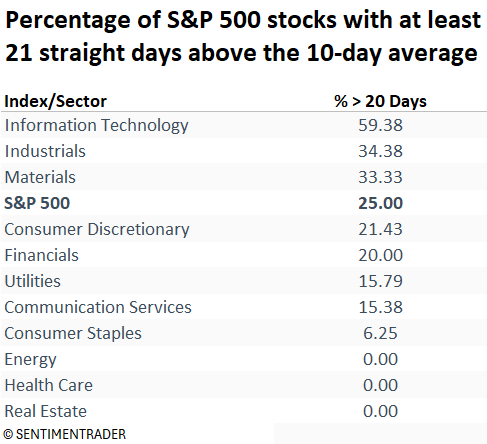
Healthcare drawdown and reversal
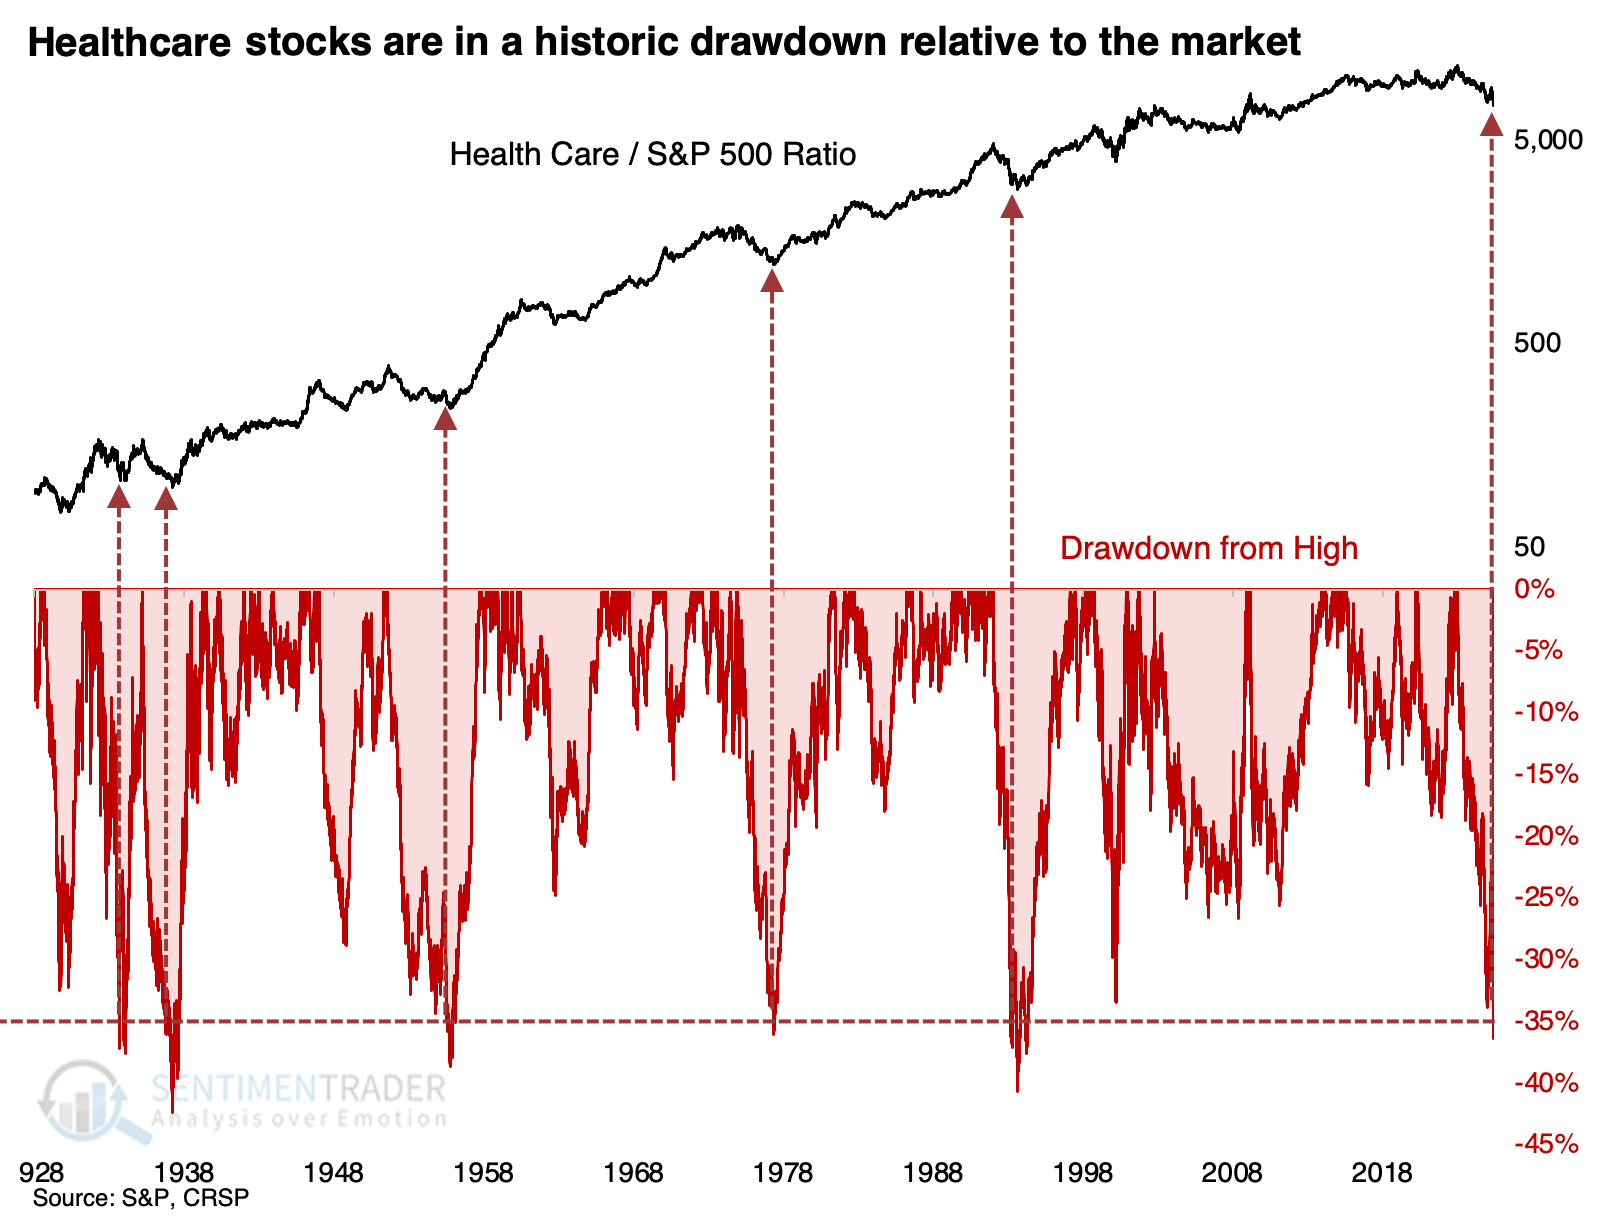
The rally in stocks off the April low has been described as "torrid," relentless," and "broad-based." But that doesn't mean everything has rallied, as investors in the healthcare sector have come to know all too well.
Relative to the S&P 500, the total return on those stocks just hit a -35% drawdown for one of the few times in 100 years. Over the following year, only the 1933 signals witnessed a further drawdown larger than -9%, while the average drawup (maximum gain) neared +22%.
Investors seemed to notice the potential for a snapback last week, as the sector fund XLV dove to a new low on Thursday but then reversed intraday to close in positive territory. In the fund's history, similar reversals occurred only a handful of times, all preceding sustained rallies.
The decline in XLV since its September peak has been fairly harsh, with a major failed rally attempt. The Correlation Pattern Match tool shows similar price patterns, highlighting any similarly-paced period with a correlation higher than +0.80 on a scale of -1.0 to +1.0. XLV had a strong tendency to rally in the months following similar price action.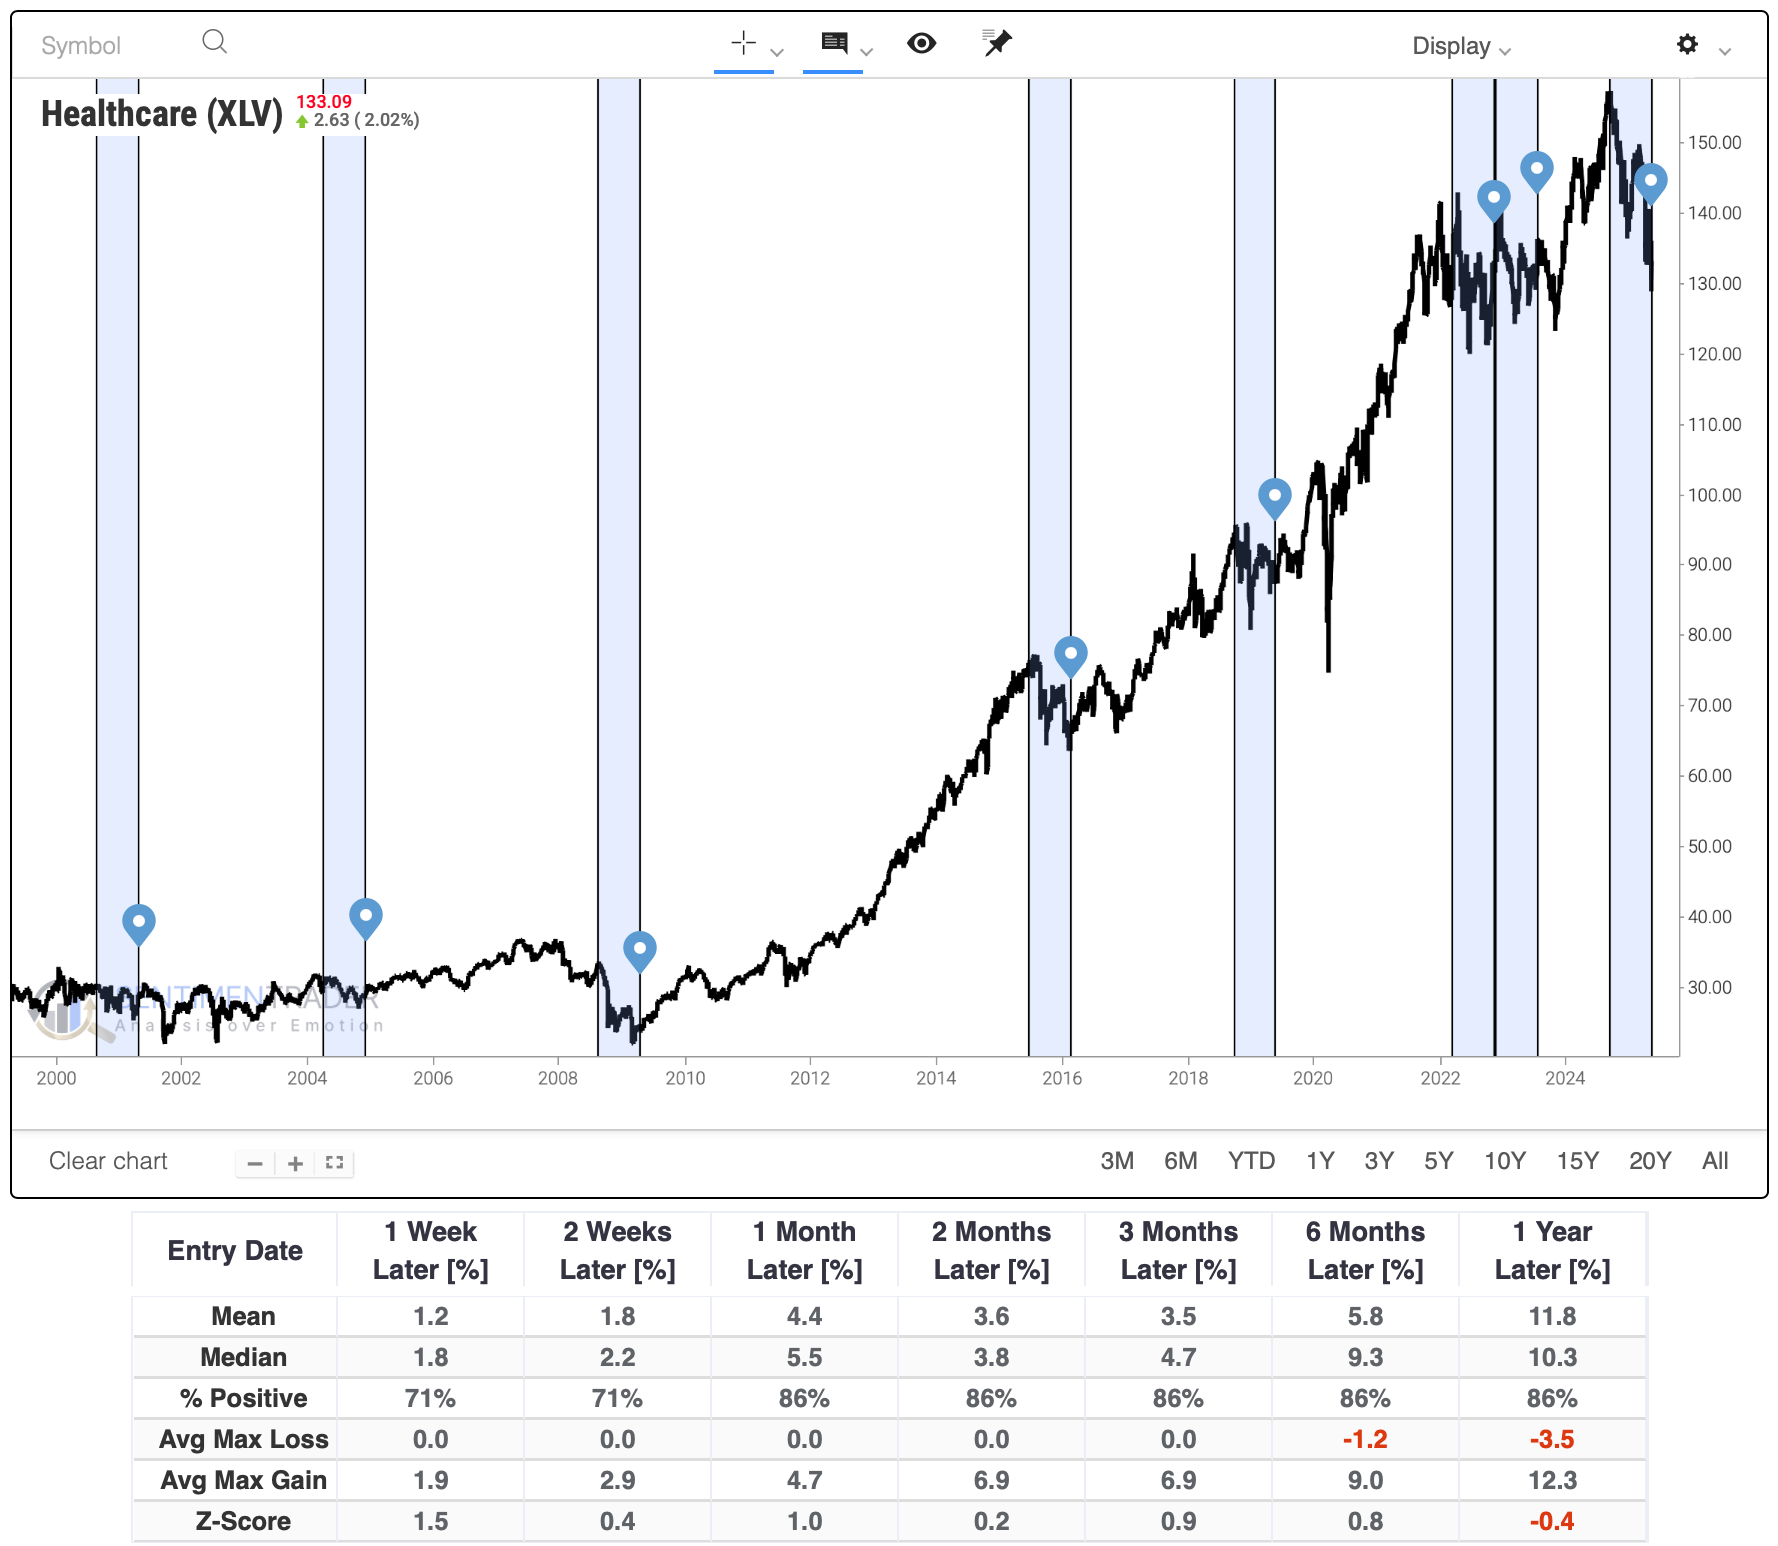
The Trend Score aggregates ten measures of trend based on XLV's momentum and position relative to various moving averages. The Score has been mired at 0 for two straight weeks. Over the life of the fund, further downside has been limited when its trend was so exhaustively negative for two weeks EXCEPT for during the 2008 global financial crisis.
When we combine a rise in buying interest among smart money corporate insiders with a historically low number of sellers, the Buy/Sell Ratio spiked to a level that ties its record going back over a decade. Other times the ratio approached this extreme, XLV did extremely well from two months and beyond (granted, much of the study period was dominated by bull markets).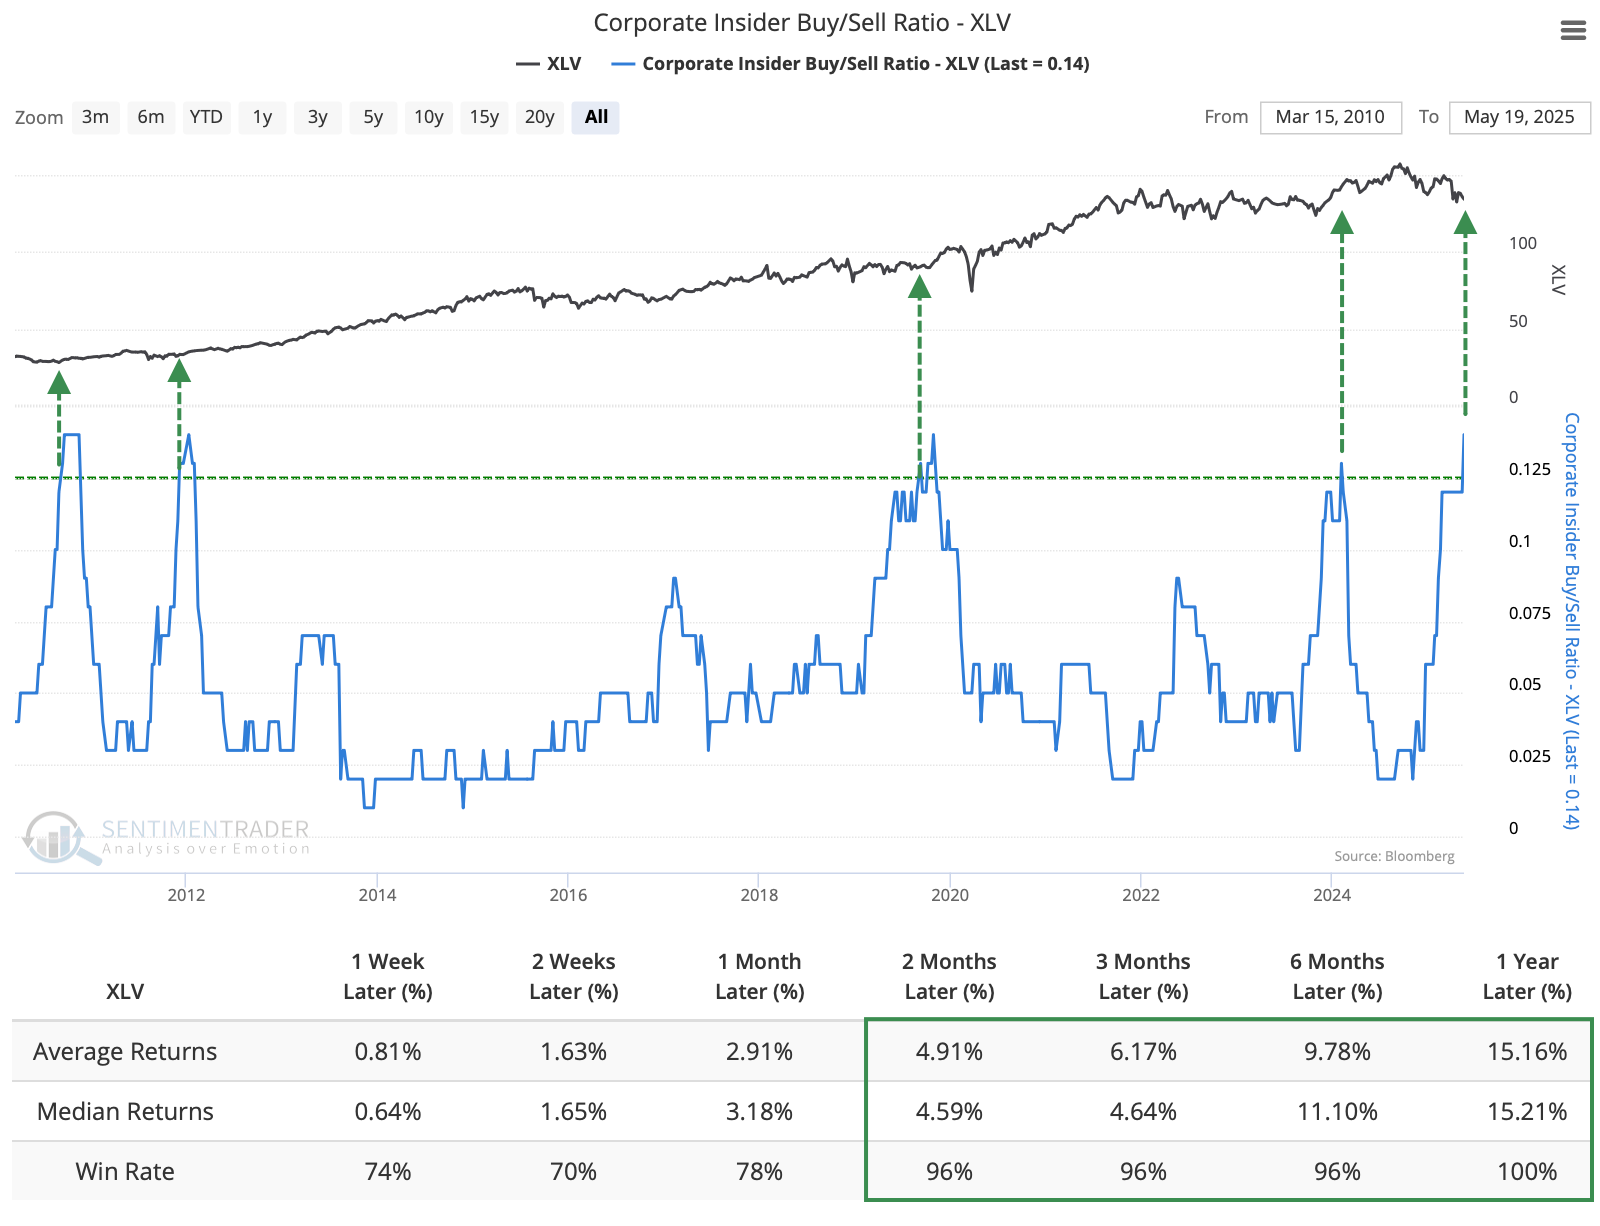
Utilizing an options collar
The options "collar" strategy typically involves buying a put and selling a call against shares of stock you hold. Jay explained that the collar can offer a very low-cost temporary hedge.
A long collar generally involves three positions:
- Long 100 shares of stock
- Long one protective put option
- Short one out-of-the-money call option
The first two elements alone amount to a strategy known as a "married put." With that strategy, buying a put option limits the downside risk. The "collar" strategy adds a short call option to the mix. Selling the call option reduces the cost of the protective put but also temporarily limits upside potential.
Let's illustrate the strategy with an example.
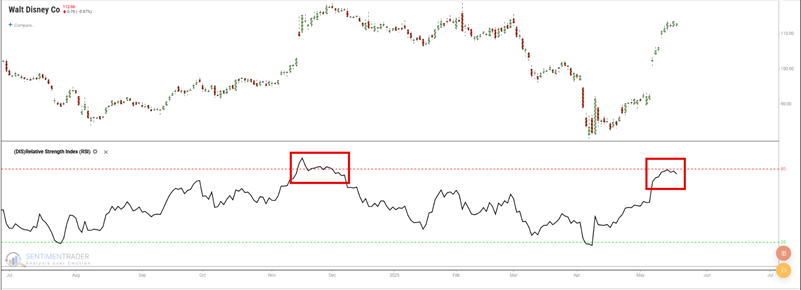
The chart below shows that Disney (DIS) stock has recently rallied 42% in just over a month and that the RSI exceeded 78%, suggesting a very overbought situation. So, let's assume an investor holding 100 shares decides to hedge against a short-term pullback.
Let's start with a collar that focuses on low cost. The quick and dirty approach involves buying a put option with a delta near -40 and selling a call with a delta near 40. However, note that this is often not the ideal hedge. We use it here as a baseline to compare another choice.
In this example, with DIS shares trading at $112.66 a share, an investor could buy one 112 strike price put expiring on June 6 for $1.81 (or $181, as each option is for 100 shares of stock), and sell one 114 strike price call expiring on June 6 for $1.64 (or $161).
- Long 100 shares of DIS trading @ $112.66
- Long 1 June06 DIS 112 put @ $1.81
- Short 1 June06 DIS 114 call @ $1.64
The bottom line in this example is that the investor pays $17 ($181 paid to buy the put and $164 taken in to sell the call) to enter the collar. The figure below displays the particulars (all subsequent screenshots are courtesy of www.Optionsanalysis.com).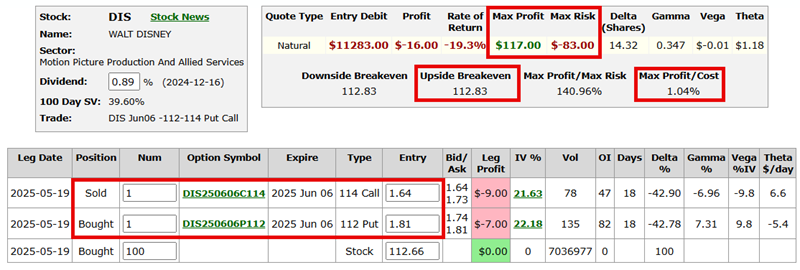
Key things to note:
- To add this collar to an existing long 100 shares position would cost $17
- If we assume that all three legs were entered at once, the cost to enter the position would be $11,283 ($11,266 to buy 100 shares of DIS and $17 for the collar)
- The put entirely offsets any loss for the stock below $112 a share, so the worst-case loss as long as the hedge is held is -$83
- The tradeoff is that if DIS stock moves above the 114 strike price for the call, any gain in the stock will be offset by the short call
- The maximum profit potential while this particular collar is held is just $117
The key attraction of this collar position is the ability to limit maximum risk to just $83. The tradeoff is the elimination of upside potential beyond $114. Also, investors must understand that if DIS does rise above the call strike price of $114, the call may be exercised, and their stock shares could be called away.
Jay further explored a looser collar for the stock and compared them side-by-side to examine costs and benefits.
Seasonal selections
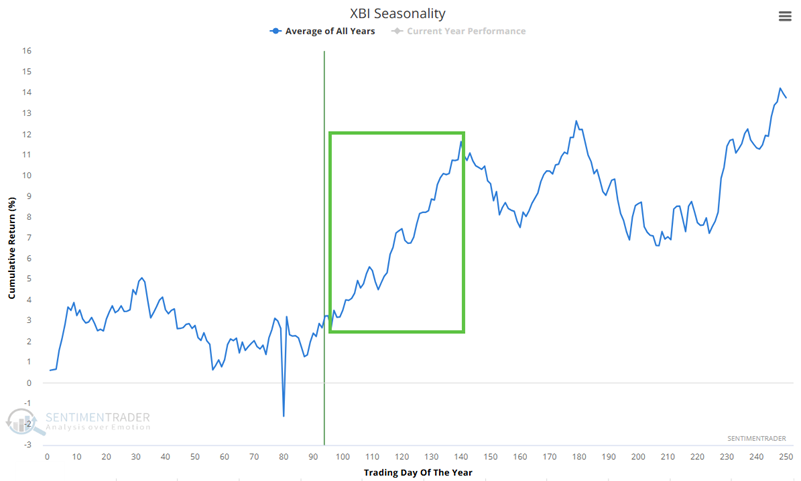
Jay noted that biotech, real estate, technology, and the broad market are entering favorable seasonal periods. Meanwhile, energy and oil & gas stocks may have one last gasp before a solid seasonal downtrend.
The Annual Seasonal Trend chart below for the SPDR S&P Biotech ETF (XBI) shows a favorable period that extends from the close of Trading Day of the Year (TDY) #96 through TDY #140. For 2025, this period extends from the close on 2025-05-21 through 2025-07-25.
The chart below displays the hypothetical growth of $1 invested in XLB only during this period, every year since 2006.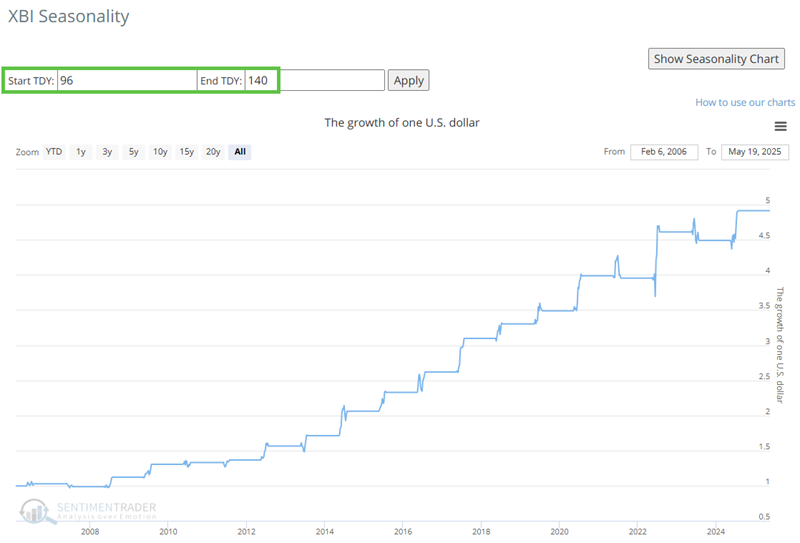
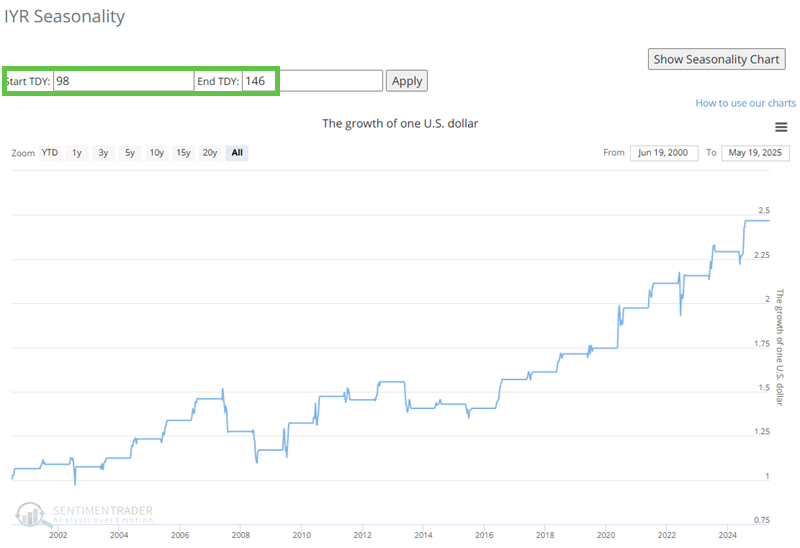
The real estate sector has been trending sideways for two and a half years. Could it be in line for a surprise rally?
The Annual Seasonal Trend for the iShares U.S. Real Estate ETF (IYR) shows a favorable period that extends from the close of Trading Day of the Year (TDY) #98 through TDY #146. For 2025, this period extends from the close on 2025-05-23 through 2025-08-04. The chart below displays the hypothetical growth of $1 invested in IYR only during this period, every year since 2000.
Wheat's weak window
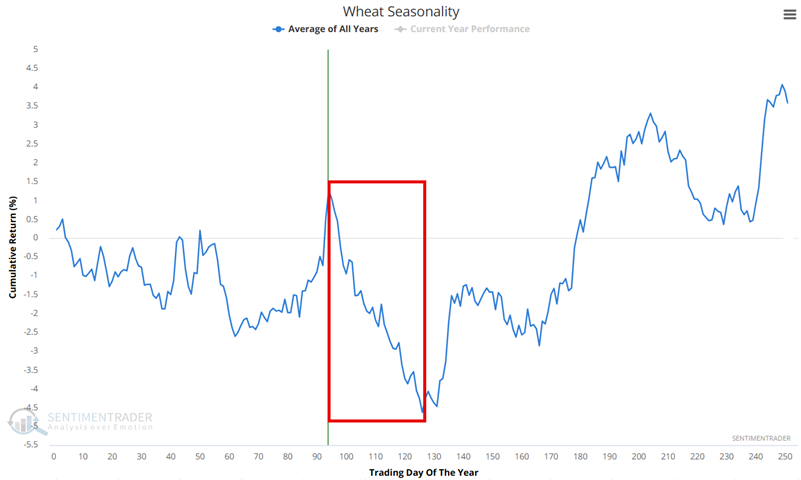
Wheat is one of the most highly cyclical commodities and Jay noted it is entering one of the seasonally weakest periods of the year.
In the long-term charts below, we see that wheat has a long history of making significant advances followed by equally major declines. We also see that this market has been in a significant downtrend for over three years now.
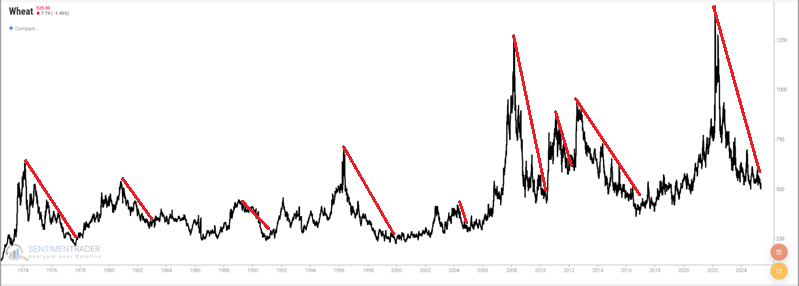
The wheat futures contract is for Soft Red Winter wheat, one of the most highly cyclical markets. Much of this cyclicality is due to the planting cycle, planted in late fall and harvested the following summer.
The chart below displays the annual seasonal trend for Chicago Board of Trade wheat futures. As you can see, this market is entering arguably its weakest time of year, from Trading Day of Year (TDY) #94 through TDY #126. For 2025, this period extends from the close on 2025-05-16 through 2025-07-02.
The chart below displays the hypothetical cumulative $ +(-) from holding a long position in wheat futures only during this period every year since 1937.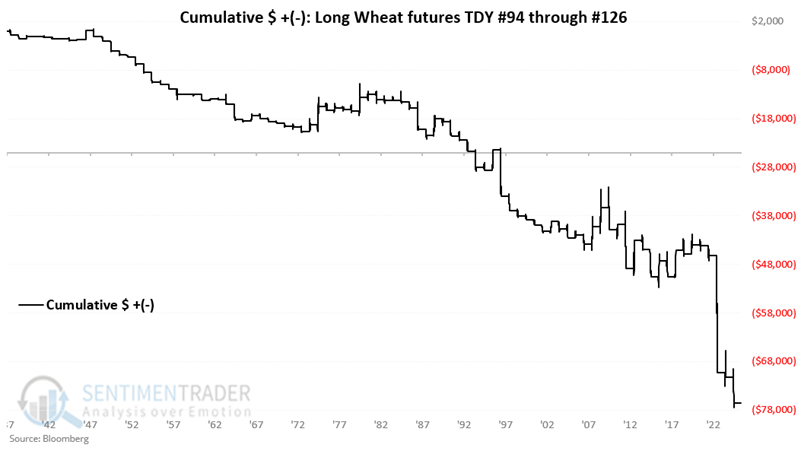
These periods witnessed a gain only 25% of the time, with an average gain and loss that were about even. The contract gained more than +$3,000 eight times while losing more than -$3,000 eleven times.
More seasonal trends
Jay further noted that coffee, copper, platinum, and the US Dollar are all on the cusp of unfavorable seasonal periods, while sugar is about to enter a favorable period.
The Annual Seasonal Trend chart below for Coffee futures shows an unfavorable period that extends from the close of Trading Day of the Year (TDY) #103 through TDY #117. For 2025, this period extends from the close on 2025-05-30 through 2025-06-19.
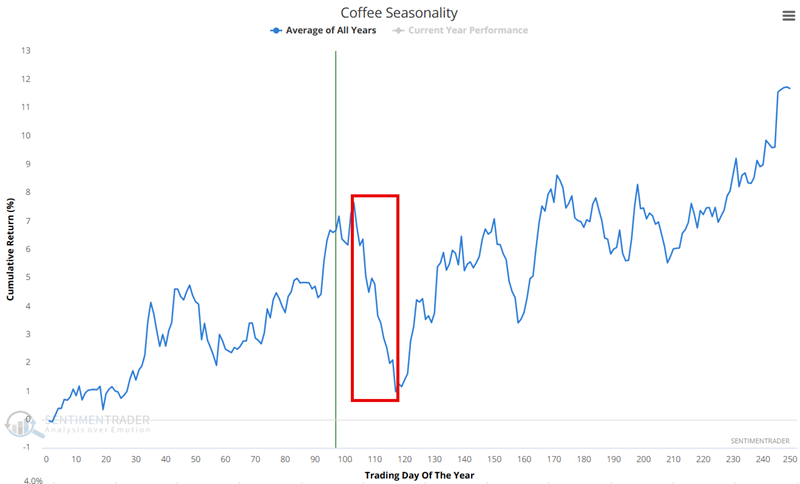
The chart below displays the hypothetical growth of $1 invested in coffee only during this period, every year since 1985.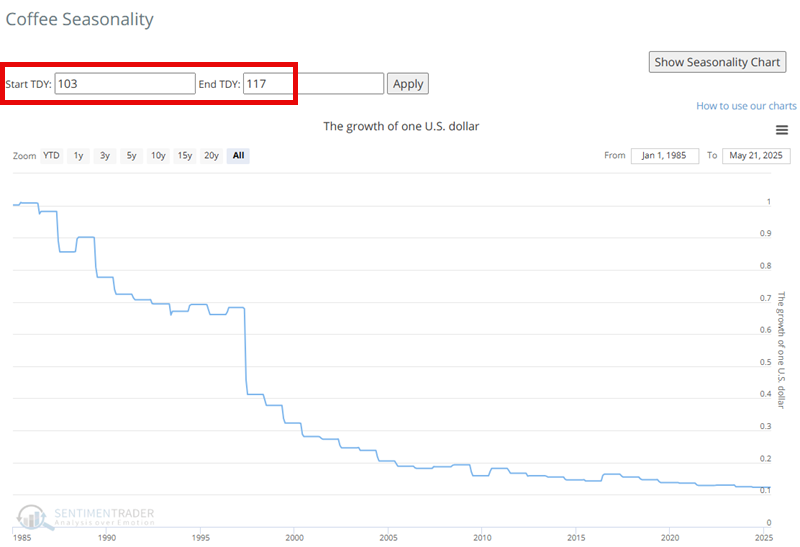
Coffee is coming off a parabolic run to new all-time highs and a massive spike in trader optimism. The chart below displays coffee versus the 100-day moving average for our Coffee Optix indicator. The history of coffee price action following similar occurrences suggests the potential for significant downside.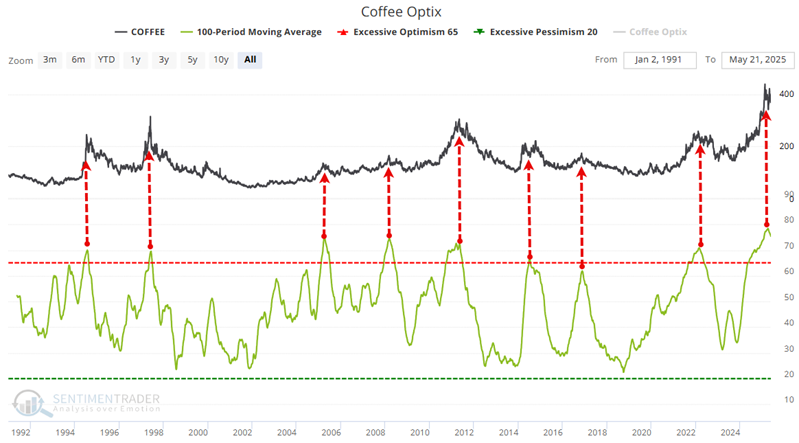
Copper had a terrific run into late March 2025, but has been floundering and consolidating ever since. The Annual Seasonal Trend chart below for copper reveals it is entering a typically challenging period that extends from the close of Trading Day of the Year (TDY) #101 through TDY #122. For 2025, this period extends from the close on 2025-05-23 through 2025-06-23.
Platinum shows an impending unfavorable seasonal window from the close of Trading Day of the Year (TDY) #113 through TDY #128. For 2025, this period extends from the close on 2025-06-09 through 2025-06-30.
Sugar shows an impending favorable seasonal window that extends from the close of Trading Day of the Year (TDY) #105 through TDY #125. For 2025, this period extends from the close on 2025-06-03 through 2025-07-02.
The Annual Seasonal Trend chart below for the US Dollar shows an unfavorable period that extends from the close of Trading Day of the Year (TDY) #103 through TDY #151. For 2025, this period extends from the close on 2025-05-26 through 2025-07-31.
About TradingEdge Weekly...
The goal of TradingEdge Weekly is to summarize some of the research published to SentimenTrader over the past week. Sometimes there is a lot to digest, and this summary highlights the highest conviction or most compelling ideas we discussed. This is NOT the published research; rather, it pulls out some of the most relevant parts. It includes links to the published research for convenience, and if you don't subscribe to those products, it will present the options for access.