
TradingEdge Weekly for May 22 - S&P strength continuation, large-cap outperformance, market breadth warnings, seasonal opportunities

Key points:
- Stacked Nasdaq breadth warnings and crumbling S&P 500 participation signal elevated near-term downside risk
- Composite risk-off models and cyclical divergences highlight a fragile market environment despite index highs
- Historical data confirms that seven straight up weeks for the S&P 500 typically beget more strength
- Extreme small-cap relative washouts have historically resolved with large-cap outperformance, not small-cap reversals
- Utilities face a severe momentum breakdown with historical precedents pointing to near-term downside
- The JK Misery Index combines mortgage rates, inflation, and unemployment to flag economic extremes above a 35 threshold
- Seasonal trends present favorable windows for Biotech (XBI) and the Nasdaq 100 Index (QQQ) through mid-summer
House view:
- Stocks:
- Short-term: Modestly bearish. U.S. equities initially dipped before steadily rebounding into a high-level consolidation phase, with major indices tracking firmly above their key moving averages. The energy market remains the eye of the storm for current sentiment volatility, warranting strict vigilance against sudden black swan events. Furthermore, analysts have highlighted the underlying risk of a potential market pullback (read more here and here). This time frame covers 1-4 weeks.
- Intermediate-term: Bullish. Market momentum (71.4) has improved significantly, signaling a return to risk-on sentiment. The medium-term outlook remains constructive, with equities supported by a favorable macro backdrop of falling energy prices. Small-cap stocks, which are highly sensitive to interest rates, have significant room for valuation recovery if yields stabilize or decline further. This time frame covers 1-5 months.
- Long-term: Bullish. U.S. economic resilience persists relative to global peers. Long-term breadth indicators across sectors and global markets show no significant downside, typically signaling positive returns for most stock indices over the next 6 to 12 months. This time frame covers 6-12 months.
- Overweight: Small-cap stocks and cyclical sectors that benefit from falling energy costs and stable interest rates
- Underweight: Interest rate-sensitive sectors without strong earnings visibility, speculative tech names lacking AI integration
- Maintain exposure to high-quality tech while increasing allocation to value and cyclical sectors to balance the portfolio
- Bonds: Long-term cycles remain bearish. The U.S. Treasury market experienced wild swings, with yields briefly spiking to multi-month highs. The subsequent reversal in the 10-year yield reflects the market's extreme sensitivity to oil price trajectories, as falling energy costs alleviated inflation concerns. The strong positive correlation between oil prices and Treasury yields remains a critical market dynamic that warrants close monitoring.
- Commodities:Commodities displayed extreme volatility, with energy markets experiencing a dramatic intraday reversal while precious metals traded sideways.
- Crude Oil: Oil prices soared in the morning on geopolitical tensions before collapsing in the afternoon due to profit-taking and macro adjustments. The market remains highly sensitive to Middle East developments, with volatility expected to persist until a substantive peace agreement is reached. The Strait of Hormuz shipping situation continues to be the primary supply-side driver.
- Gold & Silver: Precious metals traded sideways near recent lows, pressured by rising Treasury yields and a strong dollar. Precious metals' upward momentum remains constrained amid stable inflation expectations and strong risk appetite.
- Crypto: We follow several simple systems for U.S.-traded bitcoin, which we consider the equivalent of the S&P 500 for crypto. Amid the market's paradigm shift to real assets and fiat credit doubts, crypto assets face valuation revaluation pressure from tech stock sell-off contagion, but long-term fundamental support from tokenization remains. Market volatility rises with the overall financial market, and short-term price performance is dominated by risk appetite shifts, with structural opportunities tied to institutional adoption and underlying technology innovation.
- Triple 40: Bullish → Bearish
- RSI Momentum: Bullish
- Trend and Relative Trend: Bearish
- PMI: Bullish
- M2 ROC: Bearish
- Notable Moves in Global Markets:
- South Korea: The KOSPI index exploded higher with an extraordinary single-day gain, driven by the resolution of the Samsung strike crisis. The removal of this major uncertainty triggered a massive influx of international capital, providing a significant boost to the country's stock market and semiconductor sector.
- Japan: The Nikkei continued its strong upward trend, breaking through key psychological levels. While equity markets remained robust, currency volatility persisted as the yen came under renewed pressure. The stock market's performance was supported by global tech sentiment and domestic liquidity conditions.
- Europe: European equities showed minimal gains amid disappointing economic data, with manufacturing and services PMIs falling short of expectations.
Where we're at
Most investors have the most riding on equities. We feel that the most significant determinants of success for investors are whether to adjust their allocation to that asset class based on factors that have historically had a good record of preceding above- or below-random returns in the months ahead.
Those factors include the probability of a looming recession, sentiment, price action, volatility, breadth, and the bond market. The chart below summarizes the main indicators and composite models we watch for those factors, and they're mostly in bullish regimes. Valuations are not part of these factors since the relationship has been too inconsistent on time frames under one year.
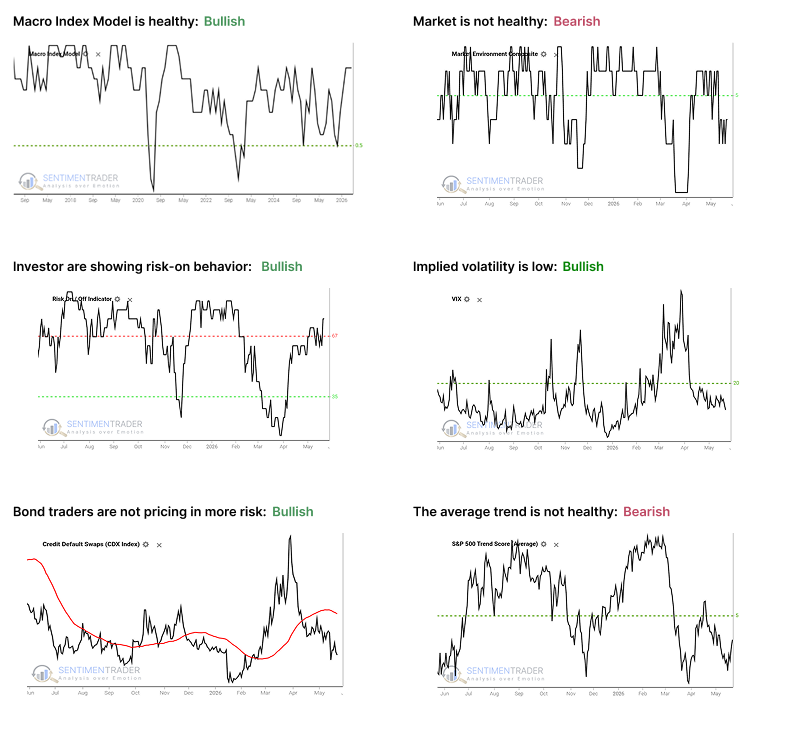
- The Macro Index Model is above the 50% threshold, which has been a vital level as outlined here.
- The Market Environment has slipped into an unhealthy condition. Future returns, especially for higher-beta indices, have historically been notably weaker, with greater risk, when the environment is unhealthy as outlined here.
- The Risk On / Off Indicator shows that investors are still in risk-on mode. This has been a good sign for future returns as outlined here.
- Implied volatility remains below 20, showing a calm environment. The S&P 500 has perfomed well when this is the case as outlined here.
- Credit default swap spreads are below their 50-day moving average, which drastically improves stock returns as outlined here.
- A composite of trend measures in the average S&P 500 stock have dropped below 5, which shows weak trend conditions.
Stacked Nasdaq Warnings and Crumbling S&P Participation Signal Downside Risk
Last week's NASDAQ Hindenburg Omen and Titanic Syndrome triggers have clustered into eight combined warnings over three weeks. When the three-week rolling sum of combined warnings crosses above seven, historical data shows the Nasdaq Composite annualized at -24%, compared to nearly +18% annualized returns when warnings sit at zero.
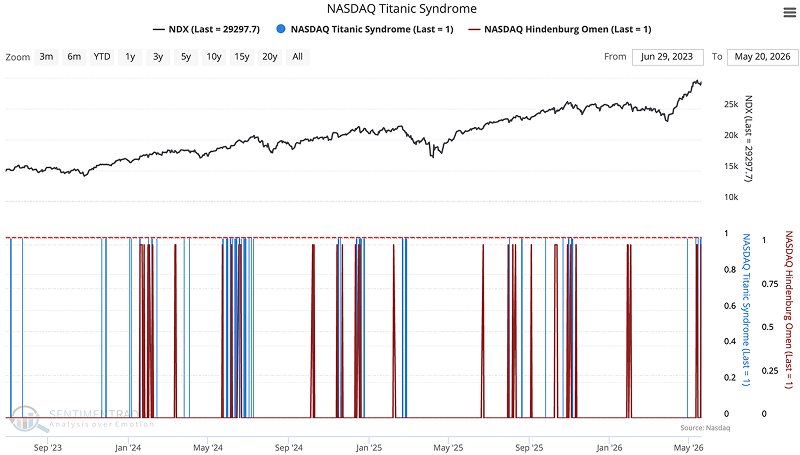
Following the 37 historical instances where the three-week sum cycled from zero to eight or more, forward returns showed almost no positive edge. One month later averaged -0.3%, six months averaged -2.4%, and one year out averaged +0.2%. The S&P 500 fared slightly better but still struggled, averaging just +2.7% a year out with wide average losses exceeding 7%.
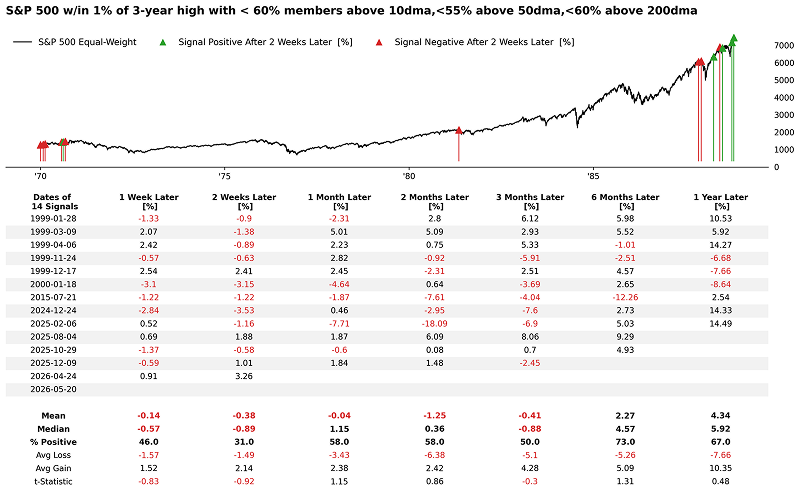
Beneath the surface of the S&P 500's recent high, participation is crumbling. Fewer than 60% of SPX members are above their 10-day, 50-day, and 200-day moving averages. When the index sits within 1% of a three-year high with such weak breadth, two-week forward returns are higher only 31% of the time, and one-month returns are flat with a hit rate barely above 50%.
Internal Divergences and Composite Risk-Off Models Flash Caution
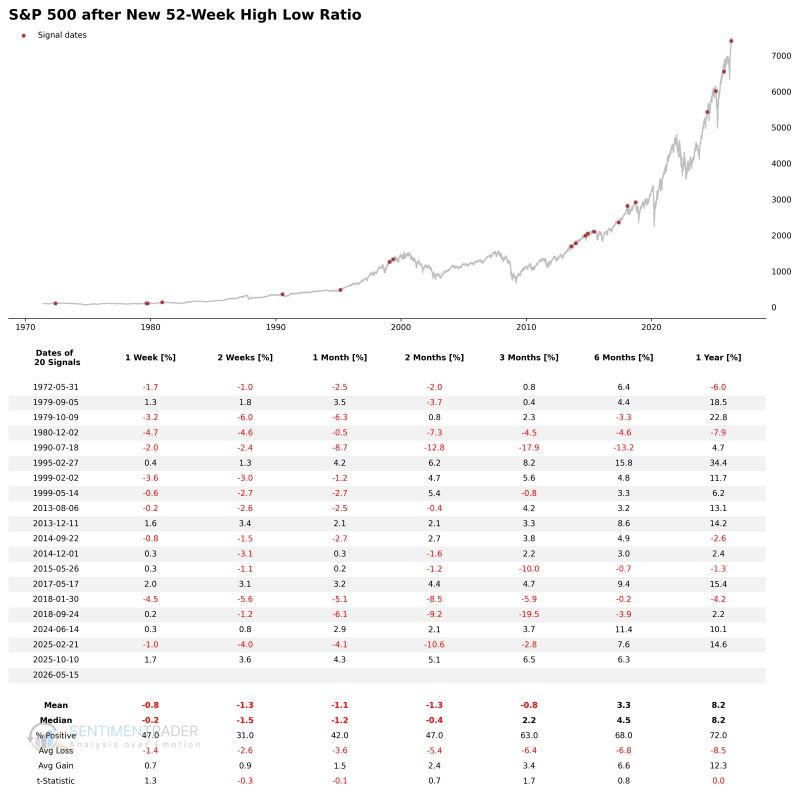
Two additional sub-components of the S-TCTM-the NYSE 52-Week High-Low Ratio and the Important Cyclical Groups Divergence Model-have flashed tactical risk-off signals. The NYSE High-Low Ratio model triggers when new lows exceed new highs by 1.5x or more near a 252-day high. Historically, forward performance across all timeframes is sub-par, with particularly weak win rates in the immediate two-week window.
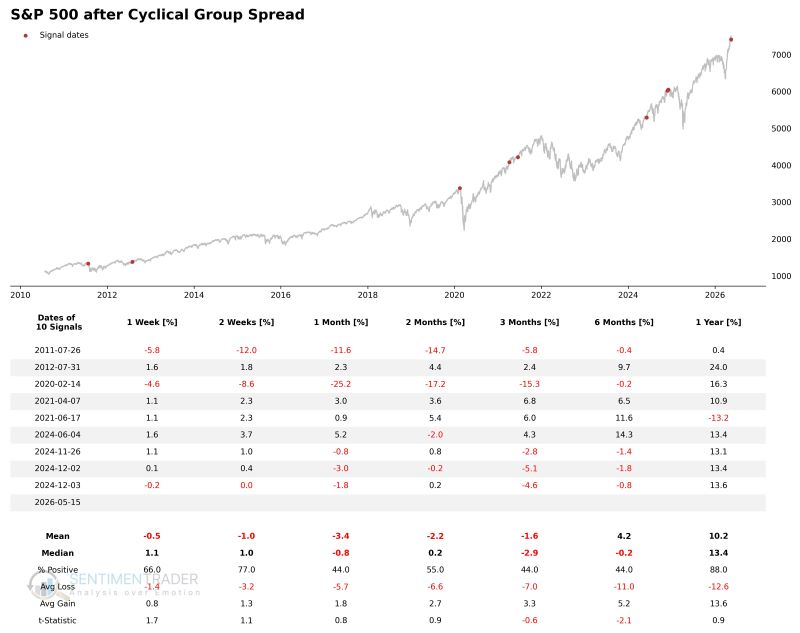
Simultaneously, the Important Cyclical Groups Divergence Model has triggered, measuring average drawdowns from 252-day highs across Autos, Transports, Homebuilders, Consumer Discretionary, Financials, Industrials, and Small Caps. This divergence typically precedes highly unfavorable risk periods concentrated within the one-to-six-month window.
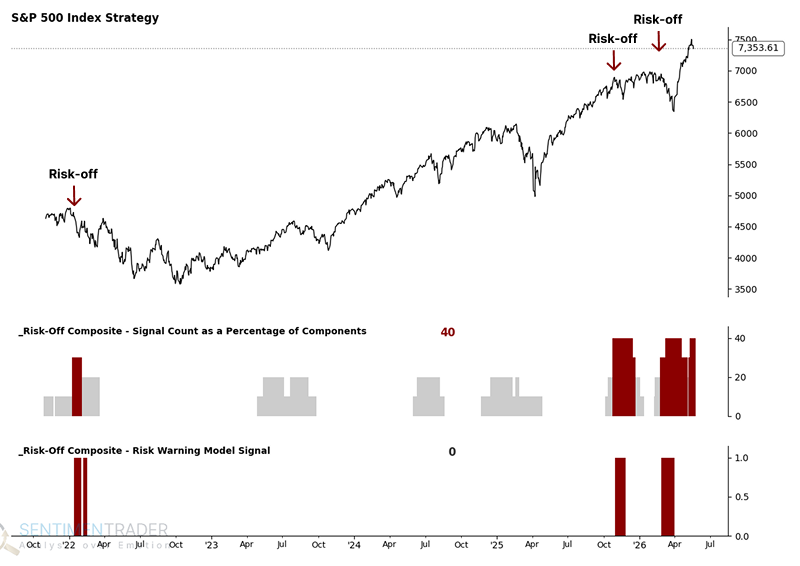
While the overarching Composite Risk Warning Model hasn't issued a formal systemic alert, the elevated signal count currently sits at 40%. This warrants heightened vigilance, tight risk management, and strict stop-loss adherence.
Historical Data Confirms Seven Straight Up Weeks Tend to Beget More Strength
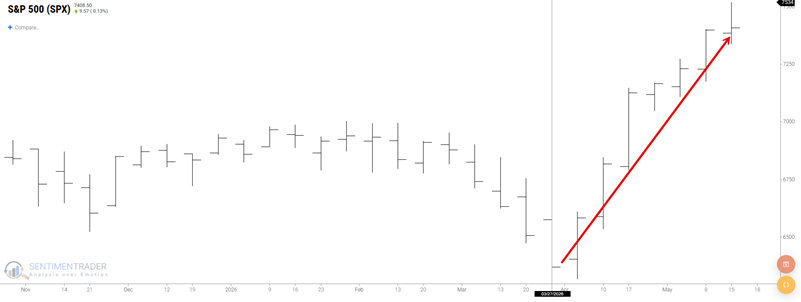
The S&P 500 registered its seventh consecutive up week on May 15th, soaring 16.3% from late March lows. While some fear a blow-off top, historical data from 1928 shows this setup actually favors continued upside. Three months following such a streak, the market shows an 81% win rate with a mean return of 3.9%, well above the baseline for all three-month periods.
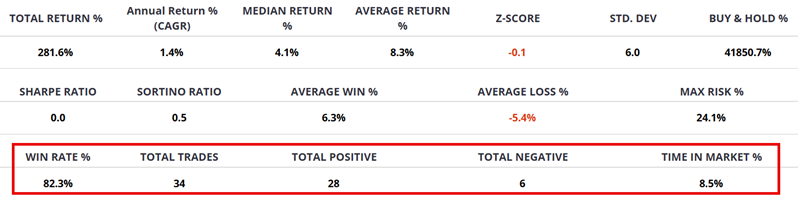
Testing 'Seven Up Weeks (with a 3-month holding period)' as a standalone strategy reveals an 82.3% win rate across the dataset, spending only 8.5% of the time in the market. The hypothetical cumulative performance shows a steady upward trend, with only one instance in modern history triggering a 12% stop-loss.
Extreme Small-Cap Relative Washouts Historically Favor Large-Cap Outperformance
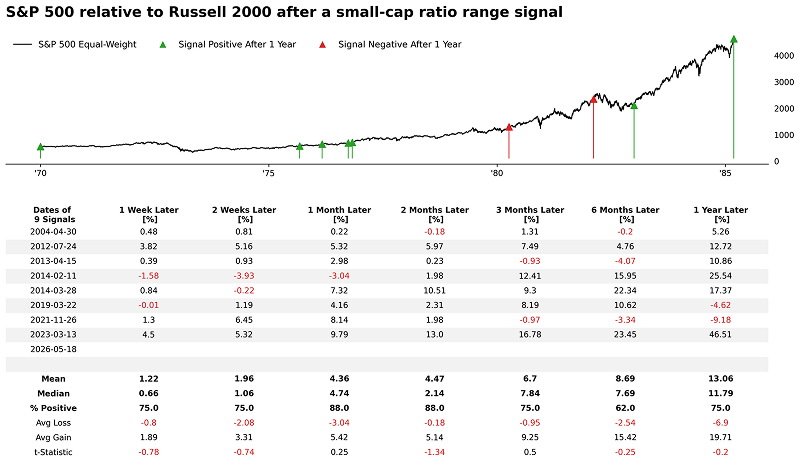
The Small Cap / S&P 500 Relative Ratio Rank collapsed from above 95 to below 15 in just 21 trading days. Historically, this broad signal preceded a higher S&P 500 one year later 83% of the time, averaging a 10.6% gain. When filtering for extreme speed (completing within 21 days), the S&P 500 was higher one month later 100% of the time (eight for eight), averaging a 3.9% gain.
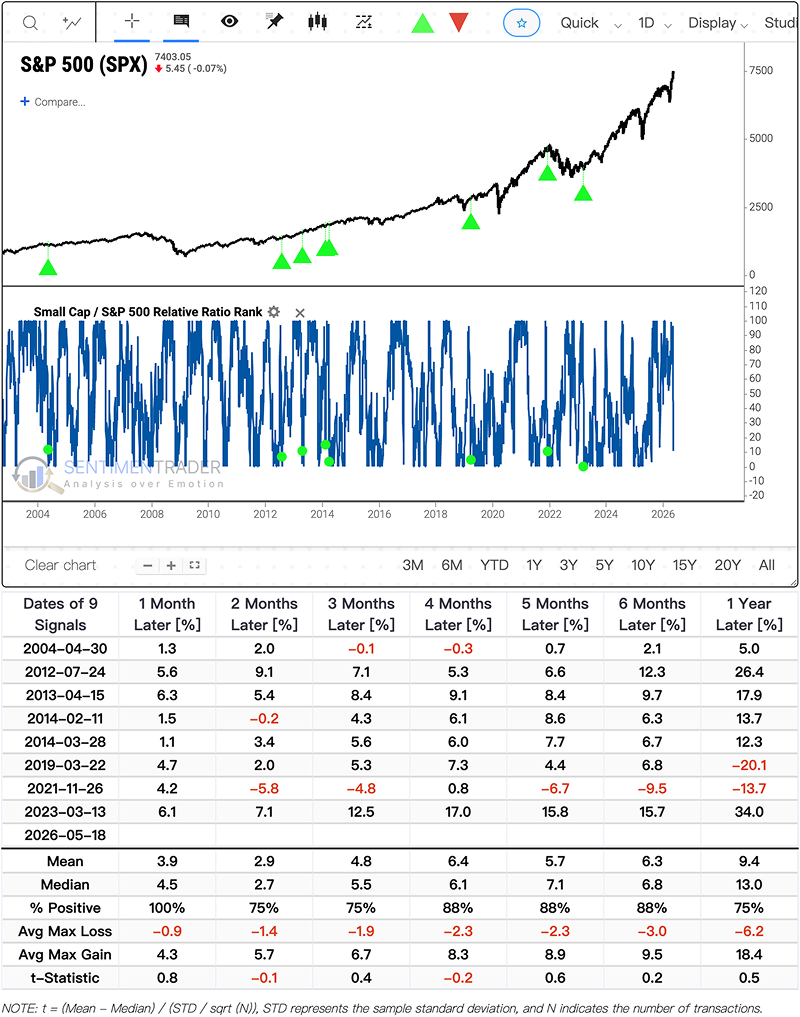
Counterintuitively, while small caps did recover, large caps recovered significantly more. The S&P 500 averaged 9.4% one year later versus 5.8% for the Russell 2000. The relative spread favored the S&P 500 88% of the time one month out, averaging 4.4%. This rapid washout is driven by tariff shocks to export-oriented small caps and capital concentration in AI-driven mega caps, not systemic credit stress. In this environment, recovery flows to stronger balance sheets and deeper liquidity, not recently battered small caps.
Utilities Sector Faces Severe Momentum Reversal and Historical Downside Risk
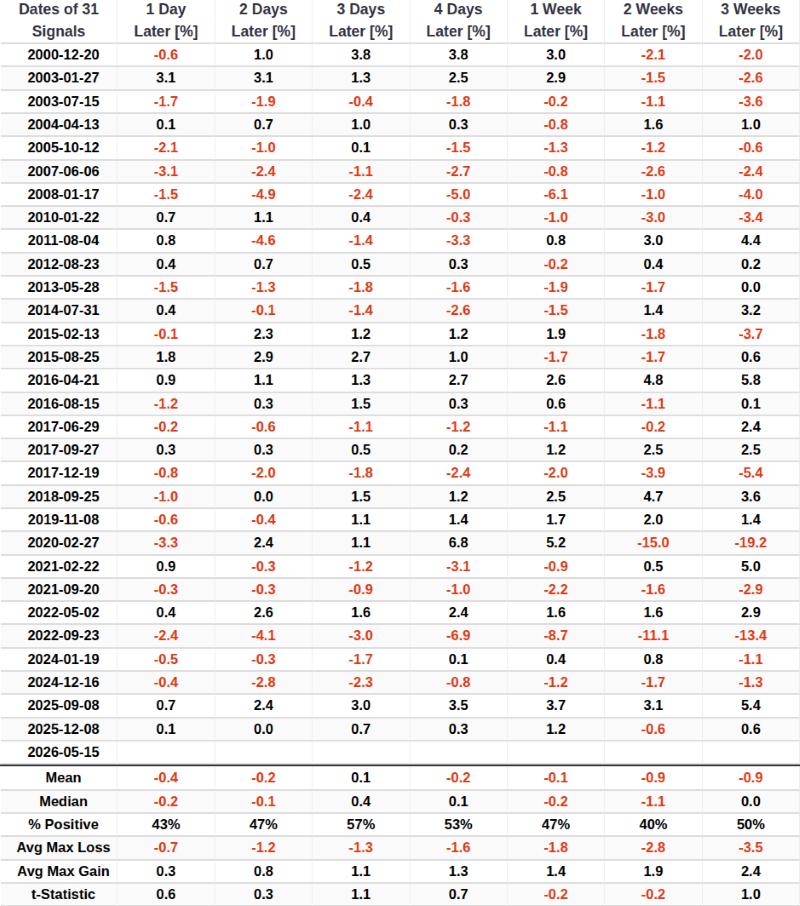
The Utilities sector (XLU) RSI plummeted to 34.32, breaking the critical 35 threshold. Following historical instances where XLU's RSI reversed from above 70 to below 35, the sector exhibits acute near-term downside risk, consistently posting poor two-week returns and suppressed win rates.
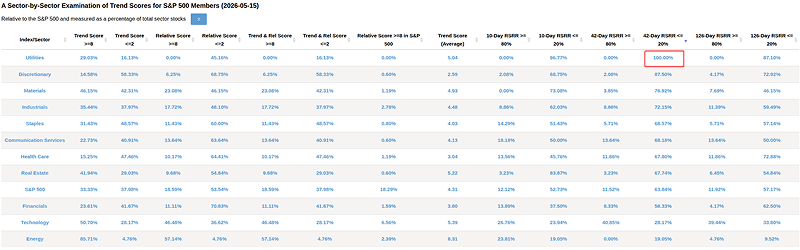
Beneath the price action, structural weakness is severe: 100% of XLU constituents have a 42-day relative strength range rank of 20% or lower. Internal breadth has completely washed out, with fewer than 10% trading above their short- and medium-term moving averages. This breakdown is compounded by capitulation-style fund outflows dropping to lowest levels since June 2025, alongside historically negative seasonality for the month of June.
Introducing the JK Misery Index as an Economic Extremes Gauge
The JK Misery Index (JMI) builds upon the traditional inflation/unemployment metric by adding a 30-year mortgage rate component, recognizing housing trends as a vital economic barometer. The raw index combines these three factors and is compared against a 14-month exponential moving average to identify trend extremes.
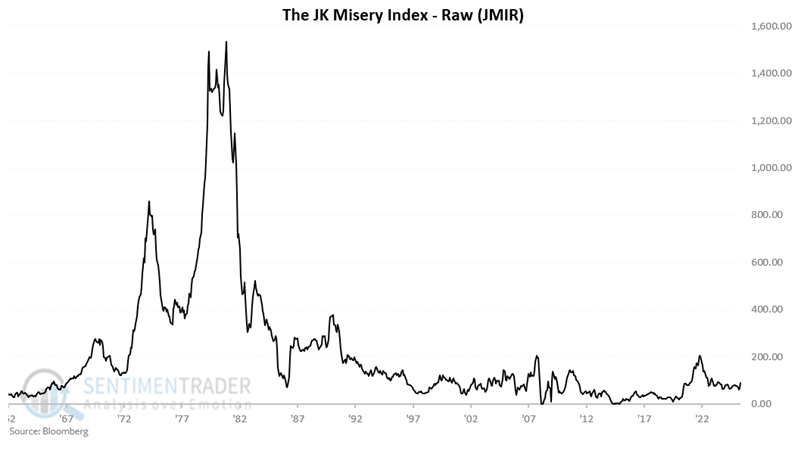
The critical threshold is 35. Readings below 35 are historically favorable for stocks, while readings above 35 have consistently preceded sub-par market performance. After the index crossed above 35, S&P 500 returns across all timeframes fell significantly below historical averages, though not every instance triggered an immediate bear market. The index currently remains below the warning threshold but is trending upward, warranting close monitoring.

Favorable Seasonal Windows Open for Biotech and Nasdaq 100
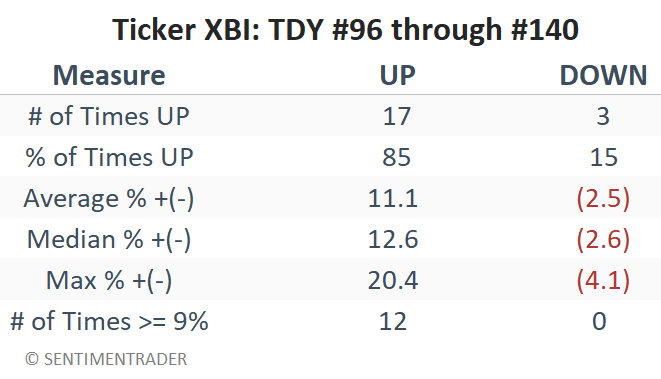
The SPDR S&P Biotech ETF (XBI) enters a seasonal sweet spot from May 20th through July 24th. Historically, this window shows an 85% win rate, with major positive outliers heavily outweighing major losses, suggesting a favorable reward-to-risk setup for the next two months.
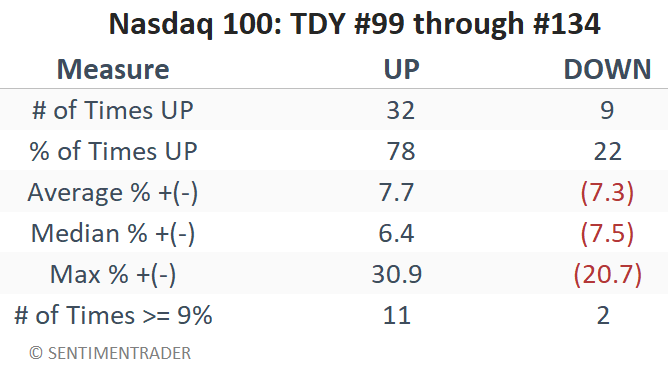
Similarly, the Nasdaq 100 Index (QQQ) approaches a typically favorable period from late May through mid-July. Since 1985, long-only exposure during this window has yielded positive median returns with a solid win rate, though traders must remain mindful of risk management given historical volatility during early-2000s cycles.
About TradingEdge Weekly...
The goal of TradingEdge Weekly is to summarize some of the research published to SentimenTrader over the past week. Sometimes there is a lot to digest, and this summary highlights the highest conviction or most compelling ideas we discussed. This is NOT the published research; rather, it pulls out some of the most relevant parts. It includes links to the published research for convenience, and if you don't subscribe to those products, it will present the options for access. For a visual breakdown of this report, please click here to watch the companion video.