
TradingEdge Weekly for May 2 - Ebbing volatility, peak panic, bond breadth thrust

Key points:
- After a historically volatile period, the S&P 500's daily returns are settling down
- Investors rushed into Walmart stock as a safe haven against volatility and economic uncertainty
- Several months in 2025 are favorable in the 20-year cycle
- According to the Typical Sentiment Cycle, panic may have peaked
- Using trend tools on the website to find stock and sector strength
- HIgh-yield bonds enjoyed a breadth thrust, too
- For only the 3rd time in 50 years, gold is 100x silver
Relaxing range
The S&P 500's 10-day moving average of daily returns dipped below 2%, reflecting diminished volatility. Dean showed that similar contractions in volatility suggest a more favorable backdrop for stocks, especially since 1942.
A TCTM Composite Washout Model component, which measures price volatility by calculating the absolute value of daily S&P 500 returns and smoothing it over ten days, surged to the 5th-highest level in over 80 years and subsequently dropped below 2%, triggering an alert.
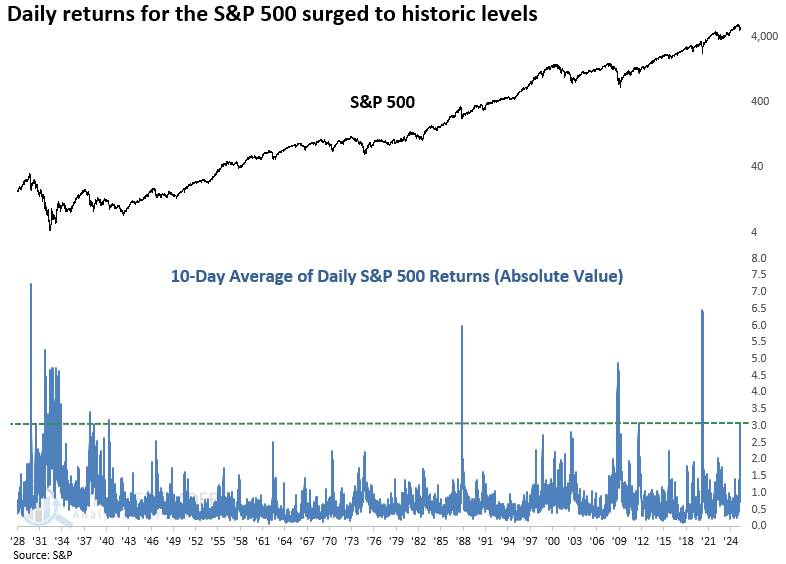
Whenever the absolute value of S&P 500's daily returns, smoothed by a 10-day average, rose above 2% and then dipped below that threshold, returns and win rates for the world's most benchmarked index were generally positive, though not emphatically bullish. Recent instances, however, have produced a more encouraging trend.
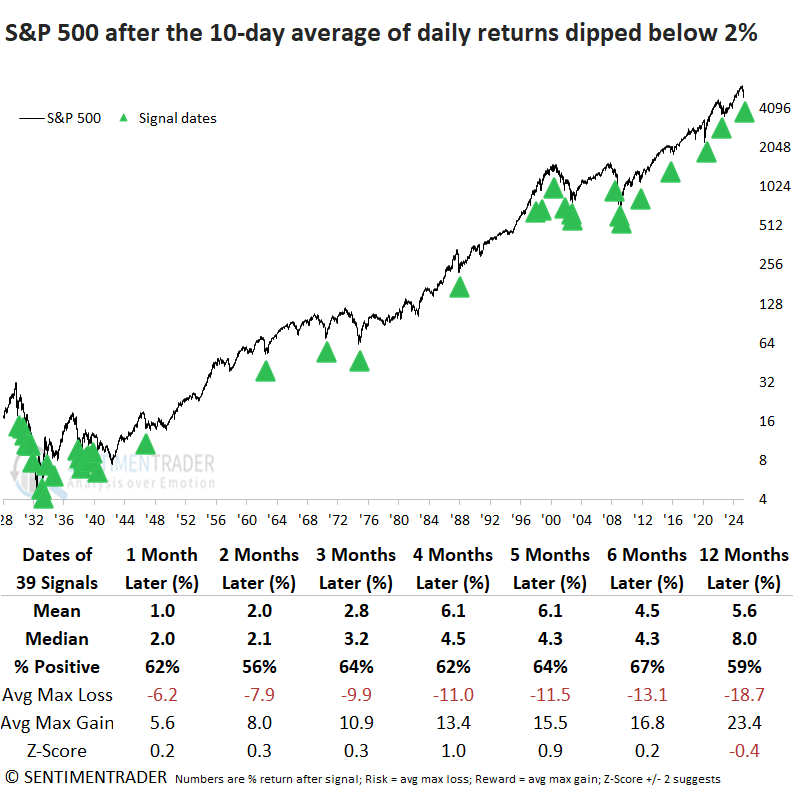
Post the 1929-42 secular bear market period, a contraction in daily return volatility led to performance and consistency that surpassed historical averages across all study periods, ranging from one to twelve months.
Following the new component alert, the washout model's signal count climbed to 30%. Given the recent rally and because several components require a divergence, a composite signal would only emerge if the S&P 500 revisits the April 8 low, with fewer stocks making new lows or registering an oversold condition.
Walmart rush
When times are uncertain, consumers pull back. They buy fewer things and try to spend less, making retailers like Walmart uncommon beneficiaries during difficult times.
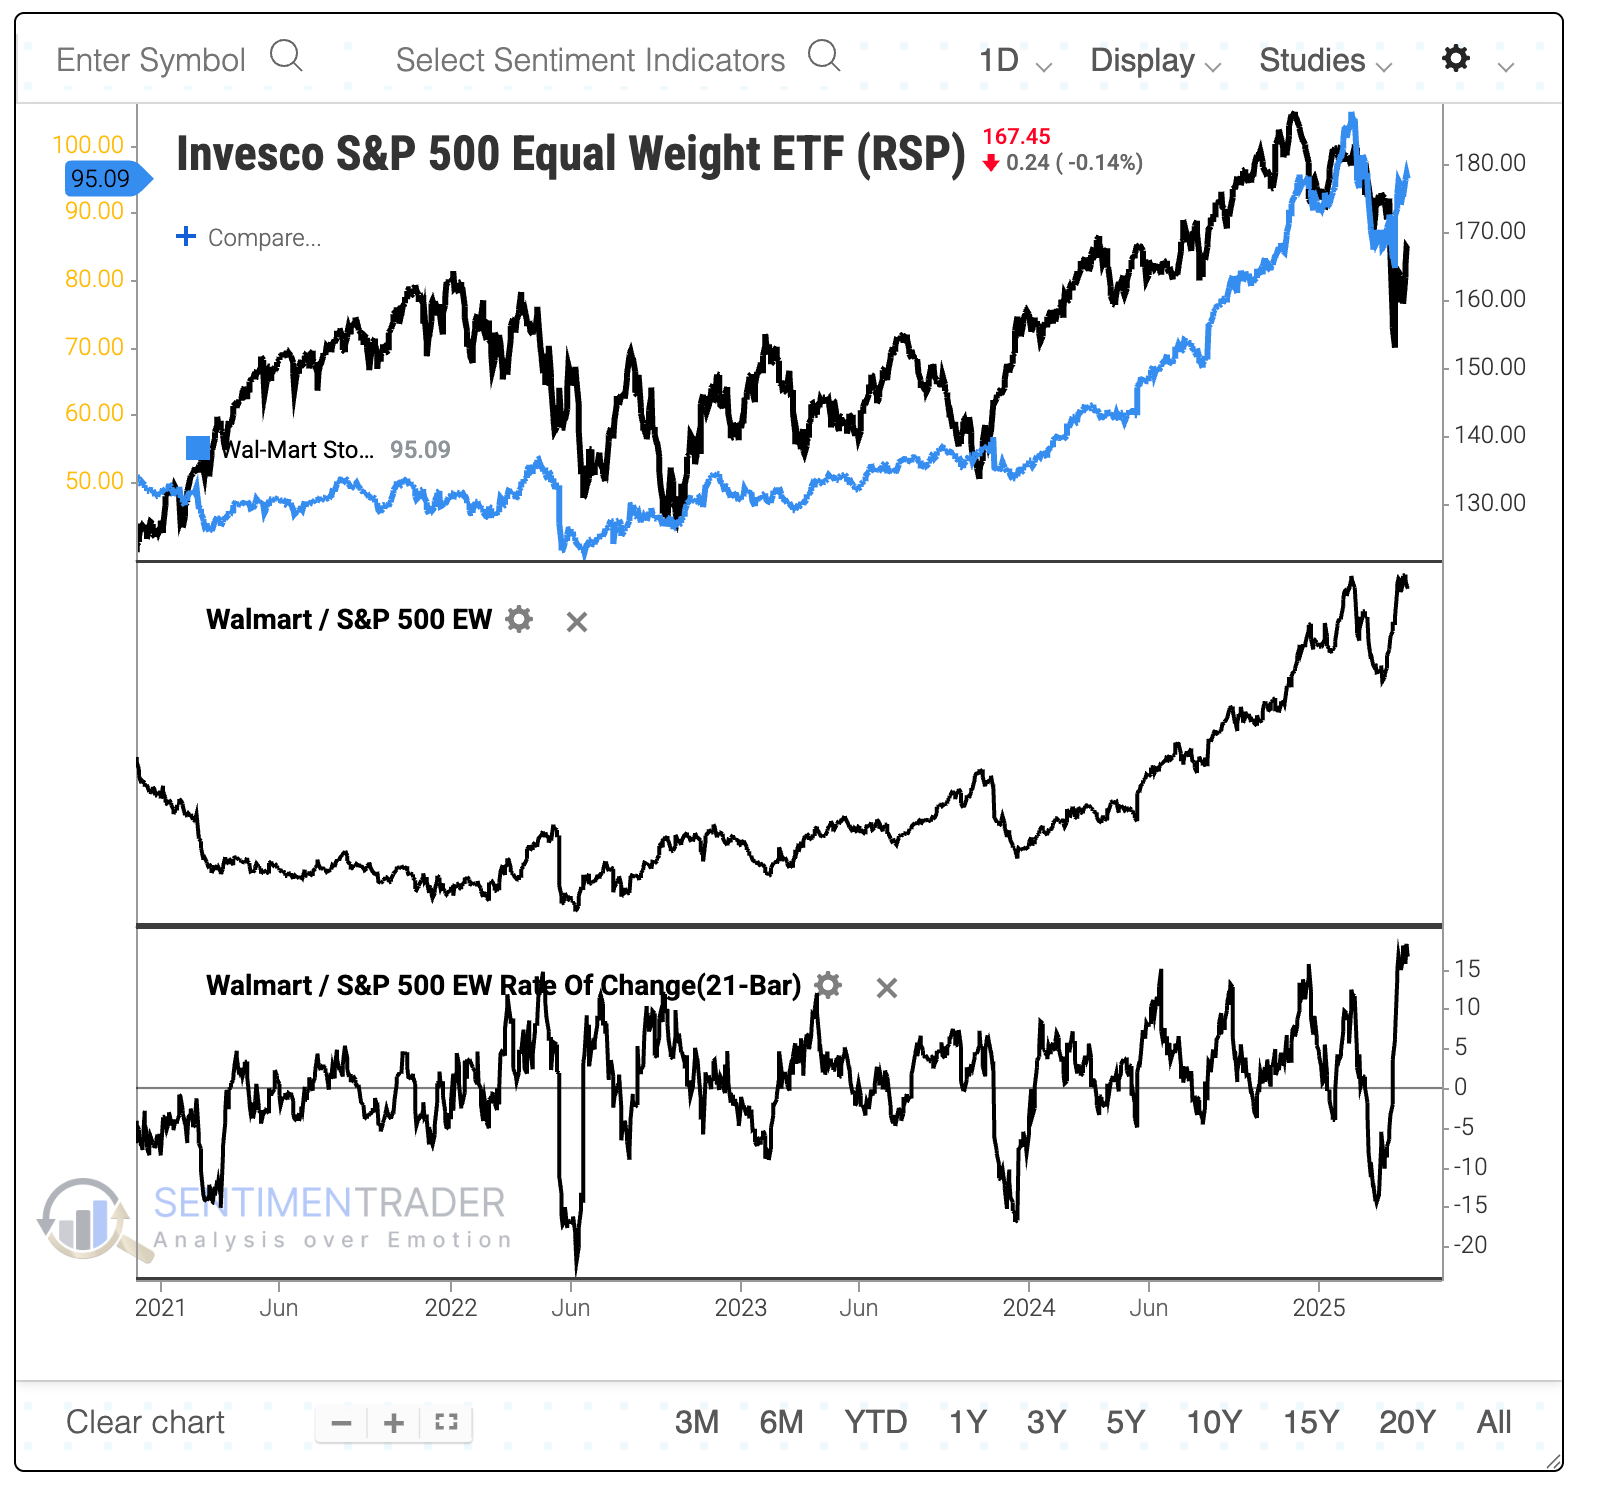
Relative to the average stock in the S&P 500, Walmart stock has soared. As stocks plunged into last week, Walmart held up, pushing the ratio between Walmart stock and the S&P 500 equal-weight ETF (RSP) to the highest level since 2009. The one-month rate of change in the ratio neared 20%, hinting at panic.
The table below shows instances since Walmart list on the NYSE in 1972, and it's evident that the equal-weight S&P tended to suffer in the short term. Regardless, the average stock did well over the following 6-12 months with a median 12-month return of +24% and only one minor loss.
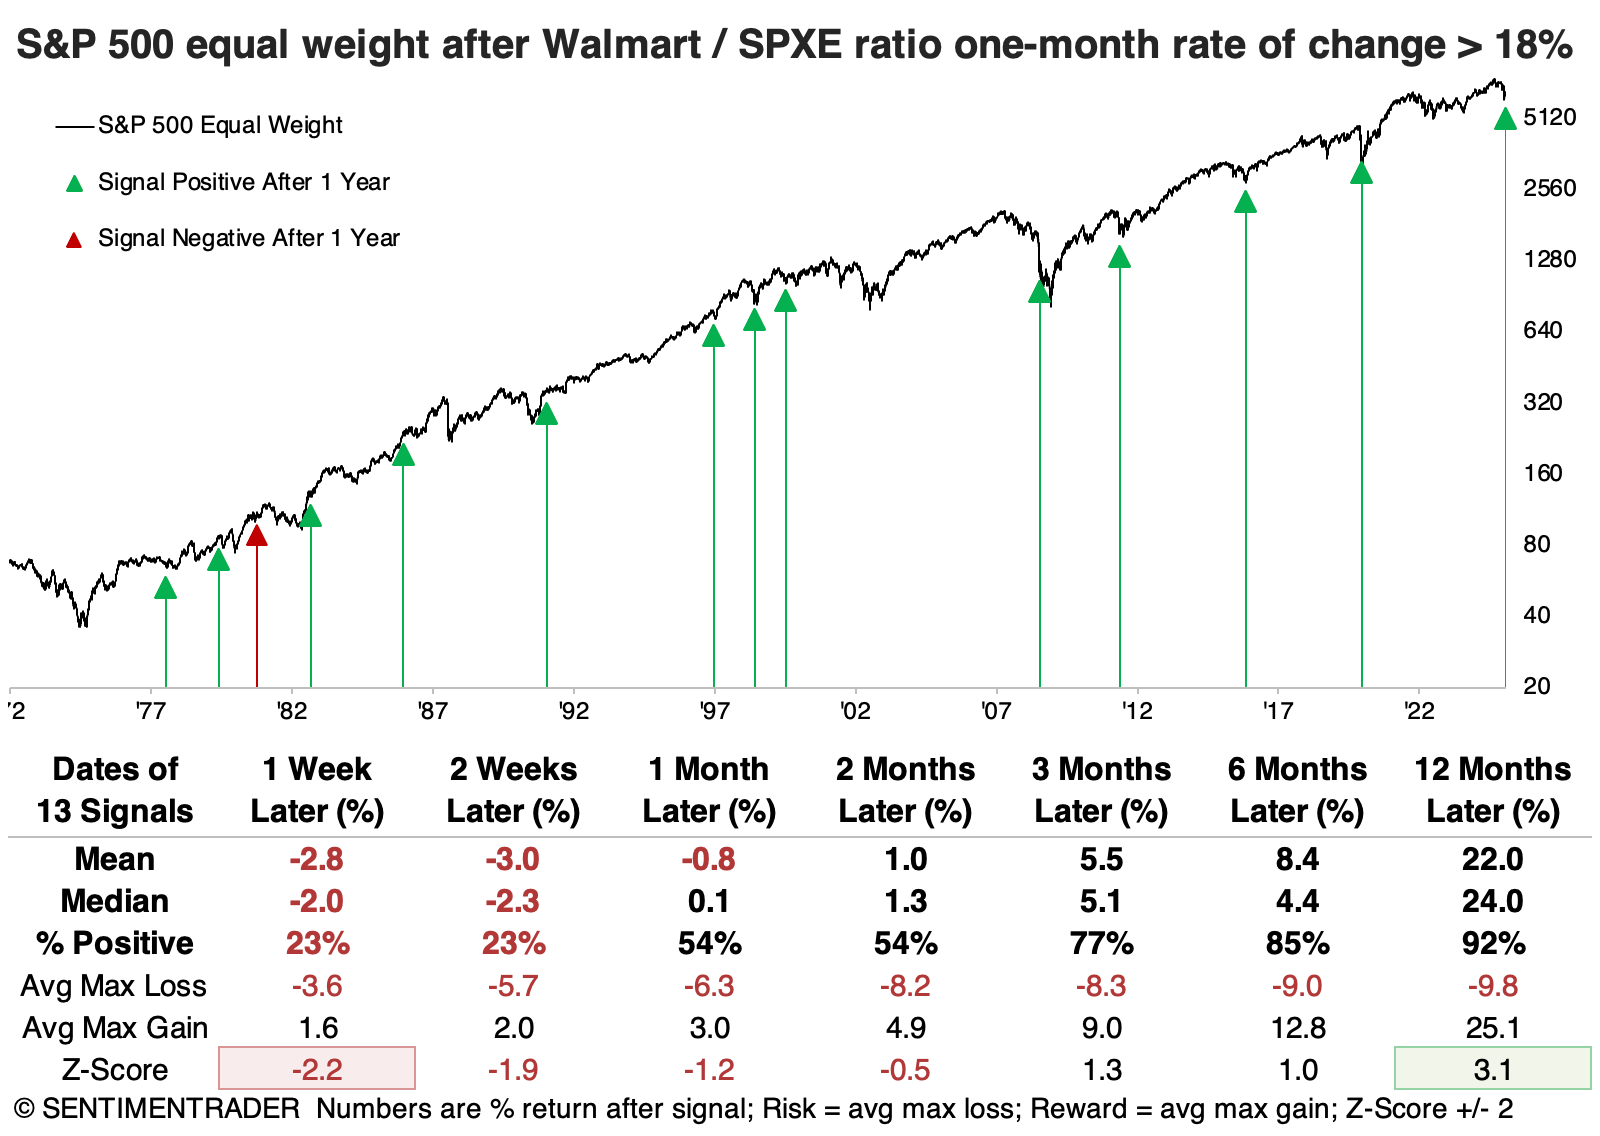
If we look at the ratio between Walmart and the equal-weight S&P 500, we see that since the year 2000, these signals have tended to occur around relative peaks in the stock.
Walmart hasn't just done well over the past month; it has also outperformed the average stock handily over 3, 6, 9, 12, and 24 months. The chart below shows the rate of change in the ratio across all time frames, and it exceeded 50% in February. As the chart shows, this tended to occur around U.S. recessionary periods.
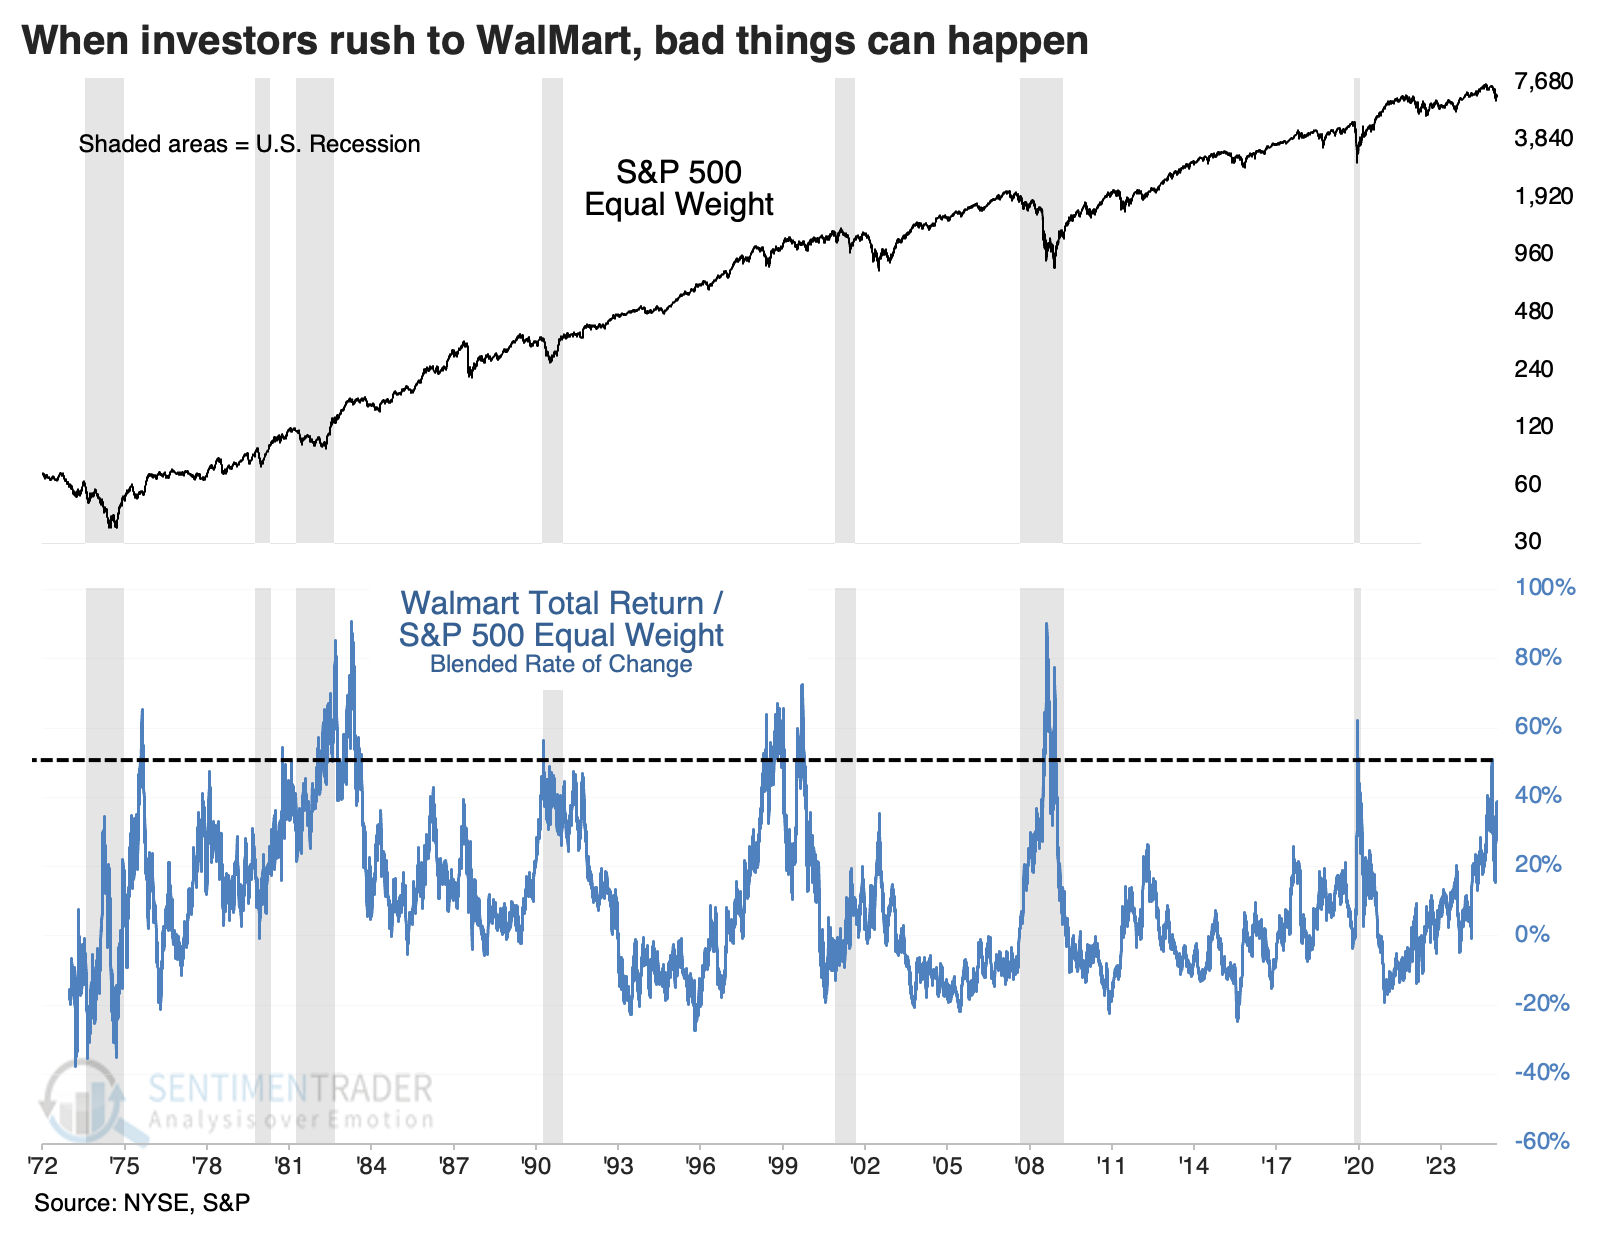
After these extremes, short-term returns in the S&P 500 tended to be poor, but after about a year, they were above-average. Walmart stock was hard to keep down, but its returns were below average, even considering some exceptional runs after a few of them.
There were not any standouts among sectors following these signals, but value stocks stood out for long-term returns among factors.
Some good months this year?
Jay's 20-year cycle flagged March 2025 as a potential ugly month - sadly, this turned out to be correct. The same cycle is now flagging certain months during the rest of 2025 and into 2026 as "favorable."
The 20-year cycle numbers each month of the decade as #1 (January of Year "0") through #240 (December of Year "19"). A given month can be labeled "Favorable", "Unfavorable", or "Neutral".
Next up in the category of "Favorable" months are months #65, 67, and 69 through #73. This equates to:
- May 2025
- July 2025
- September, October, November, December 2025
- January 2026
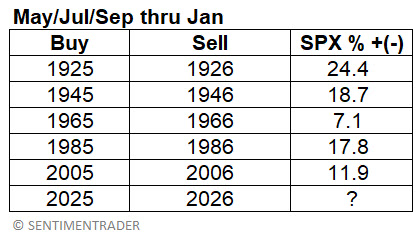
To be clear, this would involve buying an S&P 500 index fund at the end of April, selling it at the end of May, repurchasing it at the end of June, selling again at the end of July, then buying once more at the end of August and - finally - exiting at the end of January 2026.
The table below displays the hypothetical returns generated every 20 years if the S&P 500 is held only during the abovementioned months.
The chart below displays the hypothetical growth of $1 invested in stocks only during the abovementioned periods.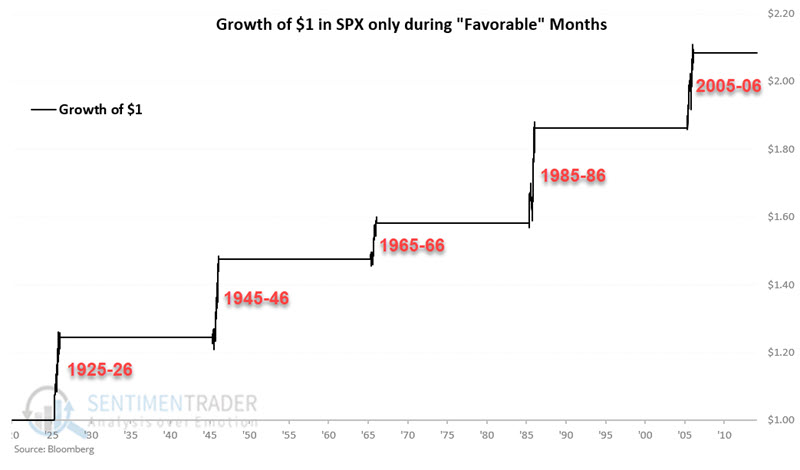
Peak panic
Investors typically look for the market to bottom out - and for a potential buying opportunity - when panic reaches an extreme. Jay suggested a lower-risk, higher-probability alternative may be to wait for panic to completely subside.
Human behavior is relatively constant, so many investors consider some version of the Typical Sentiment Cycle popularized by Justin Mamis in his 1999 book, The Nature of Risk. Instead of eyeballing a chart and guessing where we might be in the Cycle, we took the period from the Mamis book. Then we compared it to every similar Cycle since 1928 to develop an overall composite of what a Typical Sentiment Cycle has looked like over time.
For this test, we first want to see a period of reasonable-sized panic. However, instead of rushing in during peak fear (when the market can be plunging lower, and since no one ever knows "how low is low"), we want to wait for panic to dissipate before acting. In other words, we are looking for an "all clear" signal.
To this end, we will wait for Sentiment Cycle Panic to cross above 0.78, then wait for it to cross back below (-0.78). Once these rules are triggered, we will buy and hold the S&P 500 Index for nine months (or to be exact, 189 trading days).
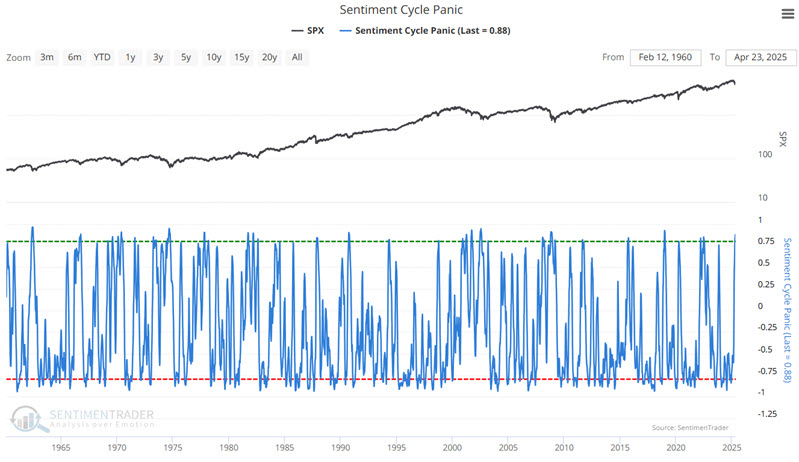
We will set up the test in our Backtest Engine 2.0. Since 1960, the S&P 500 was higher nine months after a signal in all nineteen instances. The average nine-month gain was +11.09% while spending only 21.77% of the time in the market.
The table below displays SPX performance for different holding periods.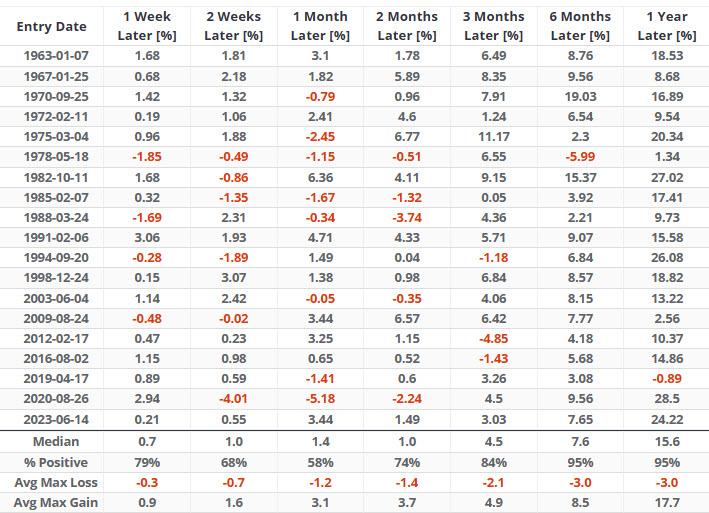
There is no guarantee that the next signal will generate a profit. Still, Sentiment Cycle Panic crossed above 0.78 on 2025-04-08, triggering the first criteria. Now it is a matter of patience and waiting for the indicator to drop back down to -0.78 to trigger a nine-month holding period for the S&P 500 Index.
Some bullish sector trends
Trend and relative trend score indicators for several stocks are exhibiting bullish characteristics. Dean outlined how to use the trend score indicators for trading and investment ideas.
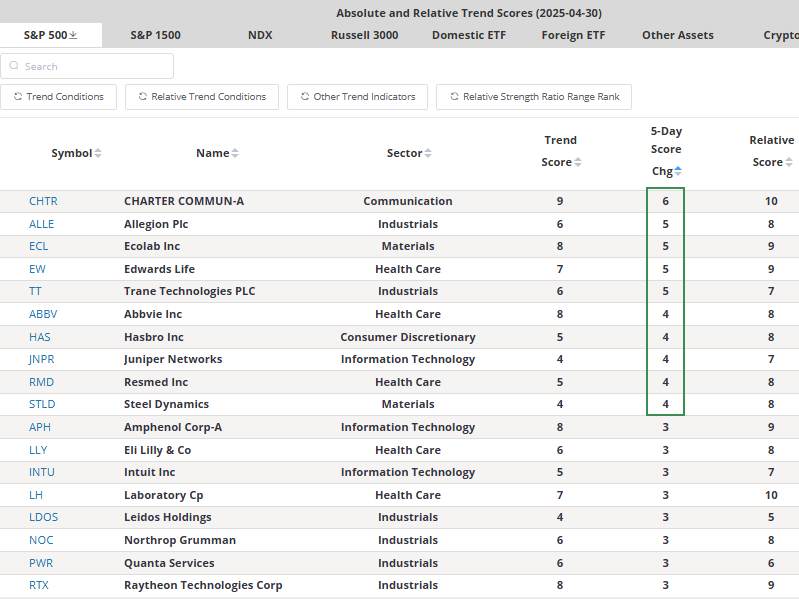
In subscriber webinars, Dean shared the two primary trend score methodologies he uses to generate trading and investing ideas. The first is the trend score net change buy signal, which identifies trading opportunities when the trend score increases by at least four points over five days. This method is especially effective following corrections and bear markets, as it often provides early entries before broader improvement is reflected in the trend and relative trend scores.
The following table sorts S&P 500 stocks by the 5-day net change. While several stocks show a net change of four or higher, one candidate is Trane Technologies (TT), as it is an industrial stock, one of the four cyclical sectors that display leadership qualities after corrections and bear markets.
The Trend Score page has been enhanced with a new indicator: the Relative Strength Ratio Range Rank. It tracks where a stock's relative ratio against the S&P 500 falls within its historical range over periods from 10 to 126 days. A score of 100 marks a relative high; 0 marks a low.
As shown in the chart below, the backtest engine visualizes historical 5-day net change buy signals for Trane Technologies. The most recent signal occurred in November 2023, which was followed by a 29% rally over the next three months.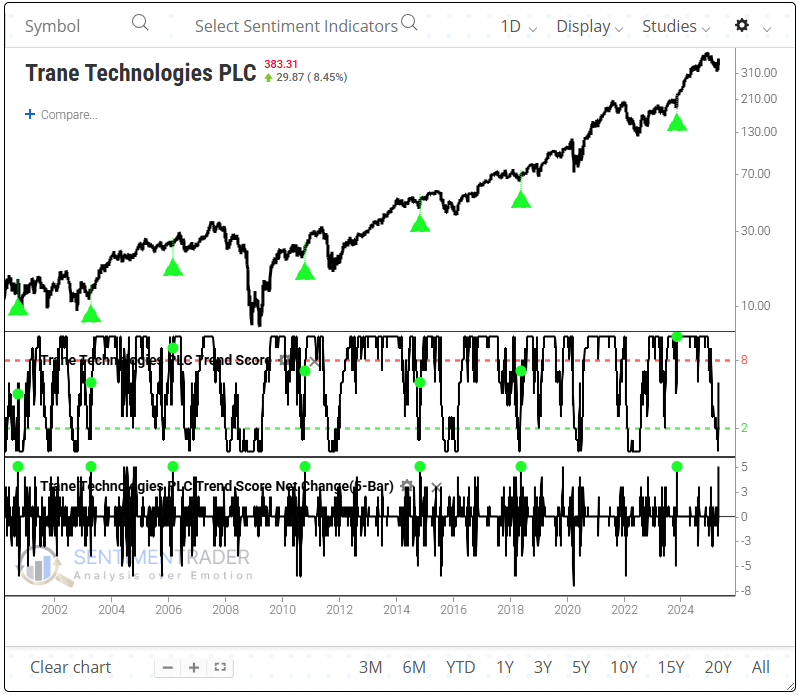
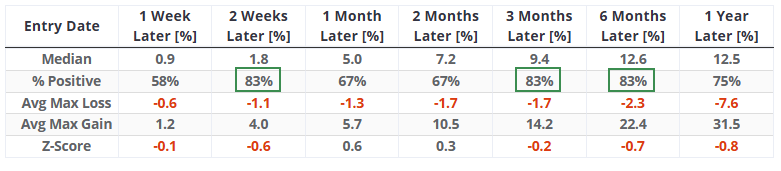
The multi-duration outcome table shows that multiple intervals achieved a three-month win rate of 83%, with a consistently bullish risk-reward skew across all time horizons based on average gains versus losses.
With the ability to export trend score data to Excel, subscribers can easily filter and combine it with other indicators of their choice, offering maximum flexibility in their analysis.
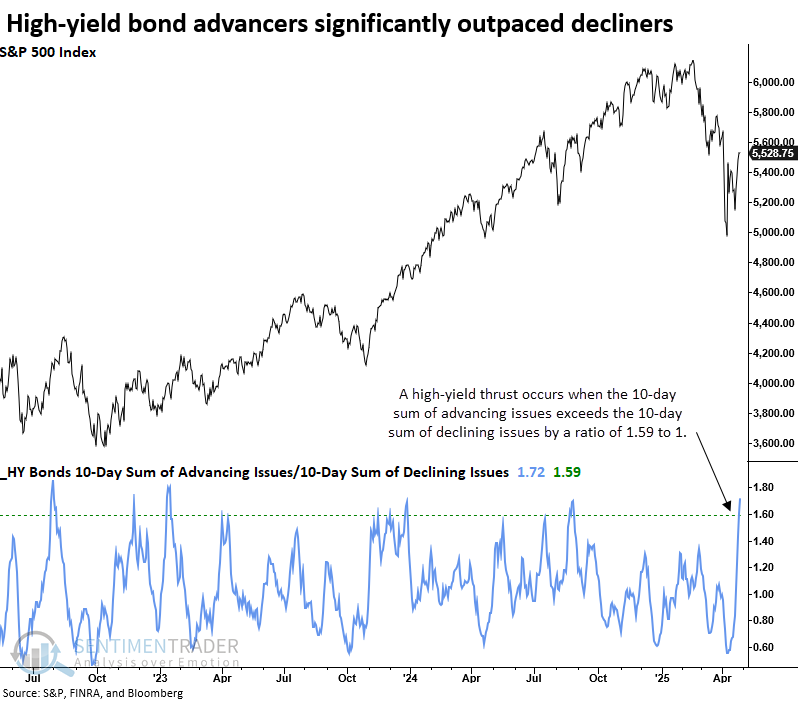
Bond breadth
The most risky corporate bonds, high-yield, triggered a breadth thrust. Dean noted that after similar thrusts, a high-yield bond index rallied 100% of the time over the subsequent six and twelve months.
This indicator is featured on our website's breadth page, titled "10-Day A/D Ratio." The concept, often referred to as breakaway momentum, was popularized by respected market analyst Walter Deemer.
High-yield thrust signals have historically preceded robust and consistent gains in the S&P 500 over all time frames. One year later, the index rose in every instance. Although the signal has historically delivered substantial rewards relative to risk, the outcomes in 2009 and 2022 underscore that even high-probability setups can fail.
A high-yield bond index displayed outstanding returns and consistency across all time frames, with the six and twelve-month intervals recording a gain in every instance. 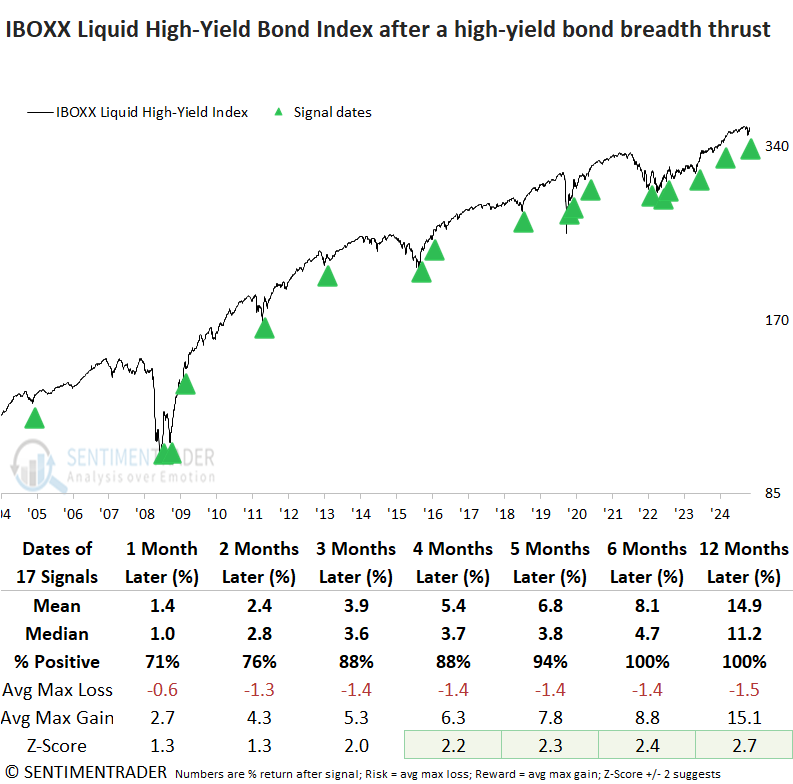
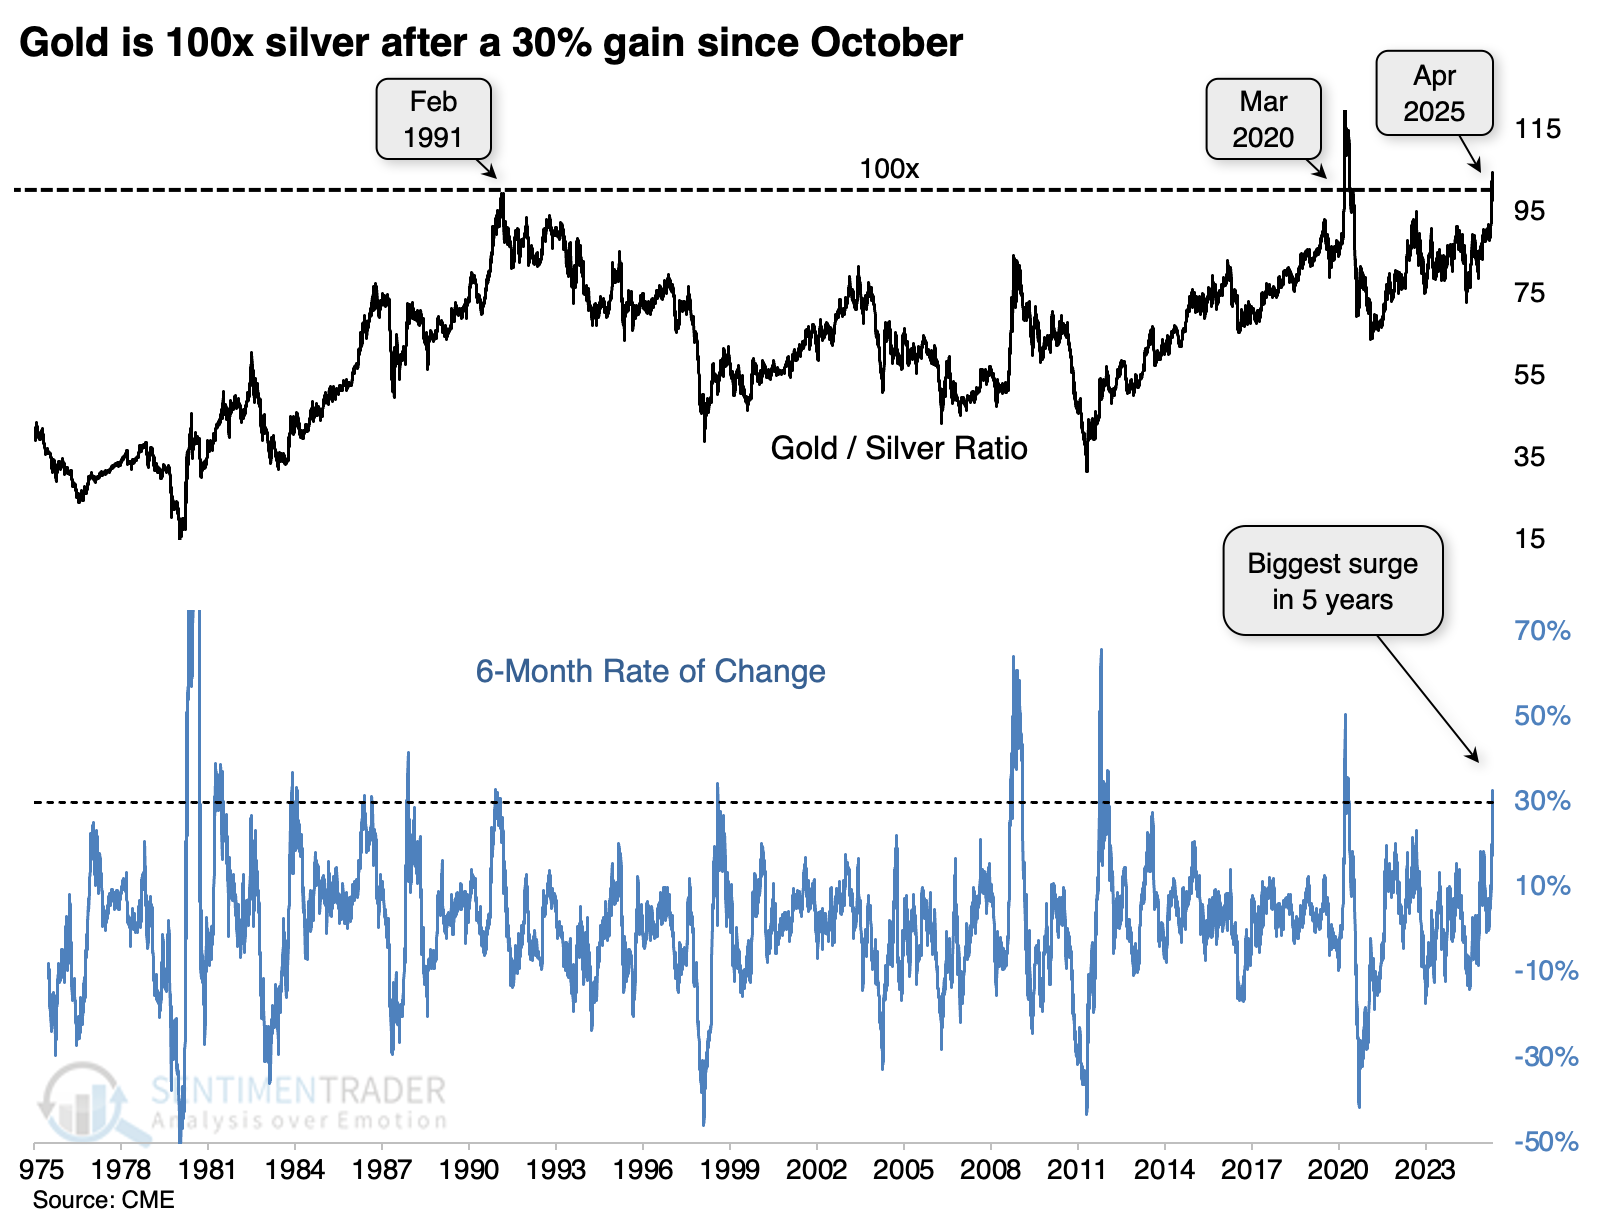
Gold vs. silver
We all know gold has been on a tear. The excitement has rubbed off on a few other precious metals over the past month, but even so, they haven't kept pace with the yellow metal.
With its latest push, gold traded for 100x the price of silver for only the third time in 50 years. We're currently amid the third instance, as the ratio has rocketed more than 30% in the past six months.
If we focus on times when the ratio jumped 30% or more over six months, we see mixed returns going forward. Three months later, gold continued to outperform silver most of the time, but few lasted longer than that. Over the past 40 years, there have been essentially no instances when gold just kept chugging higher relative to silver.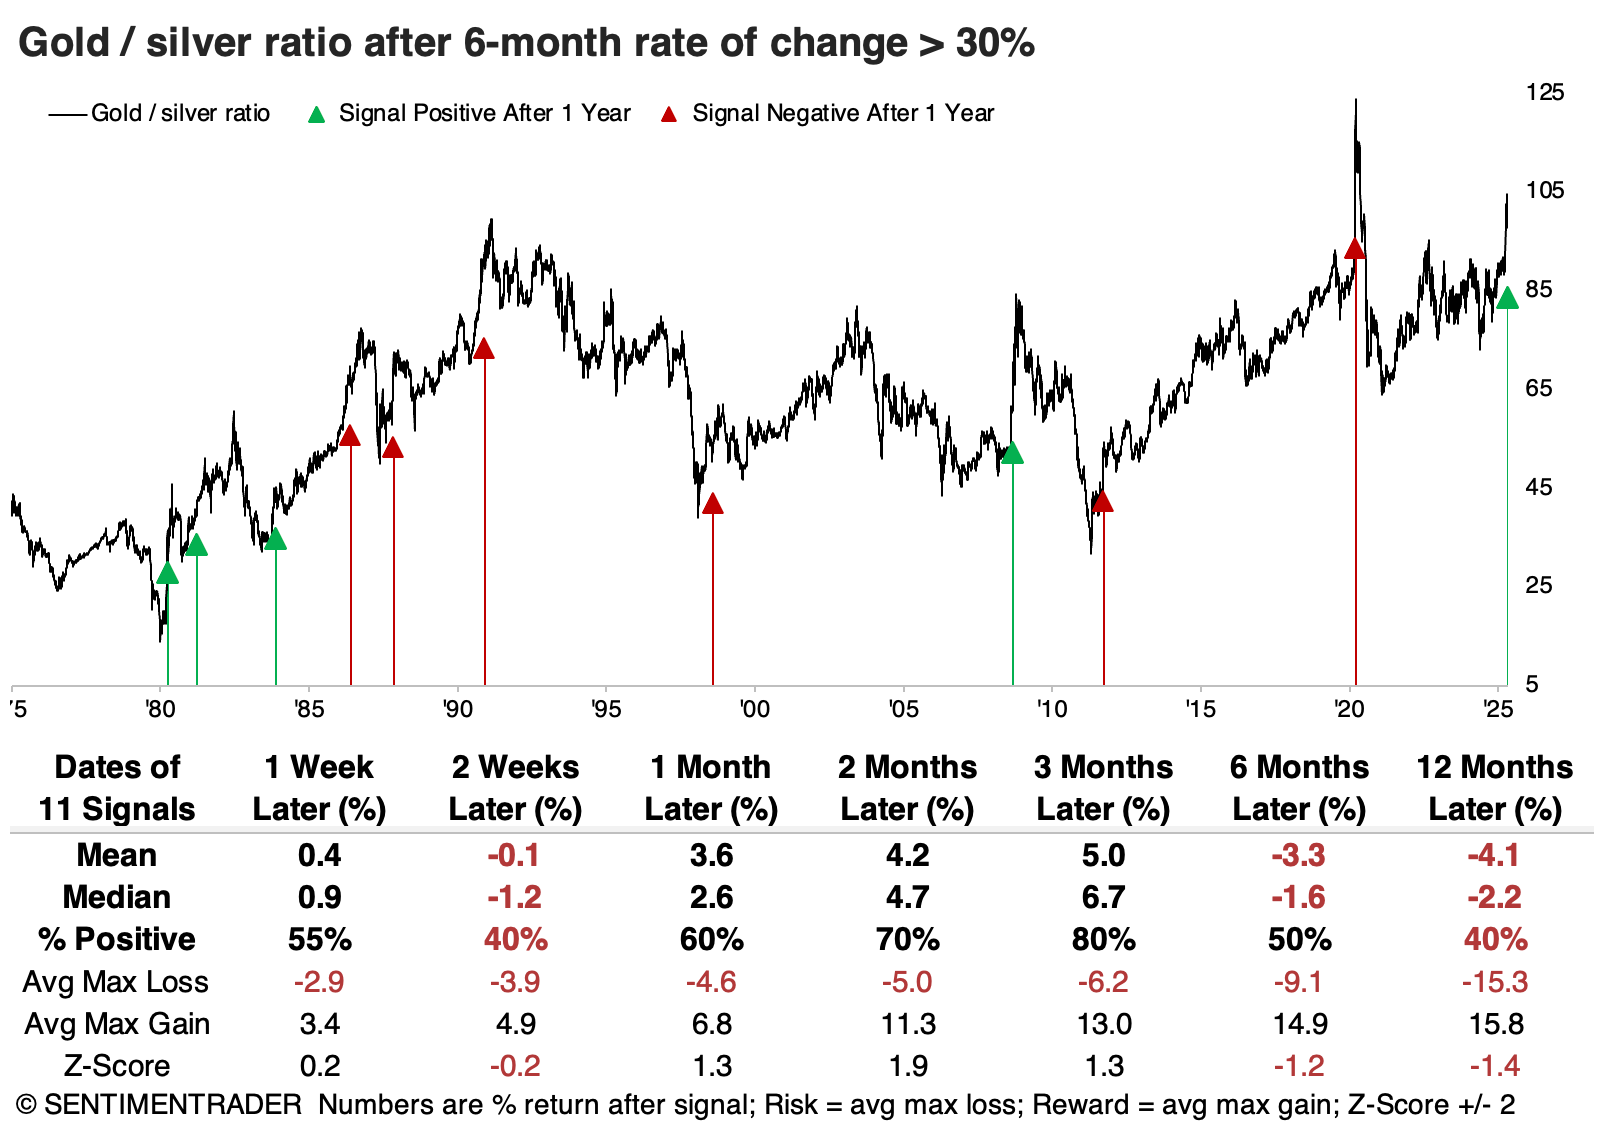
Absolute returns in gold were about in line with random. The last few signals saw gold struggle on some time frames, but they showed positive returns after six months. Before that, its one-year returns were questionable.
Silver has been more of a boom-and-bust market. Its best performance was over the next six months when it suffered three losses versus eight gains, and only one of those losses was severe. But it had a lot of trouble holding onto those gains in the months afterward.
These were also mixed signals for stocks. The S&P 500's returns going forward were okay, but nothing stood out. It has been more convincing in recent decades, but it was too early to suggest an extreme sentiment during the 2008 global financial crisis. Among factors, value stocks stood out for the most impressive long-term returns.
About TradingEdge Weekly...
The goal of TradingEdge Weekly is to summarize some of the research published to SentimenTrader over the past week. Sometimes there is a lot to digest, and this summary highlights the highest conviction or most compelling ideas we discussed. This is NOT the published research; rather, it pulls out some of the most relevant parts. It includes links to the published research for convenience, and if you don't subscribe to those products, it will present the options for access.