
TradingEdge Weekly for May 19 - Positive industry returns, semi breakouts, lack of tech insider selling

Key points:
- More than half of U.S. industry indexes now have a positive 1-year rolling return
- Intraday stock movement has quieted down
- Small speculators are holding massive bets against stocks
- The world's most benchmarked index is breaking out
- Tech corporate insiders aren't very interested in selling
- A couple of important semiconductor stocks break out
- Latin American trends are relatively positive
- Brazilian stocks are showing impressive internal momentum
- Silver suffered a sudden downside reversal
- Wheat is entering a troubling seasonal window
An industry signal with a perfect 80-year record
More than half of U.S. sub-industries now have a positive 1-year rolling return. Dean noted that after similar reversals, the S&P 500 was higher every time a year later in the post-WWII era.
The recovery in long-term price-based indicators continues as time series like moving averages or rolling returns catch down and turn up, with most indexes moving sideways to slightly higher for almost a year. The latest indicator to wave the all-clear signal is the percentage of sub-industry groups with a positive 1-year rolling return. For only the 26th time since 1930, the series cycled from fewer than 20% to more than 50%.
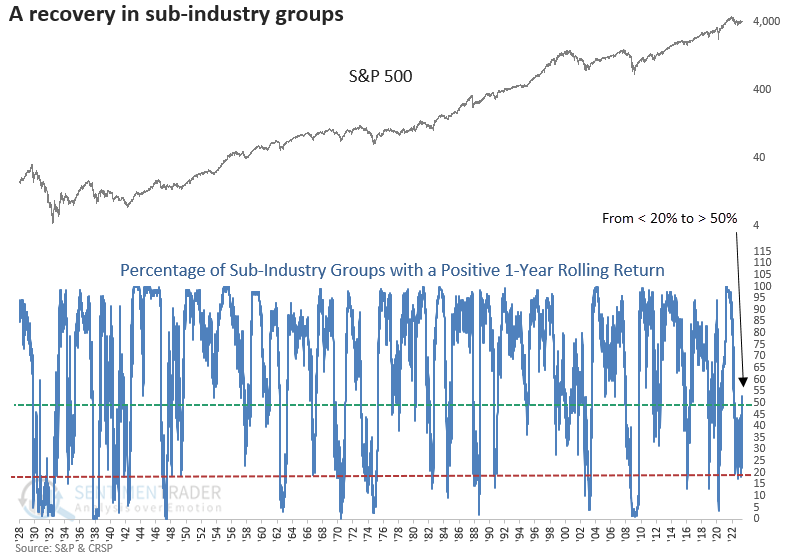
When the percentage of sub-industry groups with a positive 1-year rolling return cycle from < 20% to > 50%, the S&P 500 showed excellent results across all time horizons. Since 1942, the signal has had a perfect record a year later.
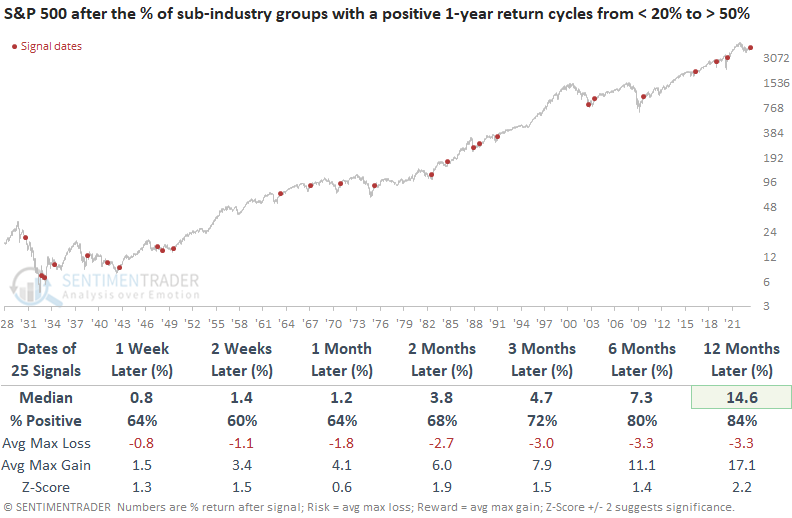
The max gain relative to the max loss has been outstanding since 1942. Out of 19 signals, only two resulted in a max loss exceeding the maximum gain over the six-month horizon. And the last -10% or greater max loss occurred in 1934.
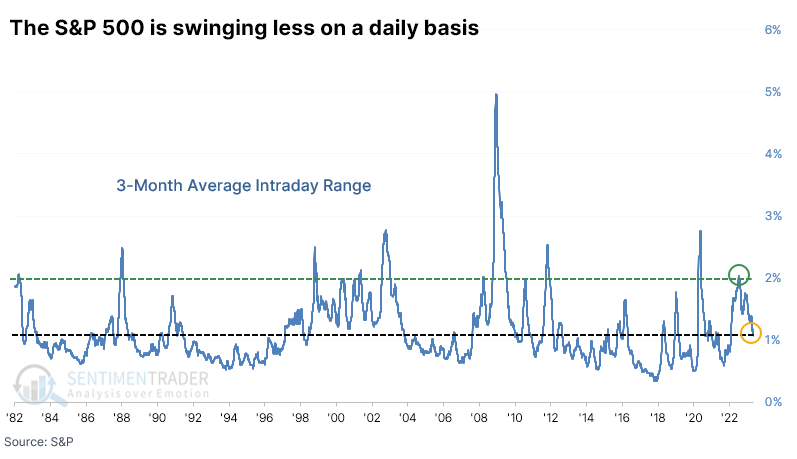
Stocks are quieting down
Ahead of the CPI print last week, the S&P 500 curled up during the day and didn't move much. Then it did it again. As a percentage of the closing price, the intraday range has been about as low as at any point over the past year and well below the average range of the past three months.
Small intraday ranges are considered bearish because they indicate that investors are complacent with the status quo and see no need to adjust their positions. Therefore, stocks will likely decline to jar investors out of that complacent mentality. At least, that's the theory. It doesn't work in practice.
After days with an extremely tight intraday range, the S&P 500 rose across time frames and showed above-average returns. There was only one double-digit loss over the following year, and that was just barely. The average intraday range over the past three months has been declining steadily, from more than 2% last year to barely 1% now. It's still elevated compared to the past 40 years but has nearly halved from where it was almost a year ago.
There aren't many precedents for intraday swings to cycle from an average of more than 2% to barely 1%. The table below outlines the handful of times it occurred, and it showed a consistent tendency to mark the ends of major corrective periods in the S&P 500. The index mainly showed strong returns from two to twelve months later, though there was some volatility after a couple of them.
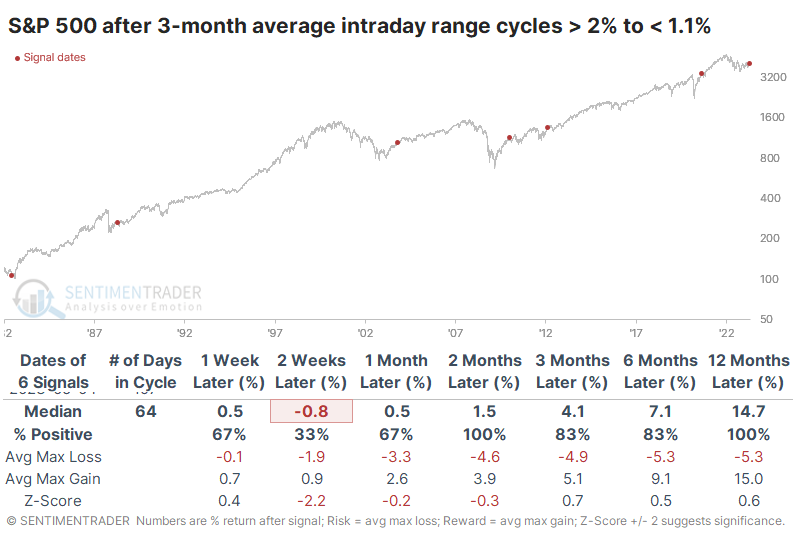
The table of maximum gains and losses across each time frame after those signals shows that only one signal saw a loss of more than -10% at any point within the next year, and that was just barely. All the other signals witnessed no more than a -6.4% drawdown at any point within the following year.
Small speculators are holding a record short
Jay noted that small speculators in the stock index futures markets have recently been more heavily positioned to the short side than ever. This is a bullish contrarian event, as small speculators have a long history of fighting/being on the wrong side of major trends.
Our Small Spec Index Position indicator shows the net position of small (nonreportable) traders in S&P 500, Nasdaq 100, and DJIA index futures, full contract, and e-min, adjusted for position size and index value, shown in billions of dollars. The raw data comes from the CFTC Commitment of Traders report.
First, the basic premise underlying this indicator is that the community of small speculators represents a large group of unsophisticated investors. While individual investors within this community may experience greater or lesser degrees of overall success, when this group leans too far in one direction, they typically get it wrong. As a result, this is viewed as a contrary indicator. Higher readings from this indicator (i.e., small speculators are getting more bullish) are considered bearish for stocks, and lower readings (i.e., small speculators are getting more bearish) are considered bullish for stocks.
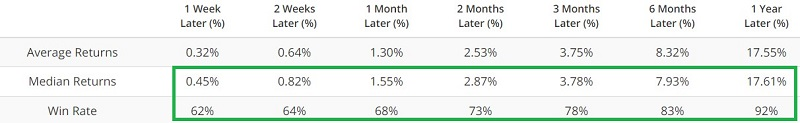
The chart and table below display S&P 500 Index results when the indicator is below $5 billion in net exposure. Average and Median returns and the Win Rate improve with each passing time period. The median 12-month return is 17.61%, with a Win Rate of 92%.
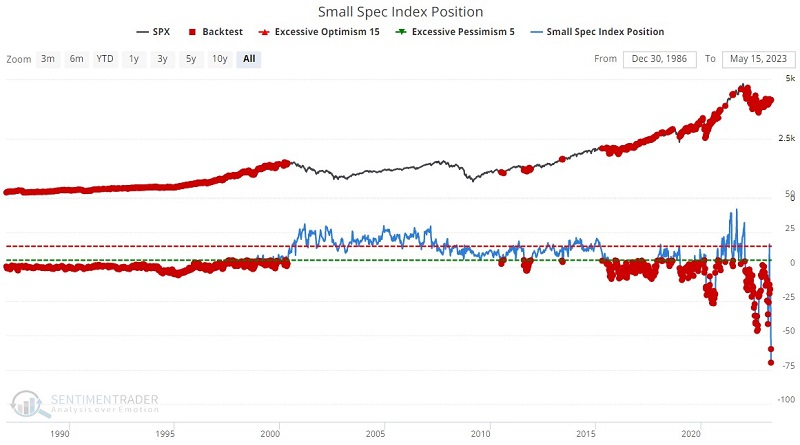
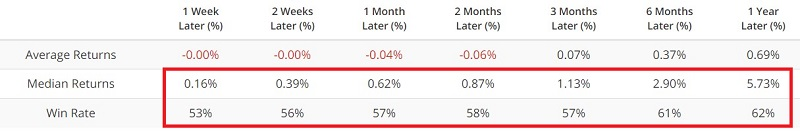
Conversely, the chart and table below display S&P 500 results when the indicator is above $15 billion in net exposure. While the results cannot be termed "bearish," they are noticeably inferior to the market's performance when the indicator is below $5 billion.
Jay also looked at a 50-week moving average of these positions, which generated a much smaller sample size, but also confirmed that investors were better served taking the opposite side of speculators' positions at extremes.
The S&P is breaking out
Dean showed that the S&P 500 closed at an 8-month high but not a 12-month high. Similar breakouts preceded bullish uptrends with solid returns, win rates, and z-scores.
According to a base breakout pattern triggered on Thursday, the odds of an upside resolution to the almost year-long consolidation in the S&P 500 Index look excellent.
For only the 29th time since 1932, the S&P 500 closed at an 8-month high but not a 12-month high. The previous breakout occurred in 2016, which eventually led to a steady uptrend in 2017.
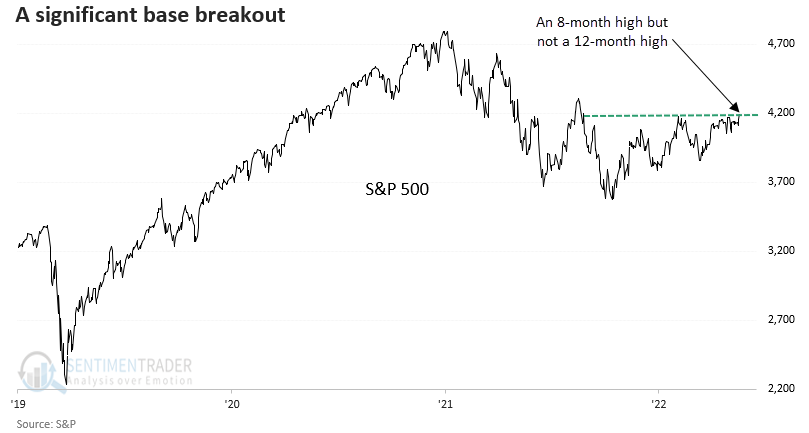
When the S&P 500 reaches an 8-month high but remains below a 12-month high, returns, win rates, and z-scores for the world's most-watched benchmark look excellent. A year later, the S&P 500 was higher 86% of the time, with 17 consecutive winners since 1958.
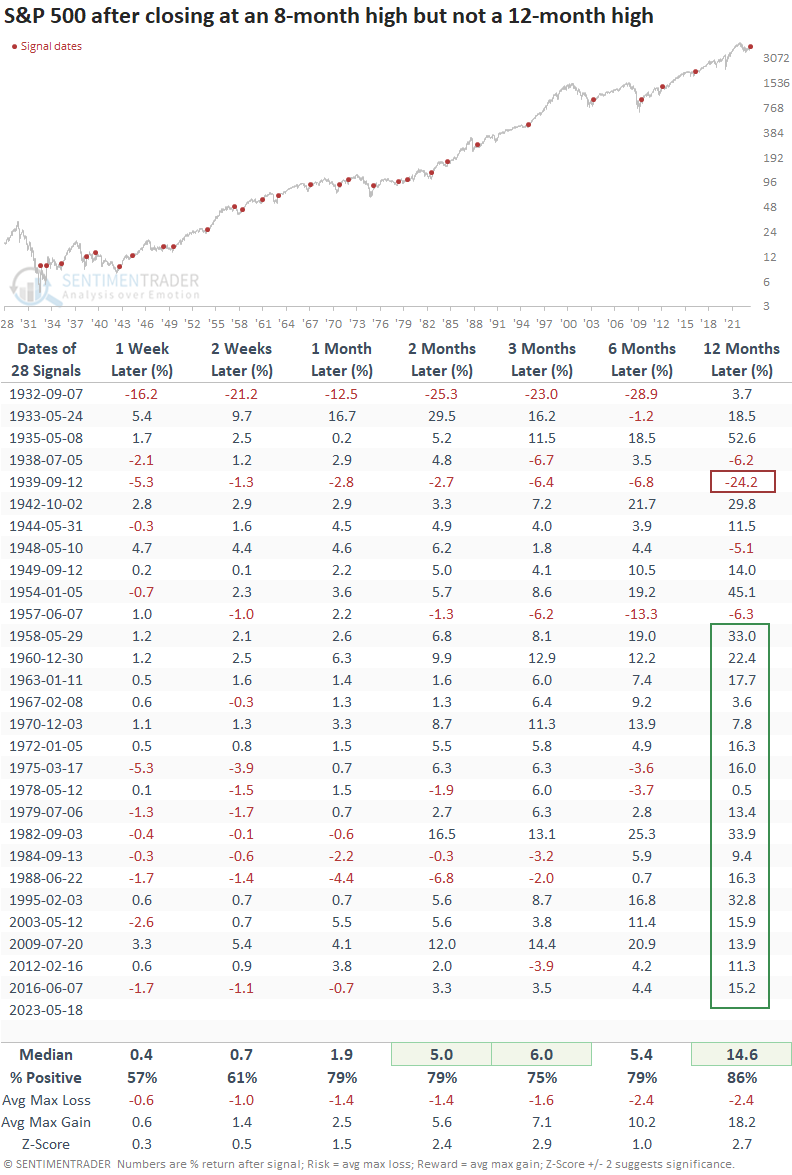
Market internals for groups within the S&P 500 lean bullish in growth-oriented sectors like Technology. On Thursday, the percentage of 12-month highs in Technology reached the highest level in more than a year.
Tech insiders aren't very interested in selling
Corporate insiders have pared their buying in recent months. Jay noted that, more importantly, insider selling in many key sectors remains significantly low.
Corporate insider buying among Nasdaq 100 constituent companies and the technology sector peaked in mid-to-late 2022. The chart below displays the Corporate Insider Buy/Sell Ratio for companies comprising the SPDR Technology Sector ETF (XLK).
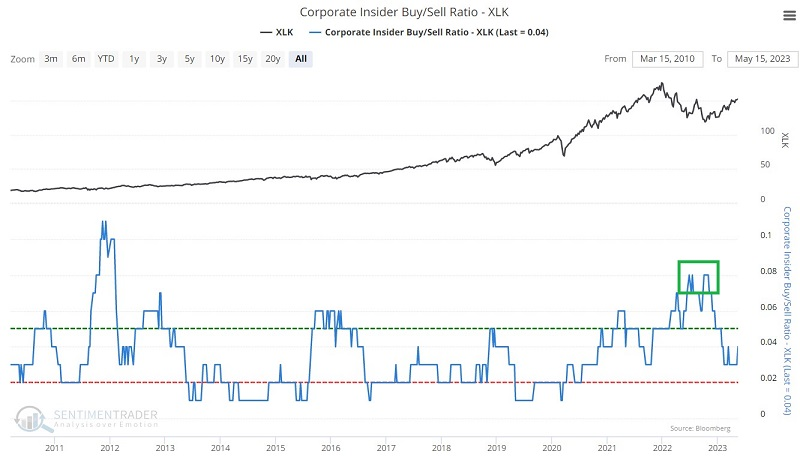
Buying far outpaced selling in June and October of 2022 as corporate insiders sensed a buying opportunity. Since then, the Buy/Sell ratios for both have fallen off, leading some pundits to fret loudly about "a lack of insider bullishness."
The single most bullish thing insiders can do is engage in broad-based open market buying. The second most bullish thing insiders can do is not to sell their shares in the face of an advance.
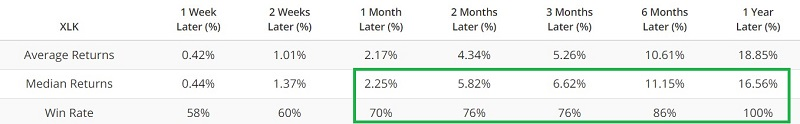
The Corporate Insider Sells - XLK indicator shows the total number of corporate insiders of companies covered by the Technology Select SPDR ETF (ticker XLK) that have sold shares on the open market during the past six months. The chart and table below display all weeks when this indicator was below 320 and summarizes XLK's subsequent performance.
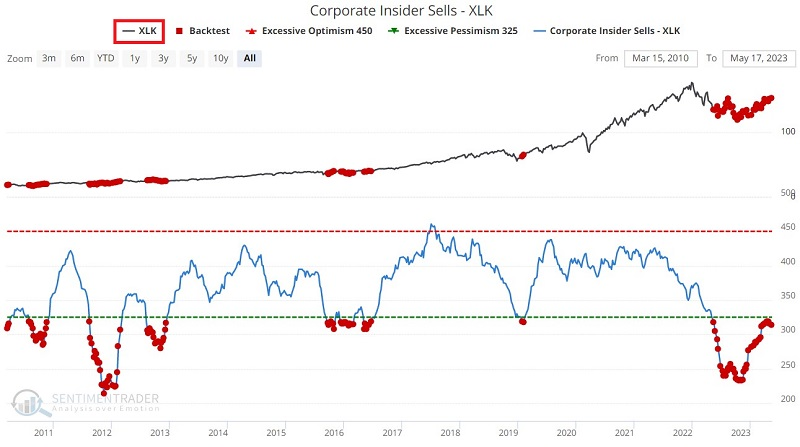
Like many indicators, corporate insider buying and selling is typically best used not as a standalone buy or sell signal but as part of a broader weight of the evidence approach. And while a well-to-do corporate executive may be able to weather the storm while waiting for a long-term investment in their own shares to pay off, a less well-capitalized trader still needs to be mindful of capital allocation and risk control considerations.
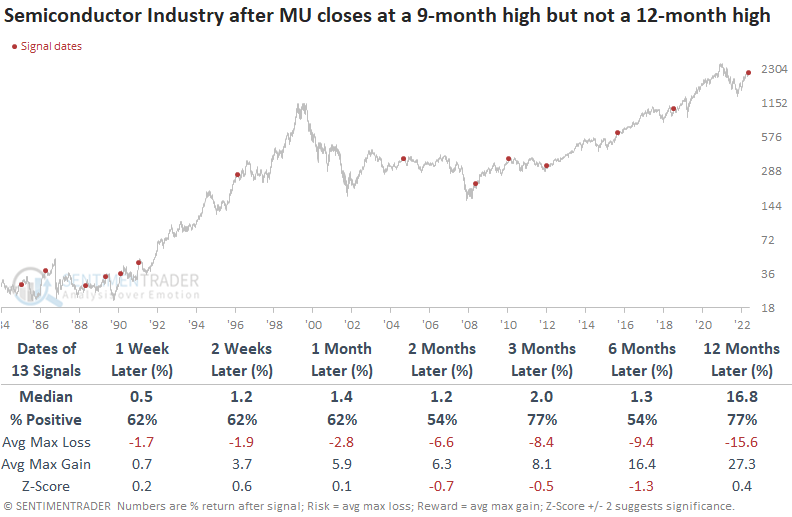
Important semi stocks break out
Within the Technology sector, Dean noted that Micron Technology and Applied Materials broke out to new highs after significant base formations. Similar price patterns preceded higher prices for both stocks, especially in the near term, and they bode well for the broad market over the next year.
On Wednesday, Micron Technology, a memory chipmaker, closed at a 9-month high but not a 12-month high. And Applied Materials, a semiconductor equipment manufacturer, closed at a 12-month high but not a 24-month high.
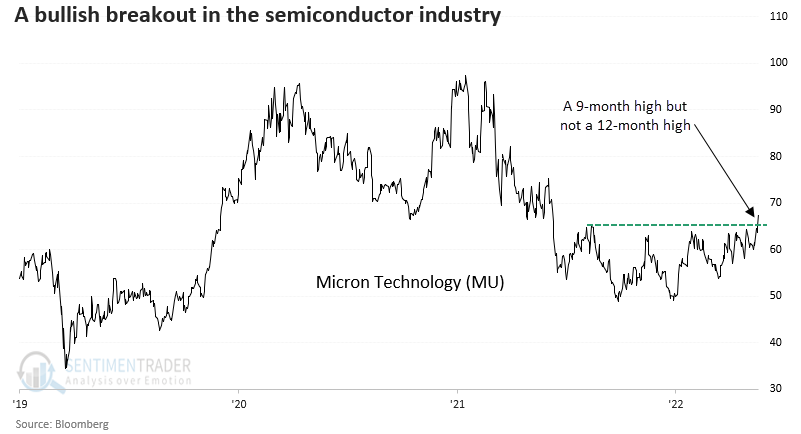
When Micron registers a 9-month high but not a 12-month high, the base breakout leads to further upside momentum, especially over the next month. When applying the Micron signals to the semiconductor sub-industry group, the results are not nearly as good but it was still higher 77% of the time three months later.
Applied Materials, a semiconductor equipment manufacturer, broke out of an even more significant base formation than Micron when it closed at a 12-month high but not a 24-month high. After similar breakouts, the stock was higher 84% of the time over the next two weeks.
Results look excellent when applying the signals to the semiconductor equipment sub-industry group, especially in the first month. The alert shows a gain at some point over that horizon in 17 out of 19 precedents.
A significant base breakout for Micron or Applied Materials was a bullish development for the broad market. IN BOTH CASES, the S&P 500 was higher a year later in all but one instance.
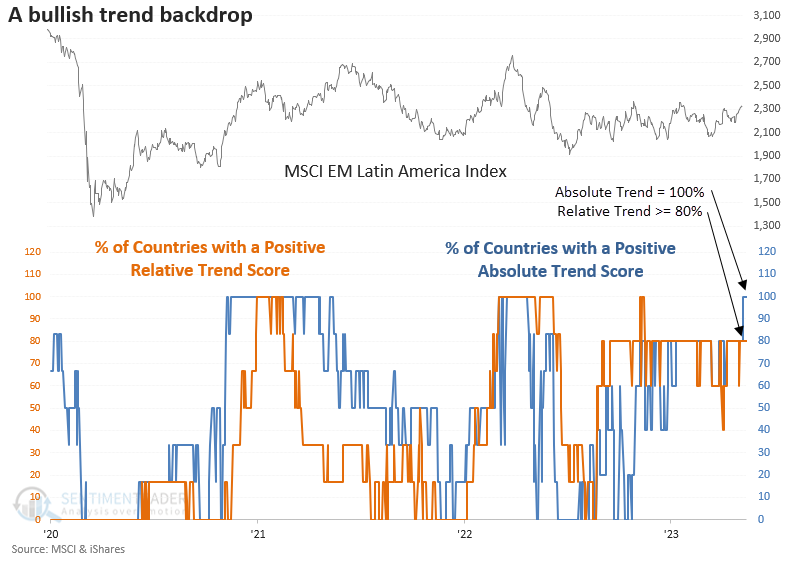
Latin American trends are relatively positive
Most Latin American countries show positive absolute and relative price trends and Dean showed that after similar trend conditions, the MSCI EM Latin America Index rallied over the next three months.
With absolute and relative trend scores improving in Brazil (see below), the overall backdrop for Latin America looks more constructive. Dean assessed the outlook for the MSCI EM Latin American Index when 100% of the countries in the region show a positive absolute trend score and 80% or more exhibit a positive relative trend score.
While the signal tends to hit a rough patch in the first few weeks, the medium-term results look excellent, especially in the three-month horizon.
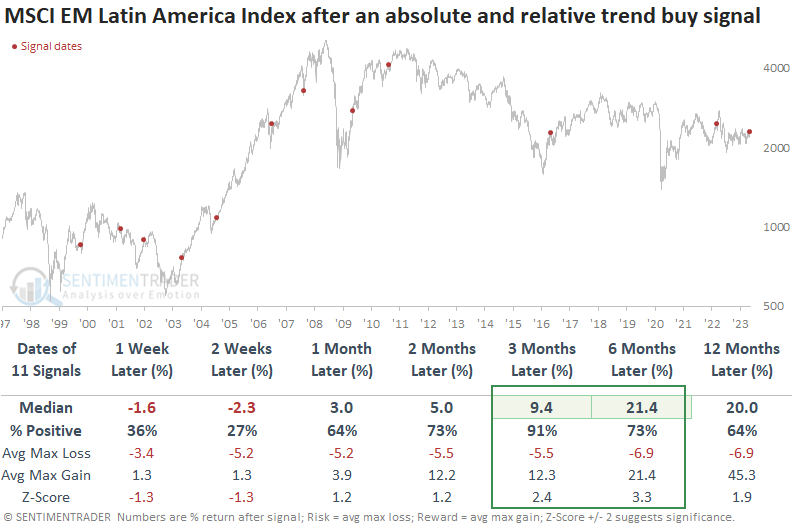
The max gain relative to the max loss looks unfavorable from one to four weeks later. However, from two to twelve months later, the median max gain looks significantly better than the median max loss.
Brazilian stocks are showing good internal momentum
Despite what appears from the outside to be political chaos, Brazilian stocks have held up quite well.
Internal momentum has been consistent and persistent enough to push the McClellan Summation Index for Ibovespa stocks back above the zero line. Something we often see with non-domestic markets is that they tend to perform best either when deeply oversold or when showing strong upside momentum. There is some evidence that's the case with this indicator and this market, as the Ibovespa's annualized return was +26.6% when the Summation Index was above +100.
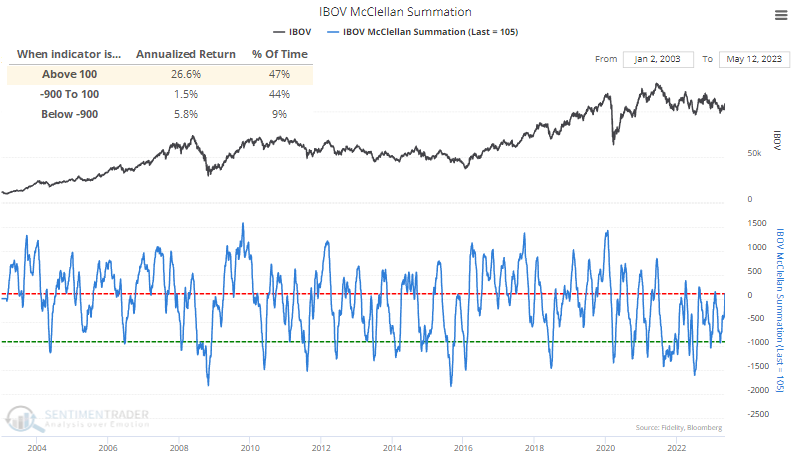
We can also see this with the shorter-term McClellan Oscillator. It jumped above +100 last week, and the Backtest Engine shows that the market tended to respond well to such impressive internal thrusts, averaging a return of over +14% during the next six months.
Historically, slower recovery cycles are often better when it comes to foreign markets. Those indexes tend to underperform when investors rapidly push into stocks after just rushing out.
The table below highlights signals when the recovery cycle in the McClellan Summation Index took longer than a month. Over the next two months, the Ibovespa rose after 9 out of 10 signals. The sole loser was very large, heading into the final waterfall decline and bear market low of 2016, but it also showed a massive gain over the next year.
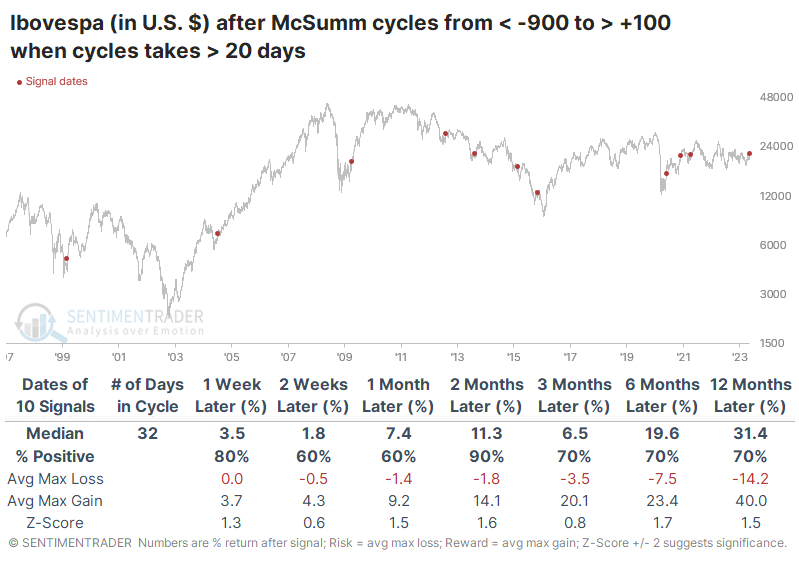
Contrast those returns to when the Summation Index cycle was concise, under a month. The Ibovepsa was more than twice as likely to see a double-digit decline at some point within the next two months after these quick cycles. Its median return over the next year was -4.0% versus +31.4% after longer cycles.
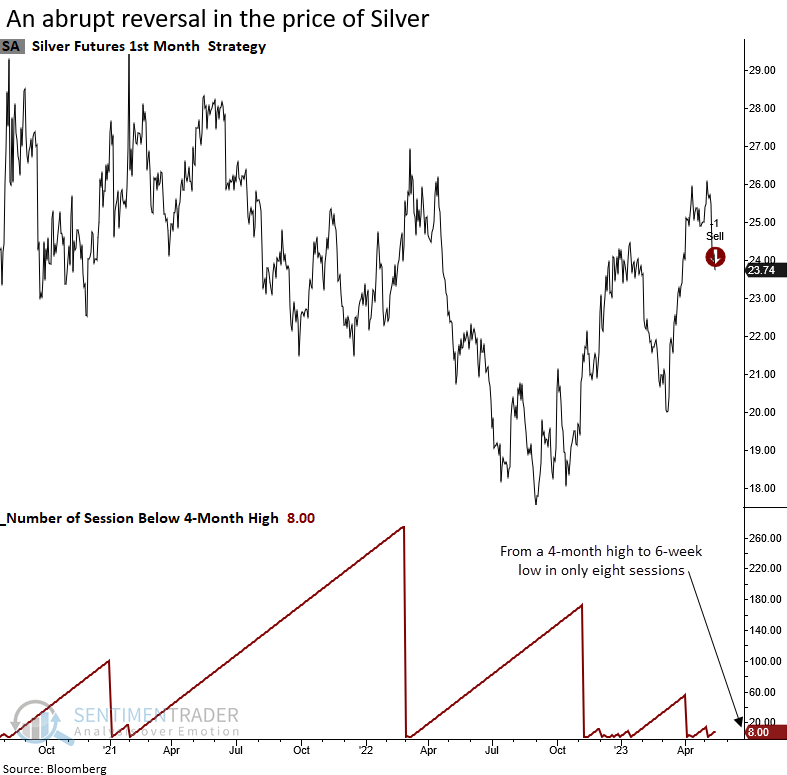
Silver's sudden reversal
Dean showed that silver futures reversed from a 4-month high to a 6-week low in eight sessions. Similar reversals preceded negative returns for the commodity over the next two months.
Silver, like gold, has benefitted from the weak dollar, which bottomed last October with stocks. Could the recent downside momentum in the commodity signal that the debt ceiling negotiations are nothing more than Washington theater? For only the 14th time since 1972, silver futures cycled from a 4-month high to a 6-week low in ten or fewer sessions.
The negative momentum continues over the next few months when the silver futures contract cycles from a 4-month high to a 6-week low in ten or fewer sessions. Once the downside price action subsides, silver tends to bounce back in the three-month time frame.
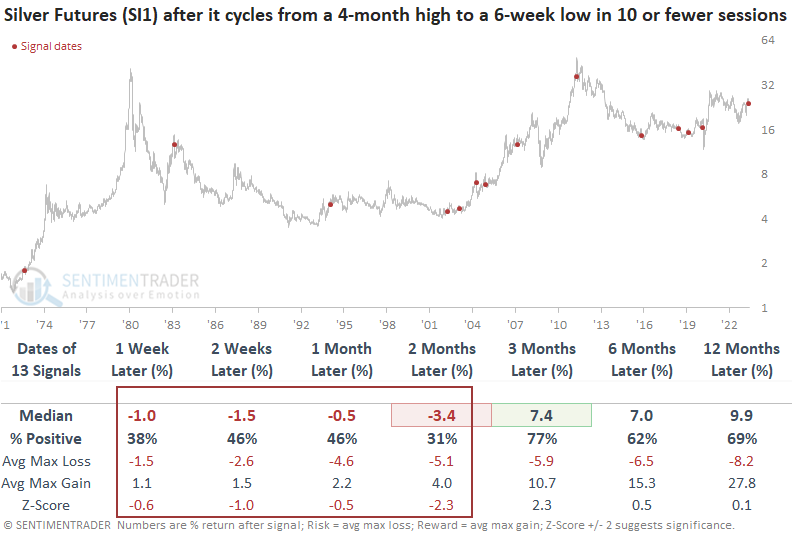
If you think silver and other precious metals are in a secular bull market, I would be mindful that the commodity showed a loss in the two-month horizon in 4 out of 6 precedents during the last secular bull between 2002 and 2011. The max loss was worse than the max gain in 10 out of 13 signals over the next two months and silver is a few weeks away from entering the worst month of the year for seasonality.
Wheat's seasonal trouble patch
Jay showed that due to the recurring nature of the planting cycle, wheat is a highly cyclical market and is now entering one of its most unfavorable seasonal periods. An options play may offer a lower dollar risk opportunity - but has unique risks of its own.
The unfavorable period for wheat extends from the close of Trading Day of Year (TDY) #95 through TDY #126. For 2023, this period extends from the close on 2023-05-18 through 2023-07-03.
The chart below displays the hypothetical cumulative $ +(-) from holding a long position in wheat futures only during these windows since 1937.
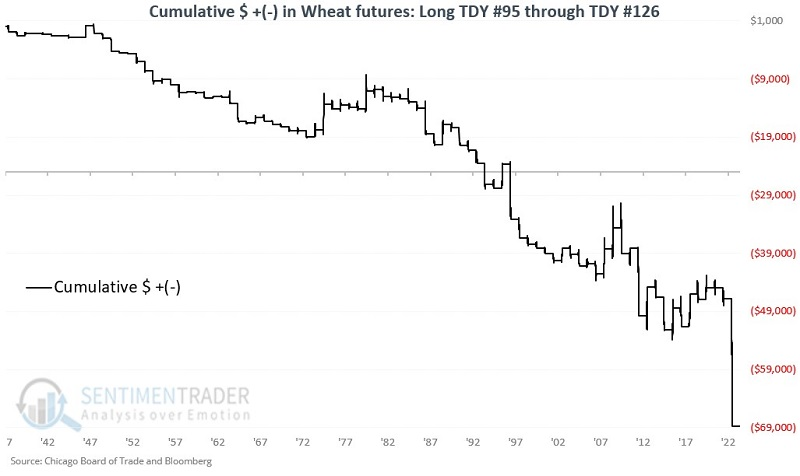
The contract rallied only 27% of the time during this seasonal window, and while the average loss was smaller than the average gain, it was four times more likely to see a large loss than a large gain.
The most straightforward play regarding this bias would be to sell short wheat futures during the period above. Before doing so, a trader must carefully assess their willingness and ability to assume the risks involved (most notably the unlimited risk) in selling short futures contracts.
The Teucrium Wheat Fund (ticker WEAT) is an ETF intended to track the price of wheat futures. Options are offered on WEAT. However, it must be emphasized that trading volume is exceedingly thin. For a trader who did not want to assume the risk of shorting wheat futures, one example WEAT options play might be to:
- Buy the WEAT July21 2023 8 put @ $1.65
(Note that this is an example of a deep-in-the-money long put trade and that by the time the close on 2023-05-18 rolls around, the price of this particular option could be quite different.)
This trade's risk curves are shown below (courtesy of Optionsanalysis).
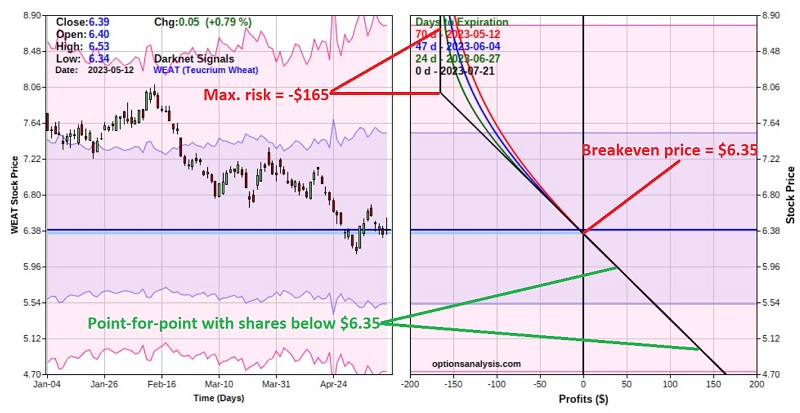
The cost to enter a 1-lot - and the maximum risk - is $165. The position has a Greek "Delta" value of -89.89. This means that the position will behave like a position holding short roughly 90 shares of WEAT but without the unlimited risk and margin requirement associated with selling short shares. Below the breakeven price of $6.35, the option position will move point for point with WEAT shares.
Theoretically, the profit potential is unlimited. More practically, if WEAT declines one standard deviation to $5.50 a share, the option trade will have an open profit of roughly $84. If WEAT falls two standard deviations, the open profit would be approximately $160.
The primary caveat to this example is that open interest for this option is very low, and trading volume is often non-existent. This can sometimes create problems in getting decent fills, particularly if you try to trade in any size. It is highly recommended that a trader use limit orders if they choose to trade in this type of situation.
About TradingEdge Weekly...
The goal of TradingEdge Weekly is to summarize some of the research published to SentimenTrader over the past week. Sometimes there is a lot to digest, and this summary highlights the highest conviction or most compelling ideas we discussed. This is NOT the published research; rather, it pulls out some of the most relevant parts. It includes links to the published research for convenience, and if you don't subscribe to those products, it will present the options for access.