
TradingEdge Weekly for May 16 - Calm conditions, monthly highs, sell in May

Key points:
- Calm conditions are being priced in
- New monthly highs among stocks have surged
- The S&P had been below its 200-day average for a while, but that isn't necessarily a worry
- Trend conditions on the Nasdaq have quickly improved
- More indicators are suggesting favorable conditions
- Adding some wrinkles to the "Sell in May" phenomenon
- What it may mean when so many non-USA markets outperform
Craving calm conditions
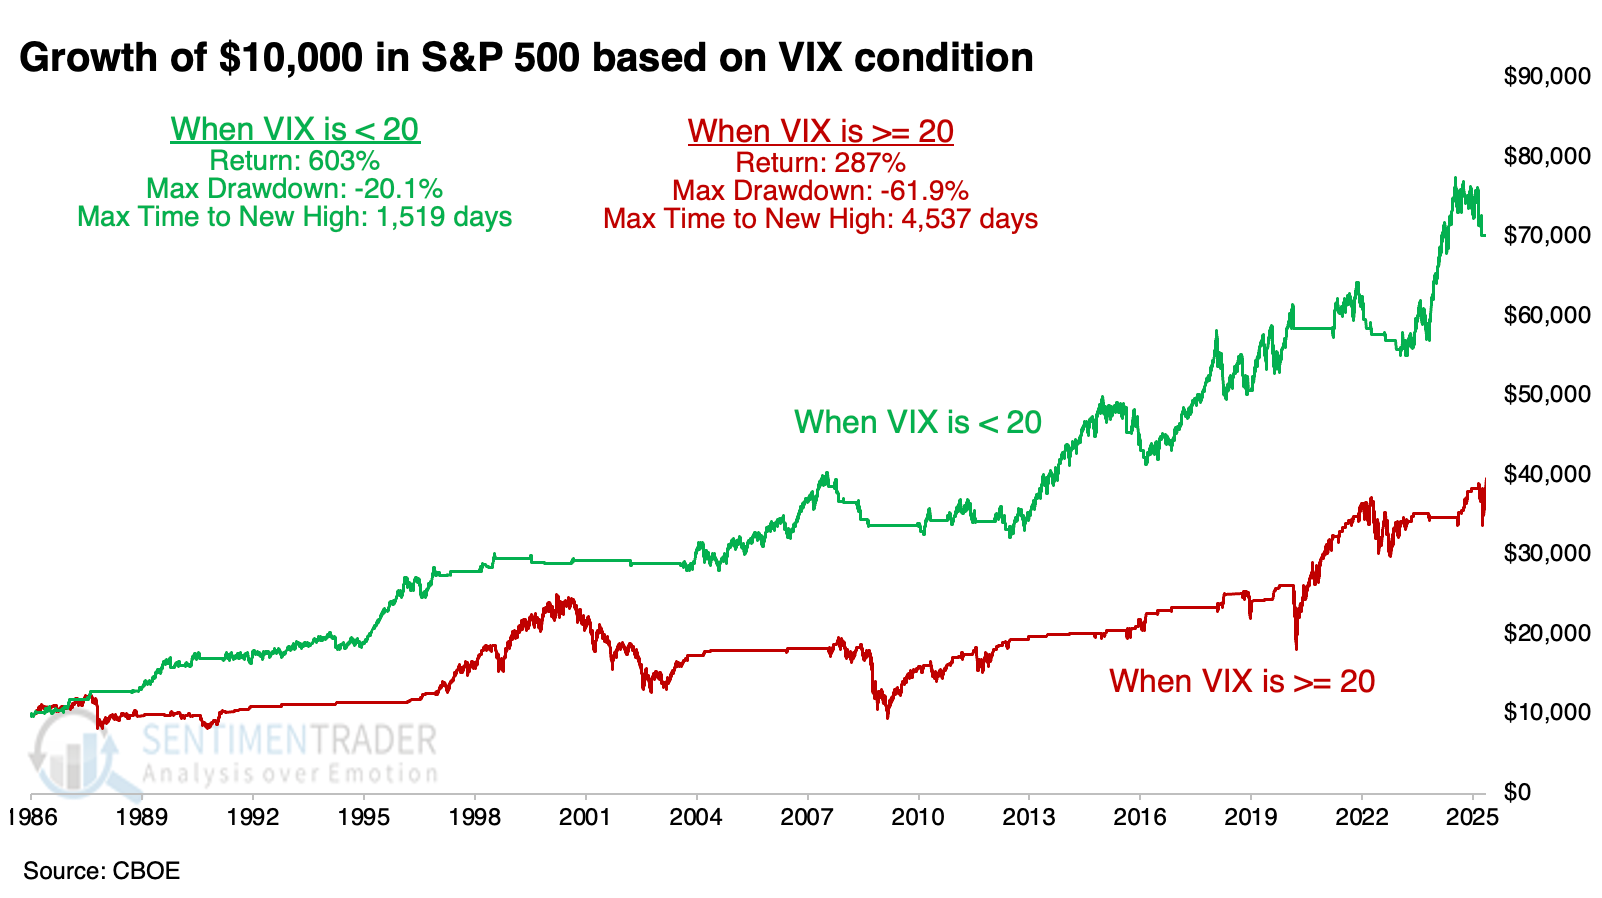
Investors don't like uncertainty. Uncertainty means volatility, and volatility increases the probability of seeing big negative numbers on account statements. When markets are calm, they're more likely to buy.
The chart below shows evidence of this. When the VIX "fear gauge" is below 20, the S&P 500 has fared much better using next-day returns than when the VIX is above that threshold.
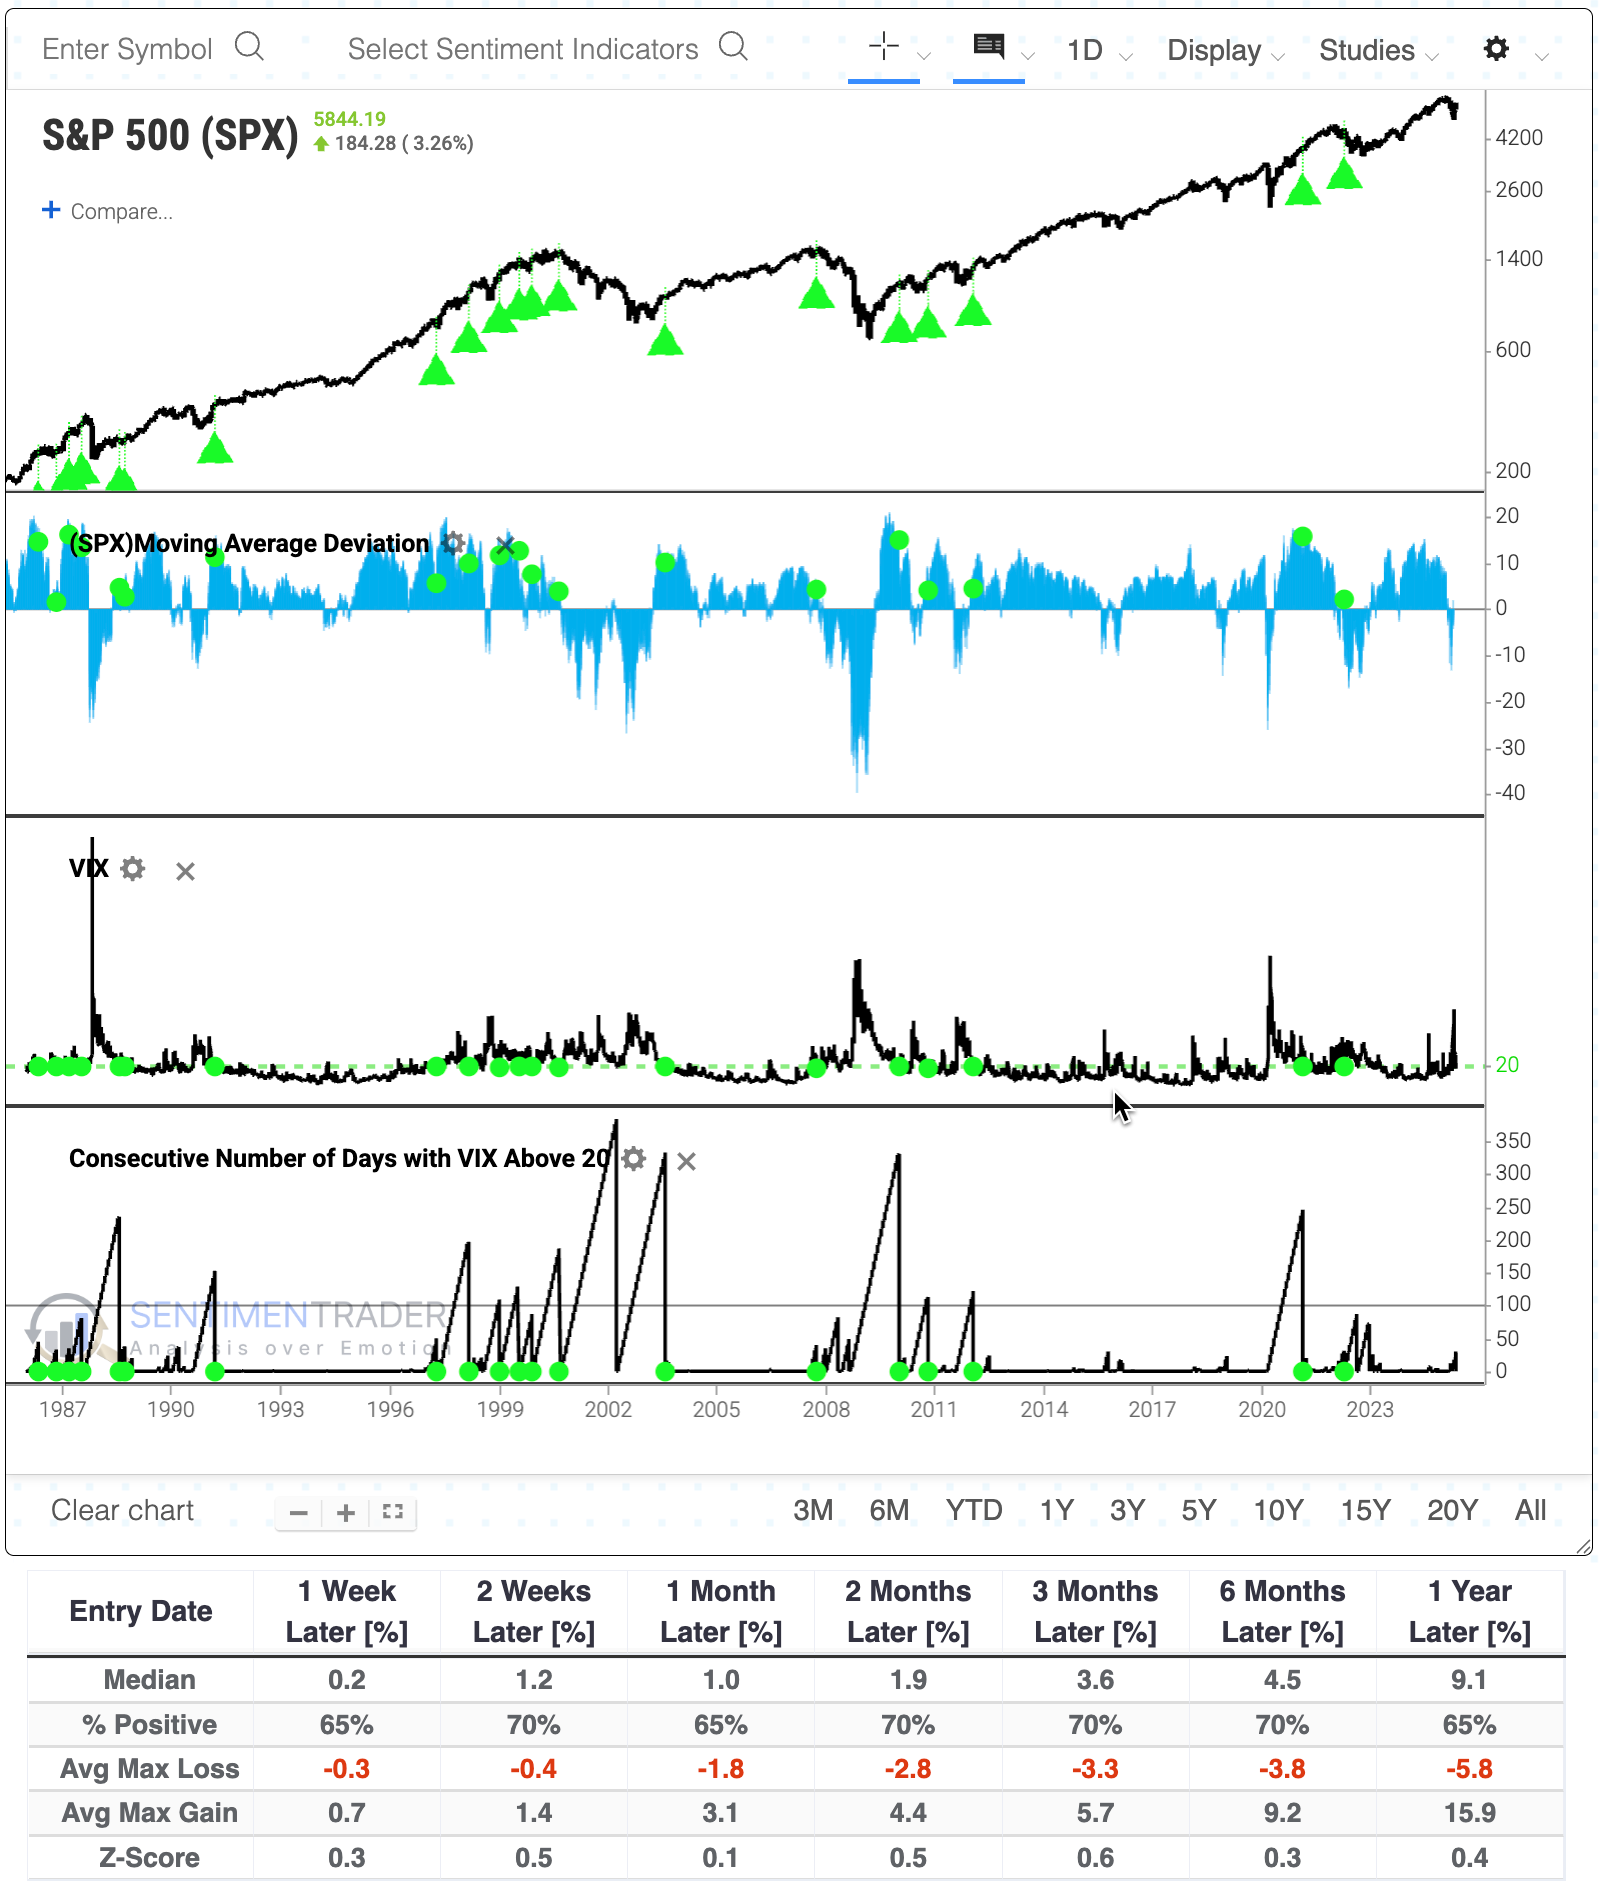
Using Backtest Engine 2.0, we can see how markets performed after the VIX finally closed below 20 after holding above it for at least 30 sessions. Overall, it wasn't very impressive.
One major distinction is that the S&P 500 has managed to spurt at least 1% above its 200-day moving average. When a VIX streak above 20 ended and the S&P was at least 1% above its average, future returns improved significantly. There were still some miserable failures, but average returns, consistency, and risk/reward improved across all time frames.
Among the major indexes, the Dow Industrials held up as well or better than the S&P. The more volatile Nasdaq Composite tended to see larger swings, with more losses, and the small-cap Russell 2000 even more so.
Most of the worst signals, those most likely to fail in the weeks and months ahead, were triggered when the VIX streak ended but the S&P was not at least 1% above its 200-day average. Every one of those signals showed a loss either two or three months later. These were truly horrendous signals.
A surge in monthly highs
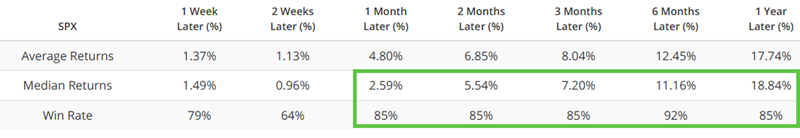
The percentage of S&P 500 stocks registering a 21-day high surged above 54%. Dean showed that comparable momentum in new highs saw the S&P 500 rally, with improved outcomes since 1950.
Following the weekend trade talks between the U.S. and China, stocks surged in response to optimism around cooperation. The rally triggered a thrust signal from one of the TCTM Composite Thrust Model components. When it exceeds 54%, as it did on Monday, it has historically signaled a favorable environment for equities.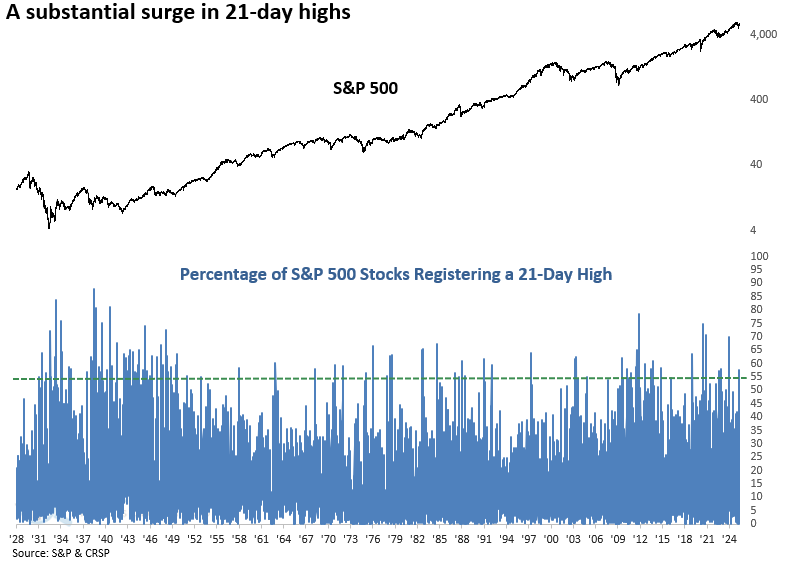
While returns and win rates following a surge in 21-day highs may seem unimpressive at first glance, it's important to note that the secular bear market from 1929 to 1942 weighed heavily on the results. Excluding that period, performance since 1950 has improved markedly, with the world's most benchmarked index lower a year later only four times, as shown by the red arrows in the chart.
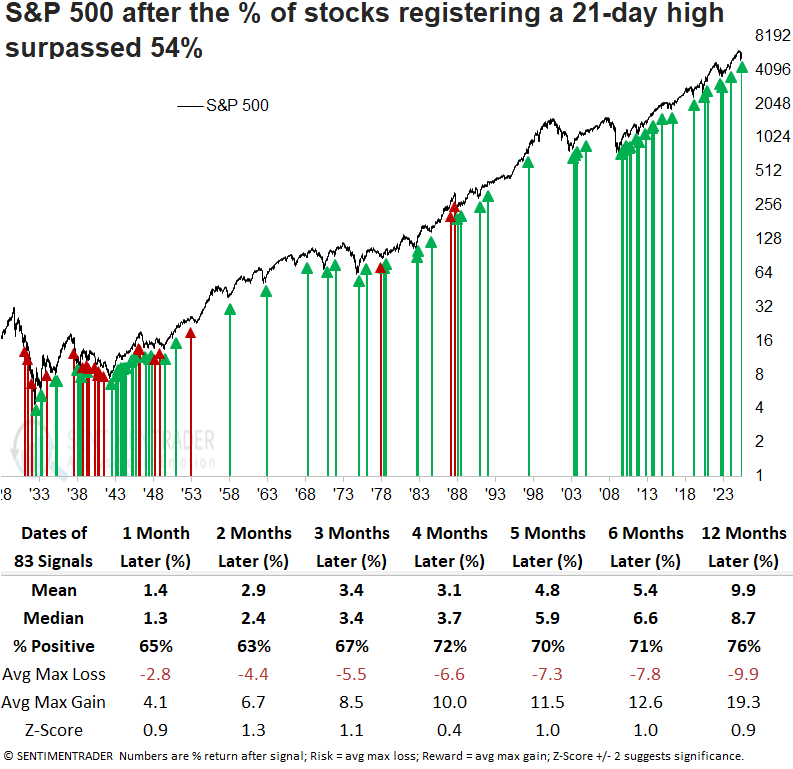
Since 1950, signals have demonstrated markedly improved returns and consistency, with every timeframe showing a win rate above 70% and several surpassing 80%. Furthermore, the five, six, and twelve-month windows displayed significance relative to random returns.
Every time consumer discretionary, financials, industrials, and technology had at least 65% of their stocks hitting 21-day highs on the same day, as they did on Monday, the S&P 500 was higher one year later without exception.
Should the S&P 500 maintain its upward trajectory, components within the TCTM Composite Confirmation Model, which integrates long-term breadth, price momentum, and trend metrics, will likely trigger alerts, confirming a potential transition from a bearish to bullish cycle.
The 200-day worry
A common refrain among technicians is that the longer an index (or stock, or market) holds below the widely watched 200-day moving average, the more dangerous the conditions. That's supposed to be a concern now since the S&P 500 has held below its average for more than 30 sessions.
Since the global financial crisis, it has held below its average for longer stretches, but not by much, except for the 2022 bear market. With Monday's reaction to tariff news, the streak may end soon, anyway.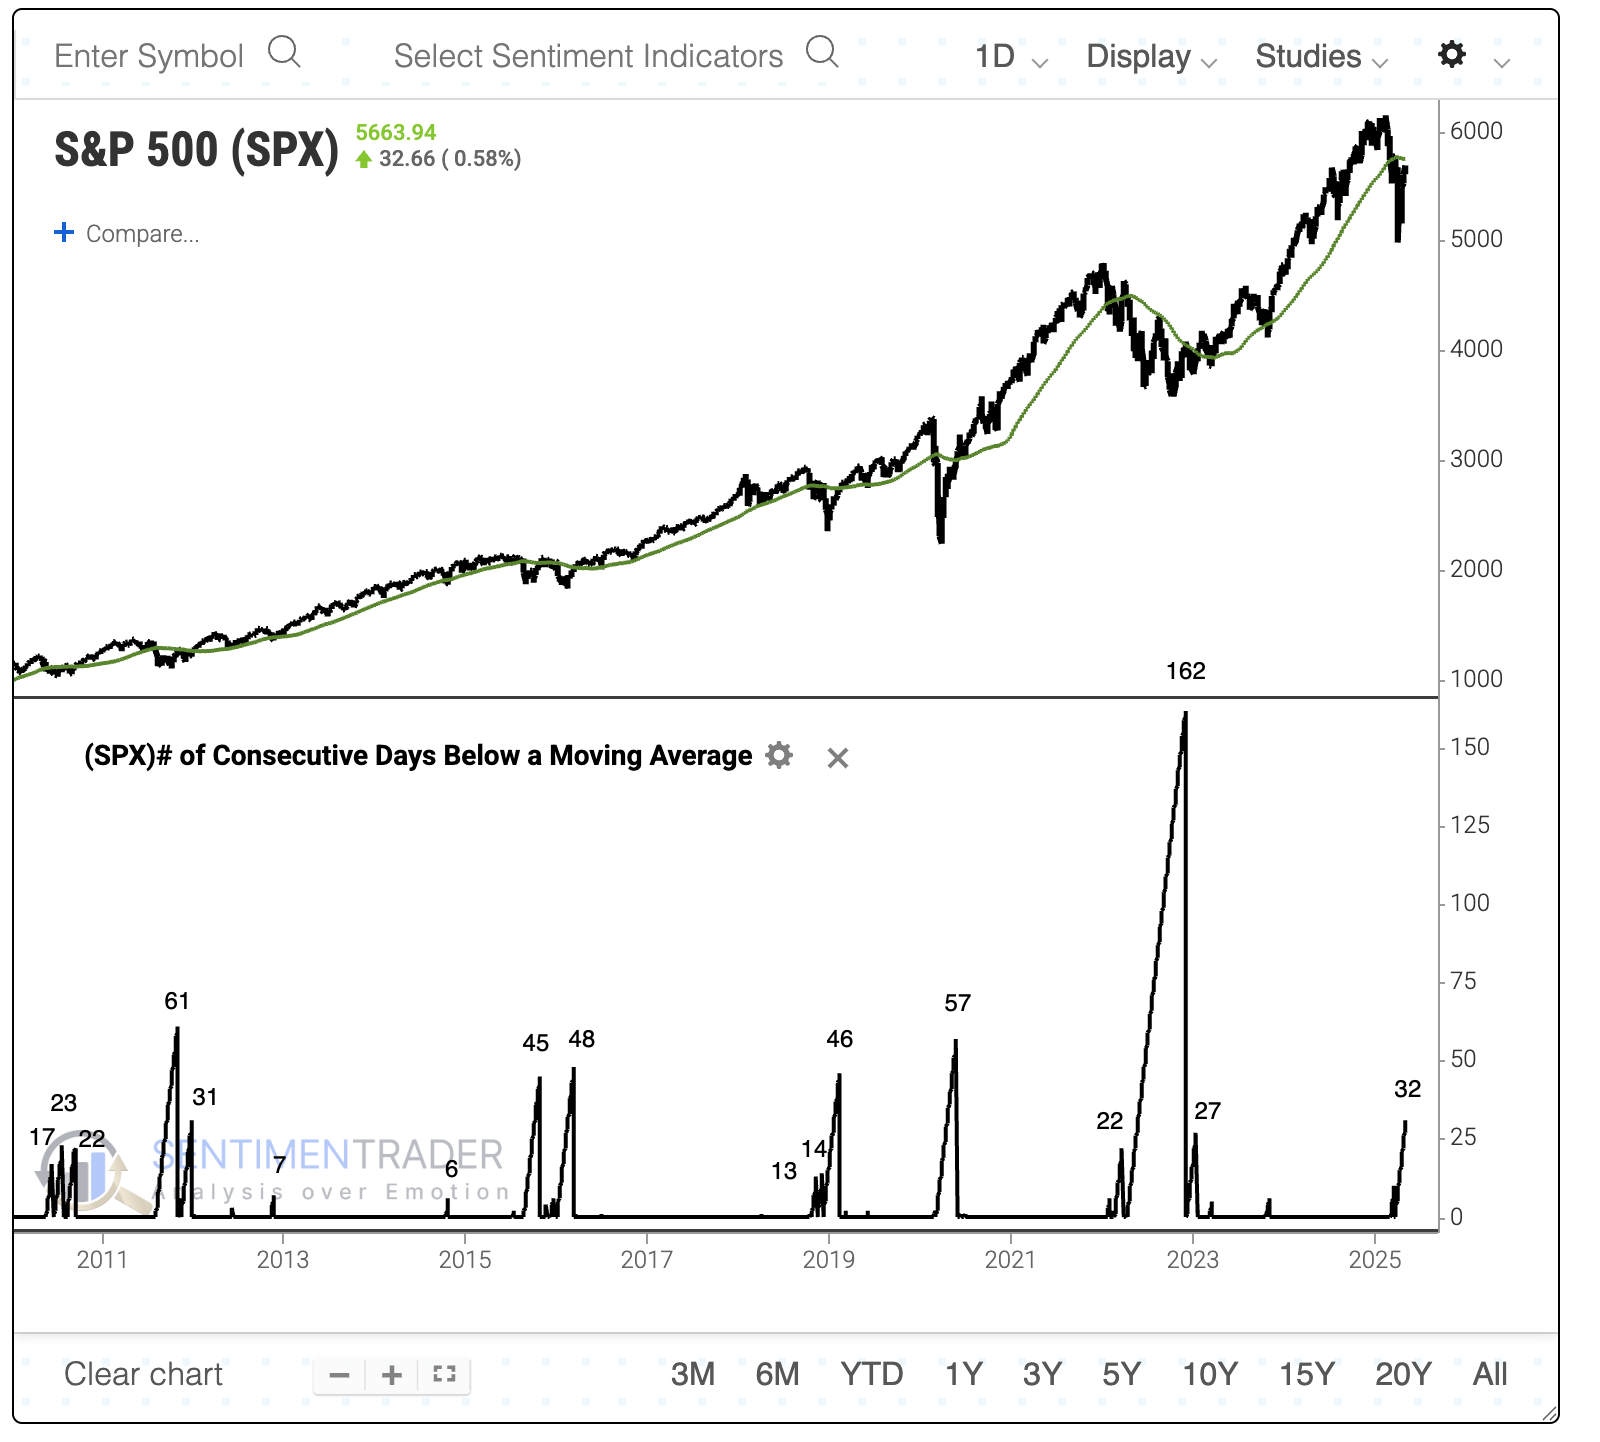
We looked at every time the S&P 500 cycled from at least a 3-year high to holding at least 30 sessions below its 200-day moving average. A handful of times, the S&P experienced tough times after these signals, with double-digit losses over the following year. But most of the time, of course, that did not happen.
The table below focuses on the quickest cycles, when the index took fewer than three months for its cycle. These reflect somewhat protracted downtrends soon after peaking. While the sample size is limited, each rallied over the following two months. The last three instances preceded double-digit gains over the following year.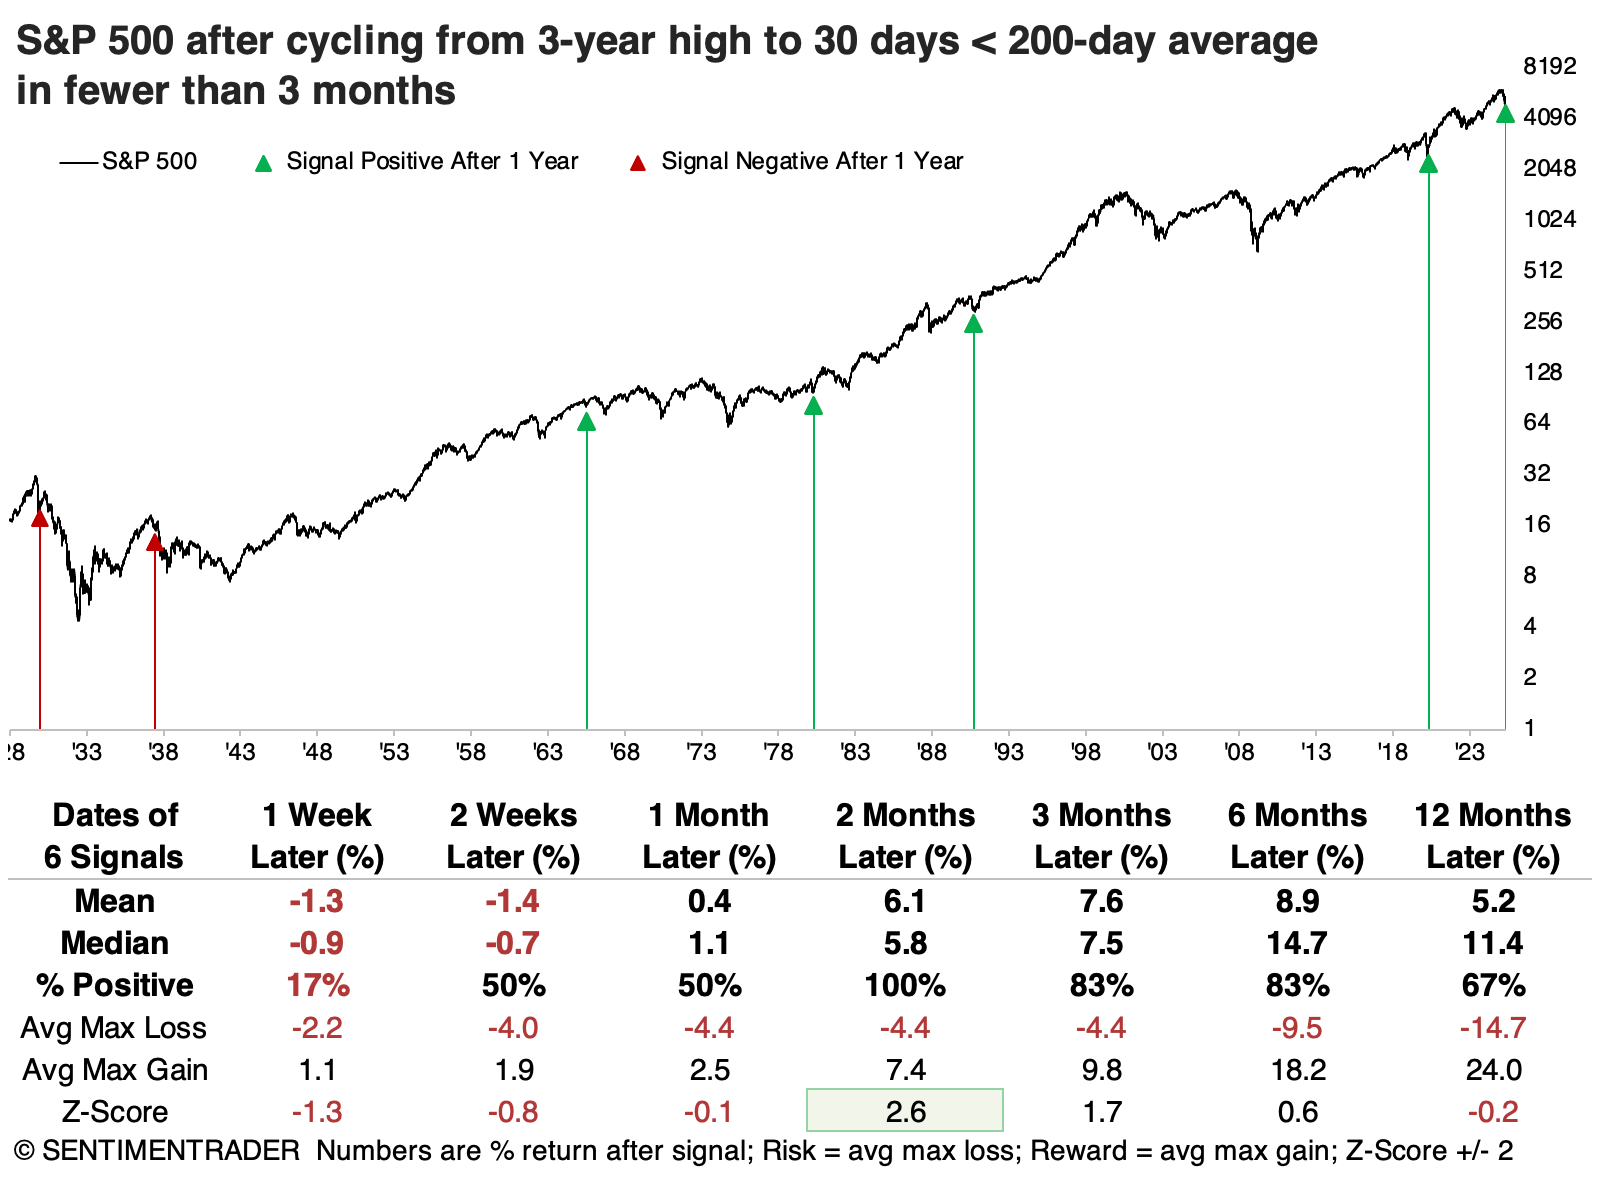
To get further context, we looked at times when the S&P took fewer than 90 days to cycle from a high to holding more than 30 days below its 200-day average, and was within 5% of its average at the 30-day mark.
The thumbnail charts below show the S&P's path following these signals. There was an outright failure in 1937, and two hefty drawdowns over the next four months in 1953 and 1966. The others were mostly up-and-to-the-right.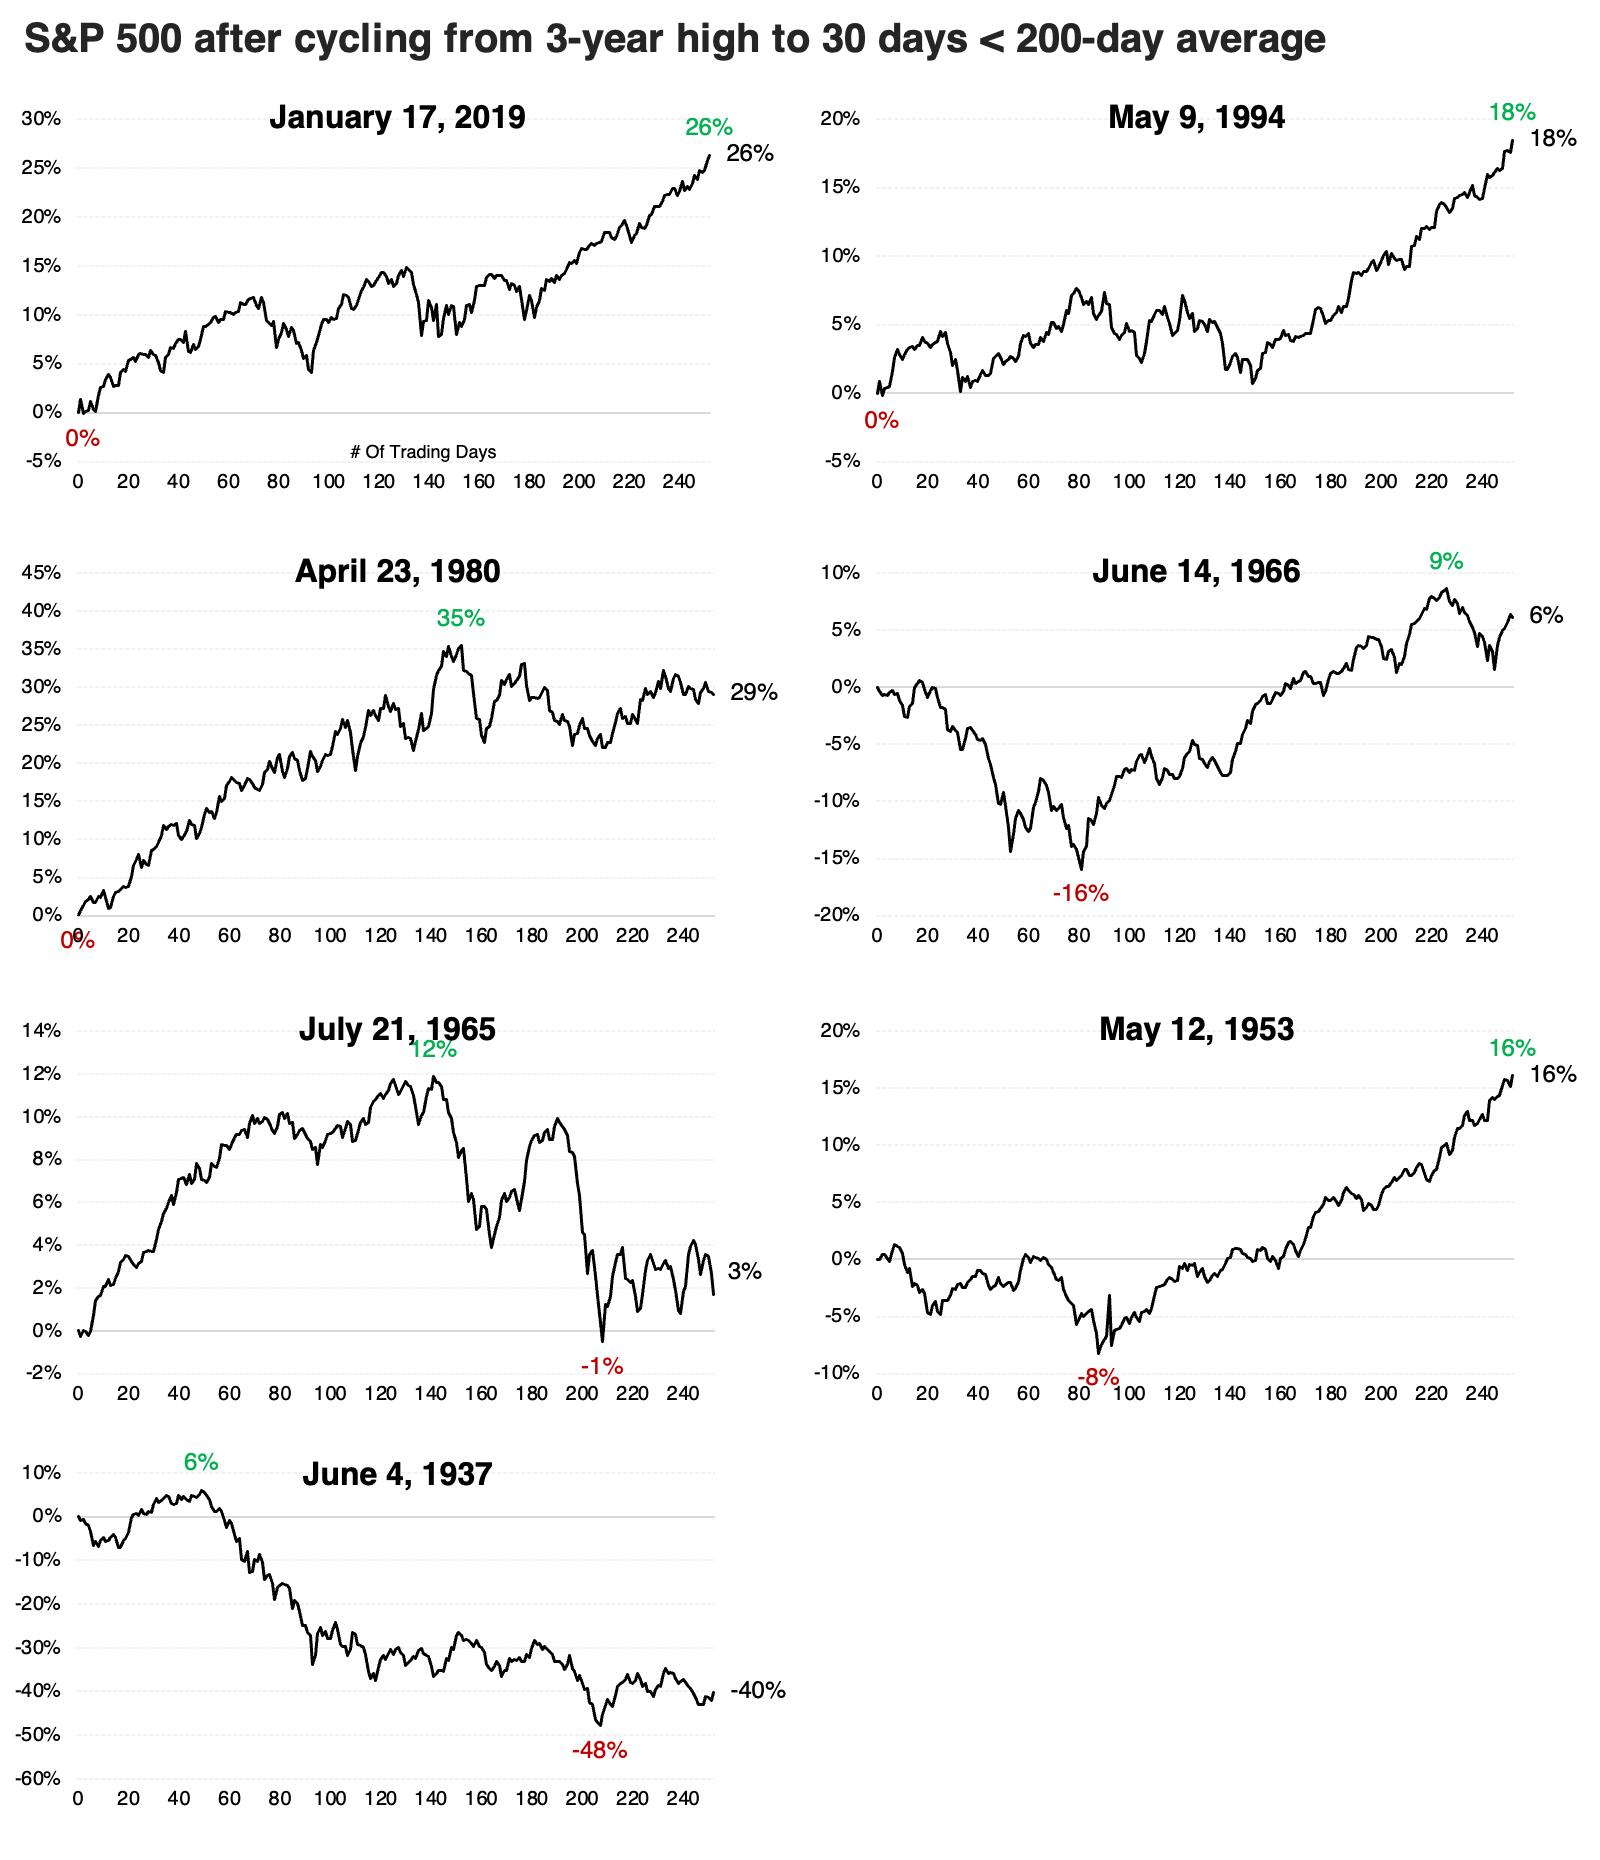
Improving Nasdaq trends
The Nasdaq Composite's trend score jumped by four points over five trading sessions. Dean noted that similar trend shifts saw the technology-heavy index rise 94% of the time over the subsequent year.
Our proprietary trend score indicators are an excellent resource for investors aiming to stay aligned with the prevailing market trend or spot early signs of a shift. On Monday, the Nasdaq Composite's trend score jumped by four points over a five-day window, triggering a buy signal for the technology-heavy benchmark.
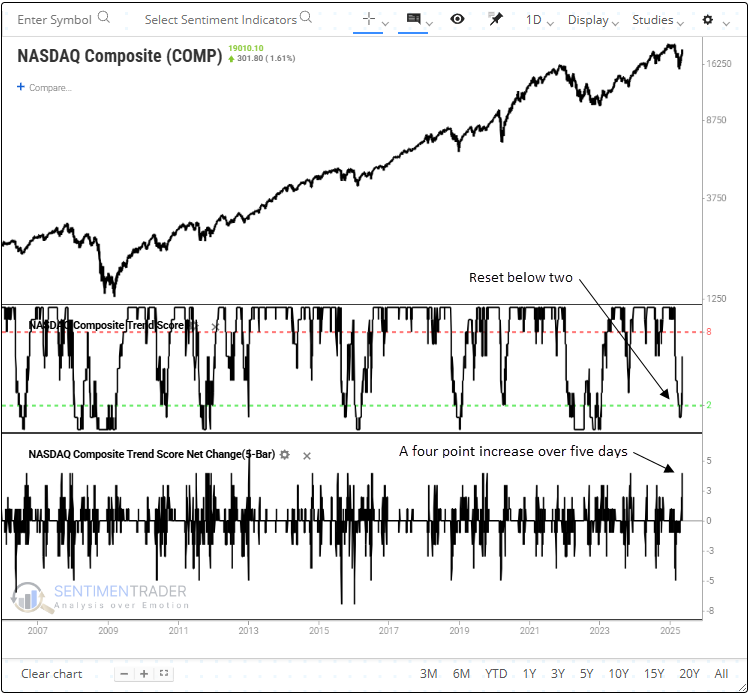
Two additional conditions must be satisfied to activate the signal. The trend score must first decline below a reading of two, and the index must exhibit positive short-term price momentum in conjunction with the net change surge.
Whenever the Nasdaq Composite's trend score climbed by four points over five days, the technology-heavy index displayed outstanding returns and consistency over the next year. Furthermore, six out of seven horizons displayed significance relative to random returns. The lone loss in the one-year time frame coincided with the 1987 crash, an outlier event.
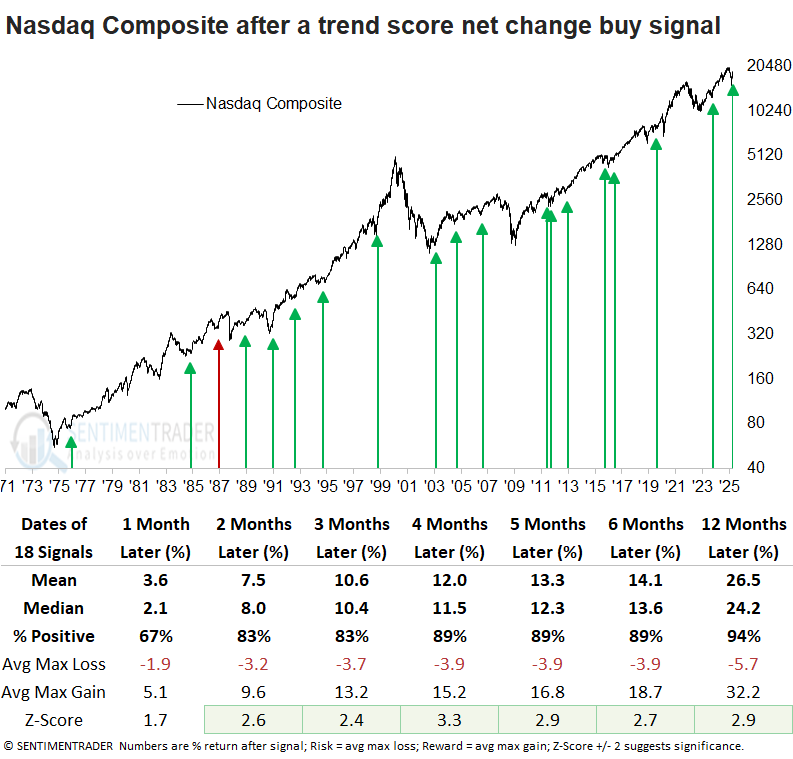
A year later, the Nasdaq Composite declined more than 10% only four times. In contrast, it posted rallies of over 10% in 17 out of 18 occurrences, suggesting a favorable risk/reward scenario.
Cyclical sectors have historically outperformed defensive groups following Nasdaq trend shifts, a scenario likely to persist as markets transition from bearish to bullish conditions.
Dean also noted that semiconductors, an industry fueling the AI phenomenon, experienced a four-point increase in its trend score over five sessions, activating a buy signal.
Some more favorable indicator signals
Jay suggested that when a variety of typically reliable indicators generate favorable signals within a short time, it often signifies a buying opportunity for stocks.
He discussed buy signals generated from the percentage of S&P 1500 stocks in overbought territory, which is recovering from a low level and has preceded gains for stocks. A similar thing can be said for the Risk Appetite Index, which is showing renewed risk-seeking behavior among investors.
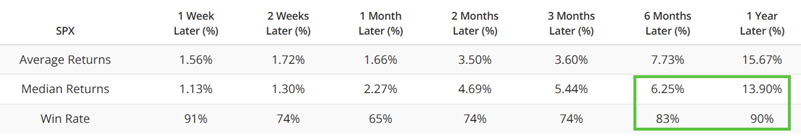
Speaking of longer-term favorable confirmations, the chart below highlights all dates when the 10-day moving average of our Aggregate Signal Model crossed above 0.58. The model is constructed as an aggregate of a multiple of signals systems shown on the site.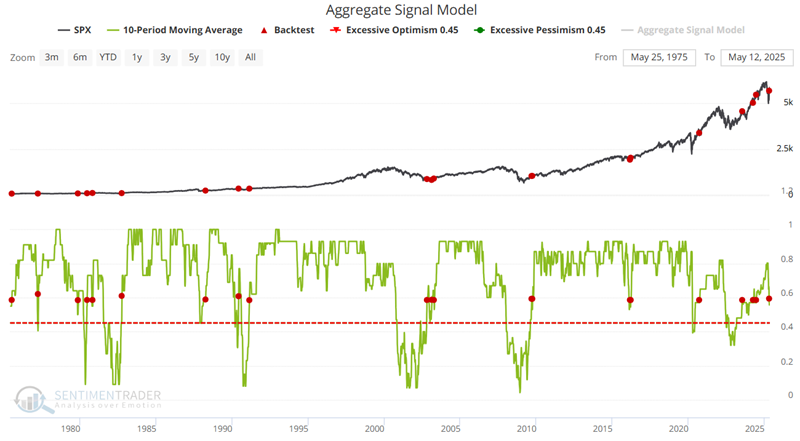
The chart below highlights all dates when the 20-day moving average of our Risk Appetite Index crossed above 0.13. Again, it shows a strong tendency for positive forward returns in the S&P 500.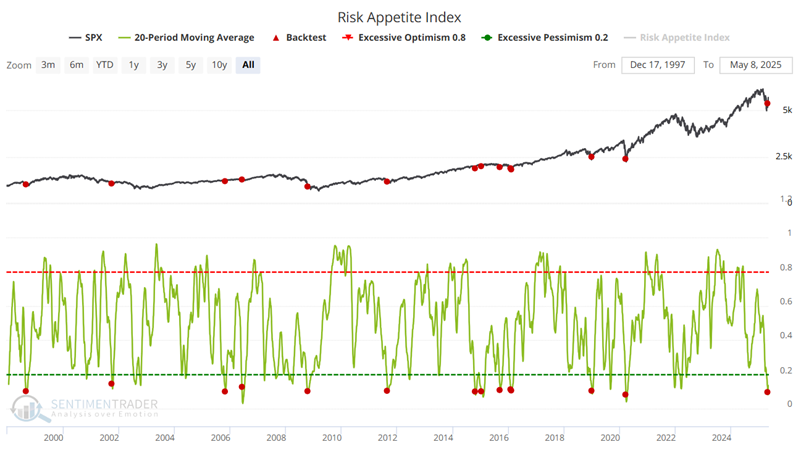
"Sell in May" considerations
Overall, the phrase "Sell in May" should probably be replaced with "adjust your expectations starting in May". Jay noted that despite favorable indicator signals, one useful "Sell in May" model suggests it may not necessarily be smooth sailing between now and the end of October.
It is a fact that the stock market performed much better from November through April than from May through October. The hypothetical growth of $1 in the S&P 500 from November through April starting in 1950 grew 11,756% to $118.56.
The chart below displays the hypothetical growth of $1 in the S&P 500 from May through October starting in 1950. $1 grew 186.7% to $2.88.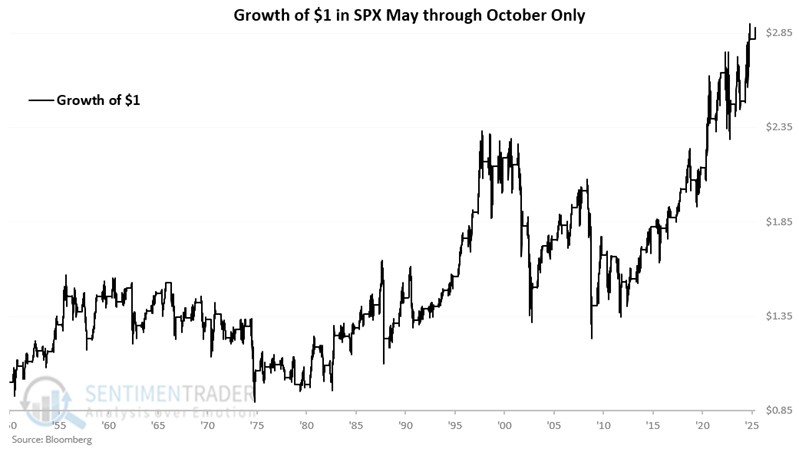
So 11,756% is indisputably better than 186.7%. But 186.7% is still ultimately a meaningful gain.
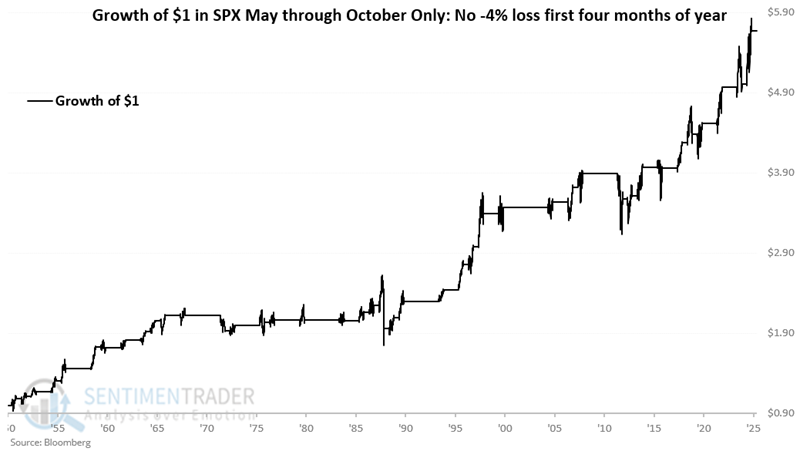
Now, let's consider the S&P 500's performance during the first four months of the year in deciding whether or not to "sell in May." If the S&P 500 index does not register a 4% or more decline for the year by April 30th, we will NOT sell in May. If it does register a decline of 4% or more during the first four months, we will sell in May and stay out of the market until October 31st.
The chart below displays the hypothetical growth of $1 invested in SPX from May through October only during years when the worst year-to-date decline through April did not exceed -4%. $1 grew 467.1% to $5,67.
The chart below displays the hypothetical growth of $1 invested in SPX during May through October only during years when the worst year-to-date decline through April was -4% or greater. $1 declined -49% to $0.51.
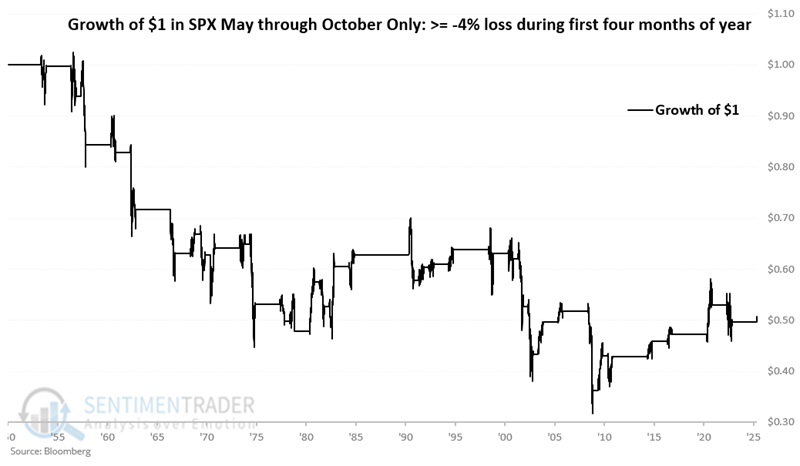
This suggests that investors press their bets if the market holds up well during the first four months (i.e., no loss of -4% or more). It also suggests that investors adjust their expectations if the market struggles significantly at some point during the first four months.
More about "Sell in May"
Jay continued with Part II, which will add a price trend factor to the mix. When both factors are unfavorable, the probability of a meaningful stock market advance is well below average.
For our test, we will add a one-year moving average (252 trading days to be specific). The question is "Is the S&P 500 above or below its 1-year average?" The chart below shows that the percentage of the S&P 500 has been above or below its 252-day average each day since 1950.
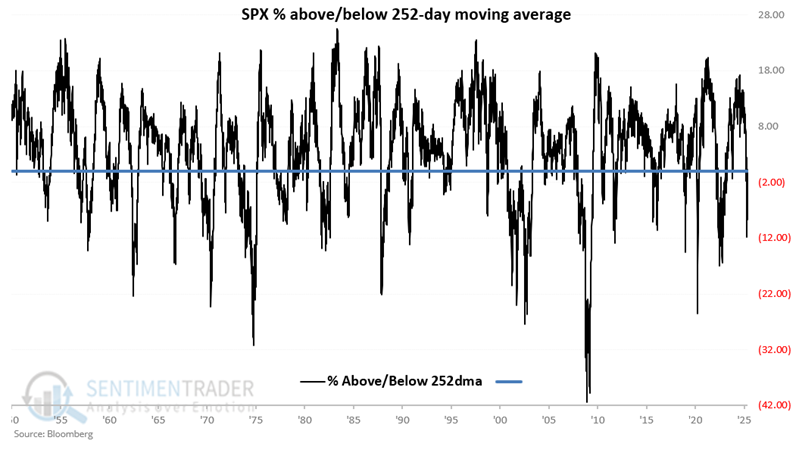 IF today is between May 1st and October 31st AND the S&P 500 experienced a maximum loss of -4% or more at any point during the first four months of the year, AND the S&P 500 closed yesterday below its 252-day moving average, then the model = -2 (i.e., this model is unfavorable for stocks). Under any other circumstance, this model is favorable for stocks.
Note that the Sell in May Model flipped from unfavorable to favorable after the close on 2025-05-12.
In other words, by moving back above -2, the model has gone from unfavorable to favorable. Note that if the S&P 500 sinks from its current level and drops back below its 252-day average, the model could easily flip back to unfavorable.
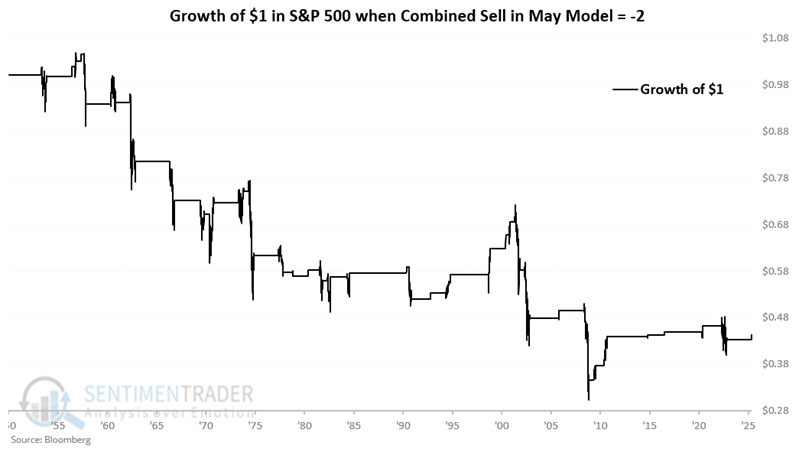
Why might any of this matter? The chart below displays the hypothetical growth of $1 held in the S&P 500 only if the model was -2. From 1949-12-31 through 2025-05-09, $1 invested in the S&P 500 Index declined by 56% to $0.44.
Conversely, the chart below displays the hypothetical growth of $1 invested in the S&P 500 only when the model is NOT -2.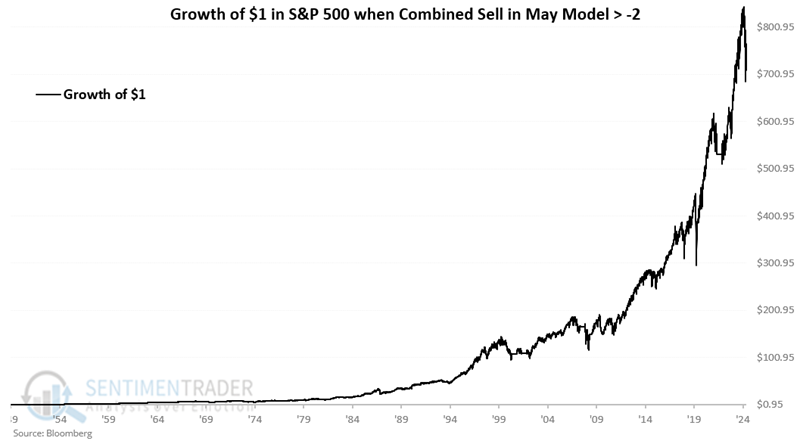
Remember that if SPX closes below its 252-day moving average (which it could easily do), the model will return to an unfavorable -2 reading.
Non-USA is outperforming
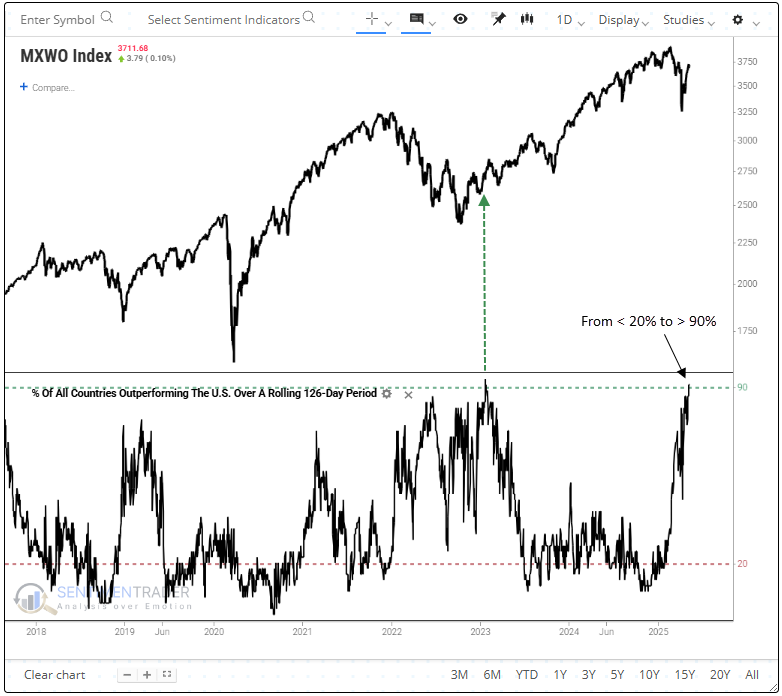
Over the last six months, more than 90% of MSCI country indexes have outperformed the USA. Dean showed that similar relative trends led to gains in a global index 100% of the time over the next five, six, and twelve months.
As illustrated in the chart below, the last time the percentage of country indexes outperforming the U.S. over a rolling six-month period cycled from below 20% to above 90%, equities were in the initial stages of emerging from the 2022 bear market. Will history repeat?
Our Global Index Breadth Overview page features 35 indicators, including the rolling six-month percentage of country indexes outperforming the U.S., segmented by region, developed and emerging markets, and all countries.
Whenever the proportion of MSCI country indexes outperforming the U.S. index over a rolling six-month period cycled from below 20% to above 90%, the MSCI World Index rose over the subsequent five, six, and twelve months without exception. Furthermore, the five and six-month windows exhibited significance relative to random returns.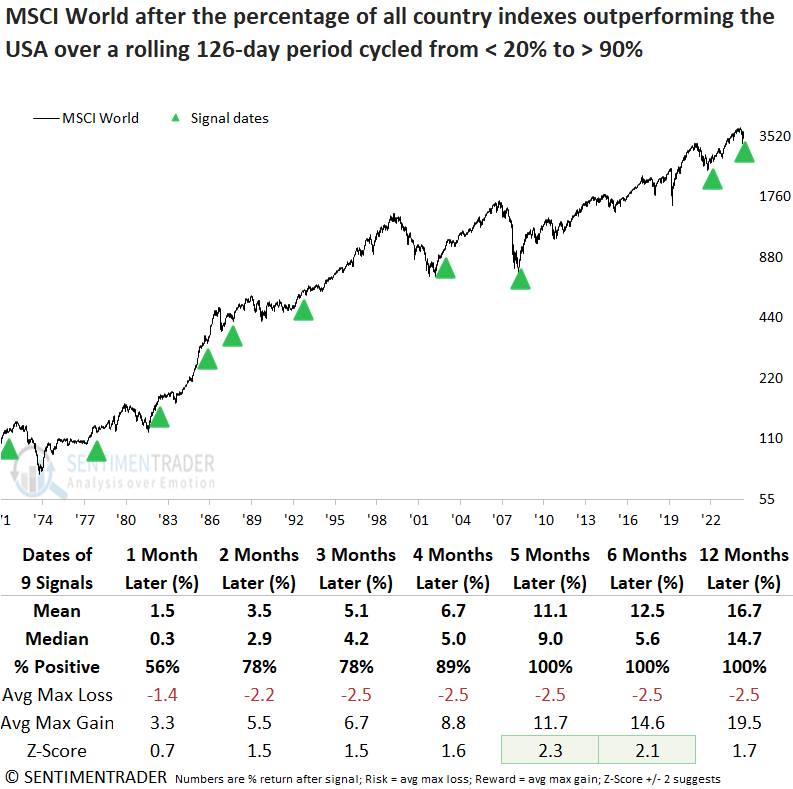
Over the following twelve months, the MSCI World Index experienced just two maximum losses greater than 5%, with none exceeding 10%, indicating a favorable risk/reward environment.
Historically, when a significant proportion of countries outperform the U.S. over six months, it hasn't led to sustained global leadership. The MSCI World Index generally underperformed the S&P 500 over the next one to five months, and even the mild advantage from six to twelve months wasn't particularly compelling.
About TradingEdge Weekly...
The goal of TradingEdge Weekly is to summarize some of the research published to SentimenTrader over the past week. Sometimes there is a lot to digest, and this summary highlights the highest conviction or most compelling ideas we discussed. This is NOT the published research; rather, it pulls out some of the most relevant parts. It includes links to the published research for convenience, and if you don't subscribe to those products, it will present the options for access.