
TradingEdge Weekly for May 13 - More new lows, washed out sentiment, tightening financial conditions

Key points:
- There has been a big spike in 52-week lows on the NYSE and Nasdaq exchanges
- More than half of S&P 500 stocks have dropped into bear markets
- That index's valuation has now declined more than 35% from its peak
- Falling stocks and credit are causing financial conditions to tighten quickly
- More fundamental inputs are deteriorating
- Given all the above, it's no wonder that sentiment is appearing to be washed out
- Bonds and Biotech are entering positive seasonal windows
Buy-the-dip is dead
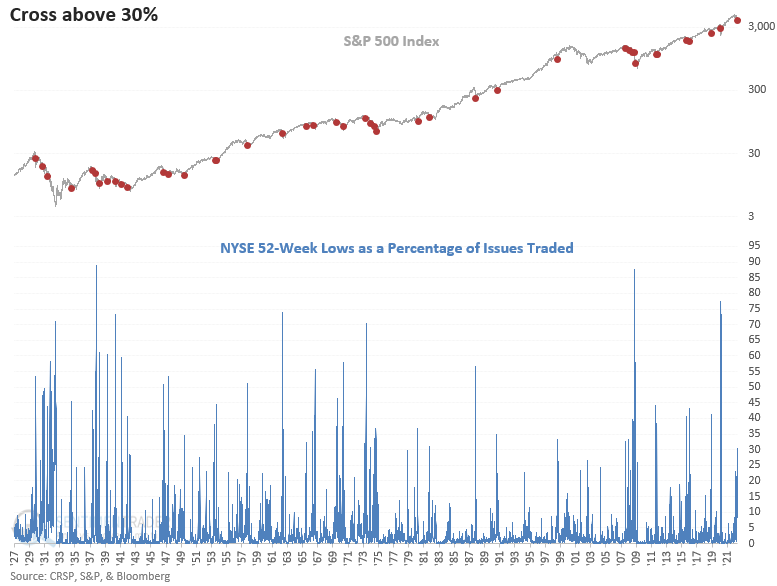
Due to persistent weakness in stocks and bonds, Dean noted that 52-week lows for NYSE issues surged above 30% on Monday.
The cross above 30% on Monday seems low compared to other significant corrections since the 2009 bottom. However, most stocks showed substantial gains over the past year. So, the strike price for a 52-week low resided at a much lower level than what typically occurs after a significant market top.
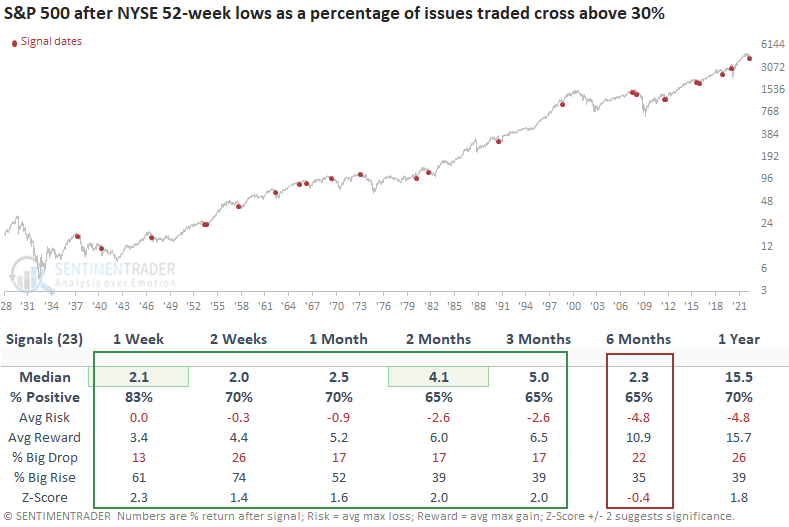
This study generated a signal 42 other times over the past 93 years. After the others, S&P 500 future returns and win rates suggest the market can bounce in the next few months.
When the S&P 500 was within 20% of a multi-year high at the time, returns improved. This study generated a signal 23 other times over the past 85 years. The S&P 500 closed higher in the first week for 17 consecutive signals since 1962. Once again, the study shows a dropoff in performance in the 6-month time frame, which means we should keep an open mind about a potential retest if a bounce commences.
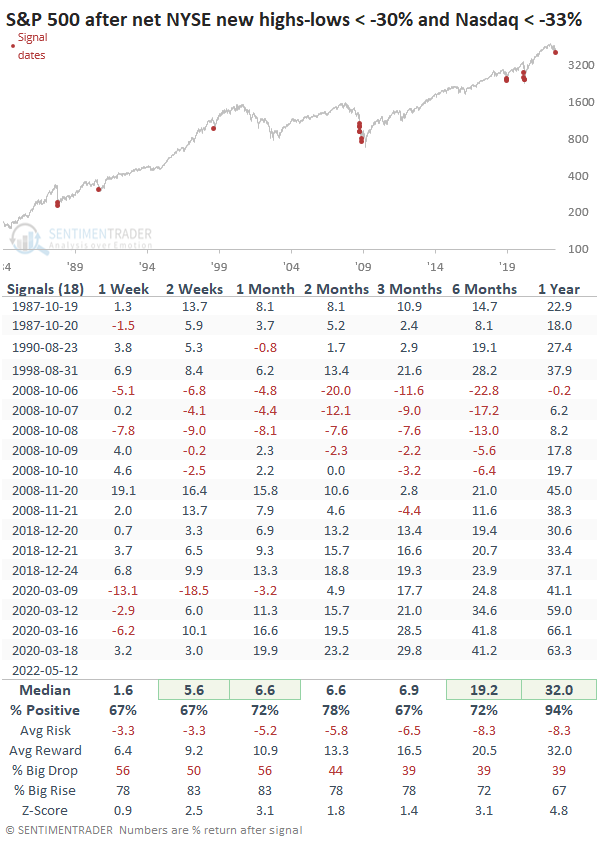
By Thursday, there was another spike in new lows, on both the NYSE and Nasdaq exchanges. A few of these preceded drastic losses at some point in the first couple of months, but all except one signal led to a rise in the S&P 500 over the next year (and that sole loser was tiny).
More bear markets
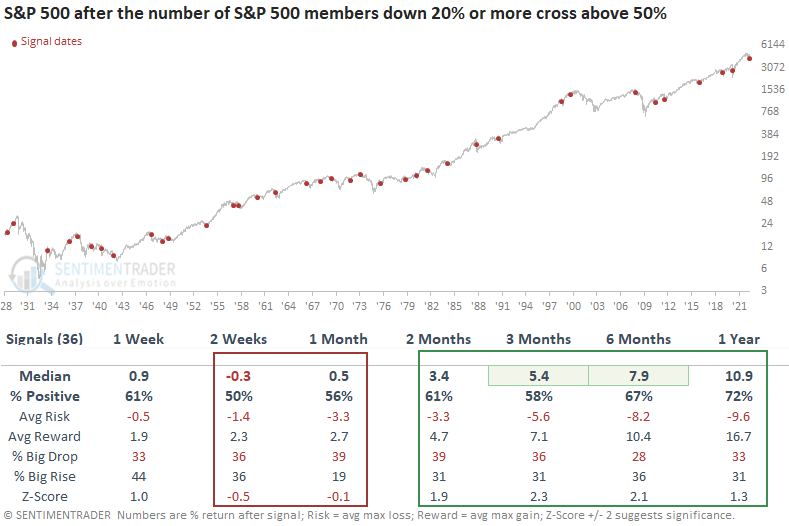
Dean also showed that more than half of S&P 500 stocks are down 20% or more from a 252-day high.
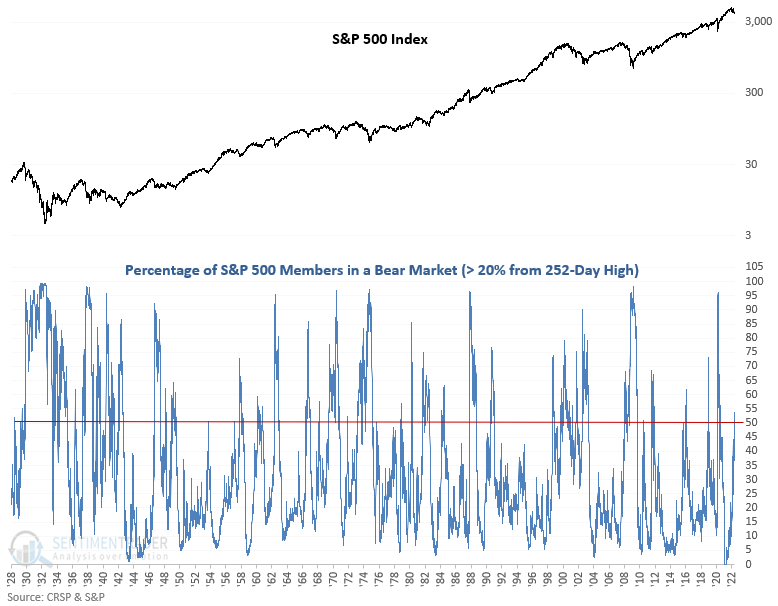
After so many stocks fell into bear markets, S&P 500 future returns, win rates, and risk/reward profiles were somewhat muddled in the near term. However, the medium-term results look better, especially the 3 & 6-month time frames.
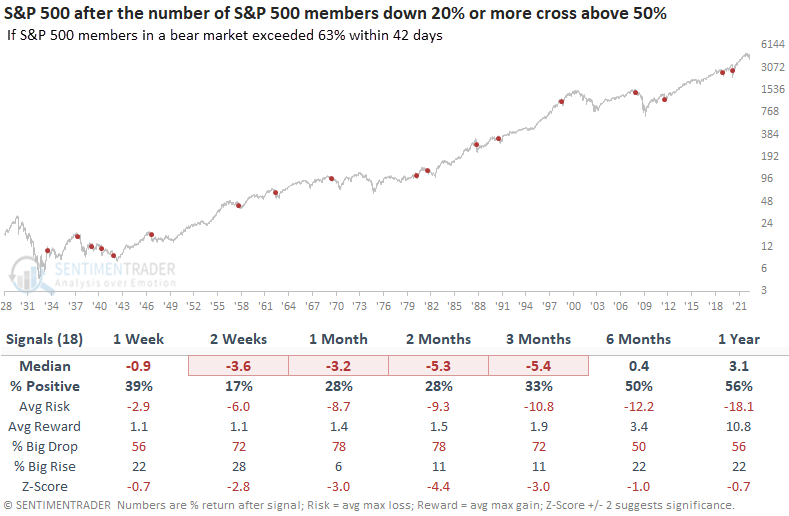
It was worth paying attention to what happened during the first couple of months after this triggered. If more than 63% of stocks ended up falling into a bear market, it preceded very weak returns across time frames.
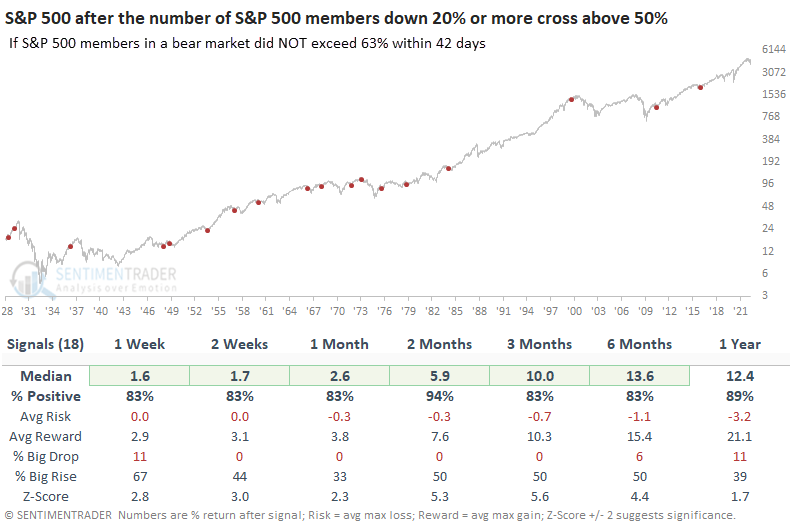
However, if fewer than 63% of stocks ended up falling into a bear market, it preceded consistent gains. This bears watching over the next couple of months.
Valuations are pulling back even more than prices
Stock prices have taken a tumble, but as-reported earnings haven't. Prices usually lead earnings, so it's possible (probable, even) that earnings will start to decline.
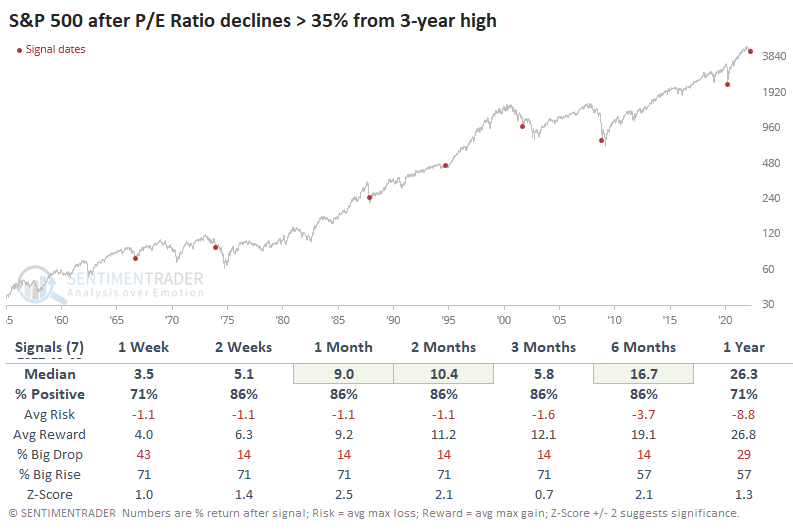
But they haven't yet, so the combination of falling prices and steady or even rising earnings has caused the S&P 500's Price/Earnings Ratio to plunge. While the S&P has pulled back less than 15% from its one-year high, its valuation metric has plunged more than twice as much, more than 35%.
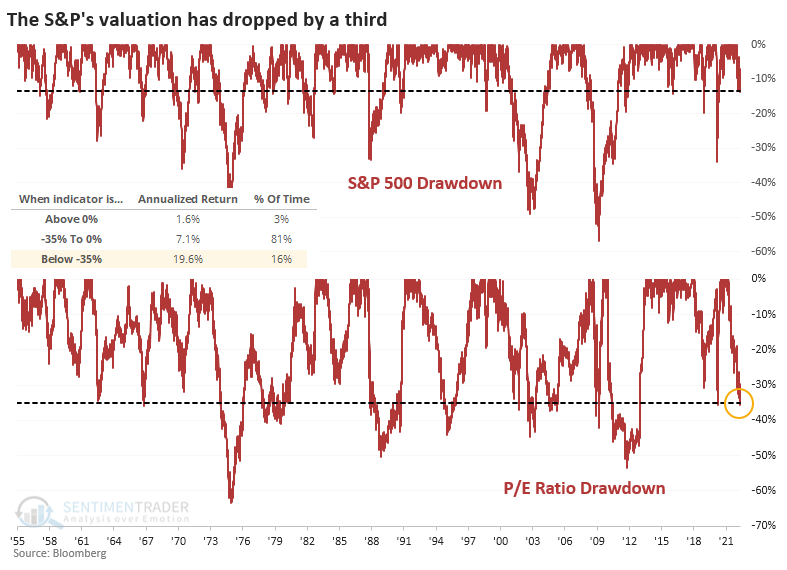
The S&P 500's annualized return when its P/E Ratio was more than 35% off its peak was an impressive +19.6%, thanks to large and persistent rebounds following protracted selloffs.
The table below uses a signal-based approach, looking at the S&P's future returns once its valuation dropped by more than 35% from a multi-year high. Over the medium-term, its performance was very good, with only isolated and small losses.
Falling stock prices are helping to tighten financial conditions
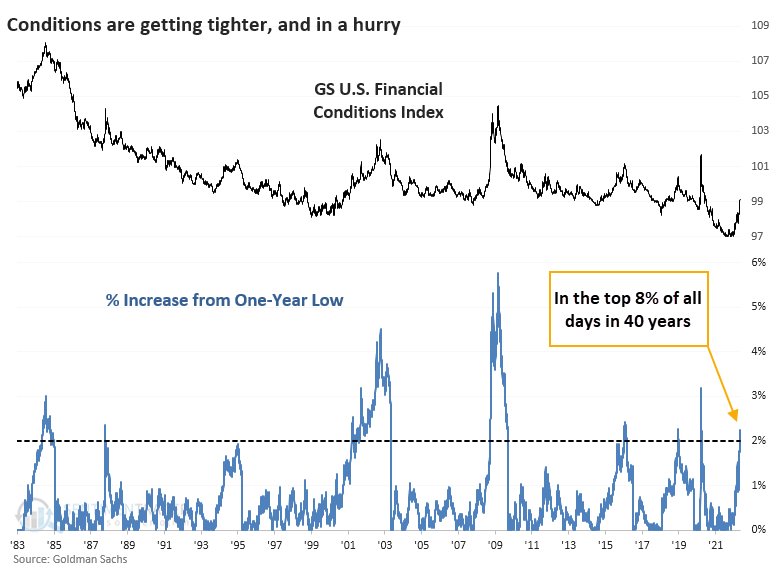
With a plunging stock market, rising interest rates, and increasing currency volatility, financial conditions are tightening fast. The Goldman Sachs U.S. Financial Conditions Index has soared since it was sitting at all-time lows less than six months ago.
While a 2% tightening in financial conditions doesn't sound like much, it ranks in the top 8% of all readings over the past 40 years. It has also happened very fast - it's the third-quickest tightening out of all cycles, behind the crashes in 1987 and 2020.
Once financial conditions tightened 2% from a low, the S&P 500 tended to suffer short-term losses. While short-term returns were weak, over the medium- to long-term, the only losses were in 2008 and 2001 - granted, huge exceptions. But even 2001 saw a multi-month rebound before failing again.
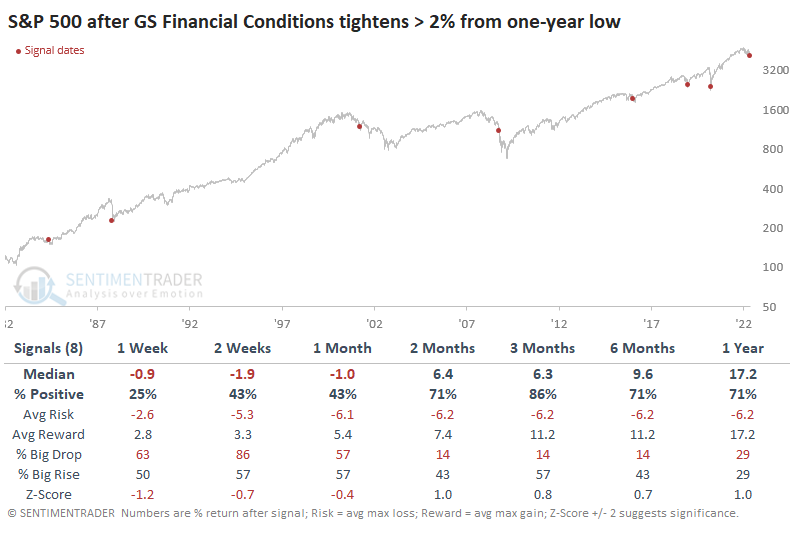
Part of the reason why stocks tended to rebound over the next several months is that conditions tended to get more favorable. The yield on 2-year Treasuries declined over the next 3-6 months every time.
The Nasdaq Composite and Russell 2000 struggled during the first month, then showed better returns. Overseas markets, especially emerging markets, performed horribly in the first month, then tended to rebound over the medium- to long-term.
The U.S. dollar did well in the immediate aftermath of the tighter conditions, which meant that commodities and gold struggled.
Maybe investors are pricing in deteriorating fundamentals
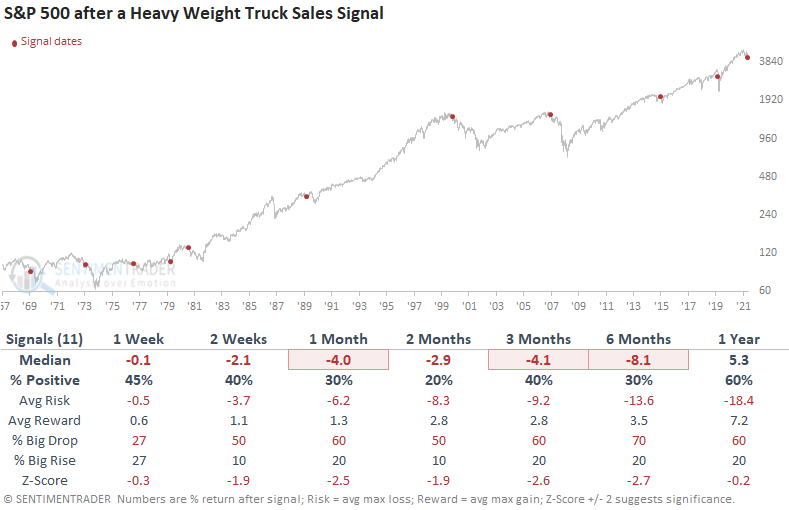
Dean noted that on Friday, the Burea of Economic Analysis released the April data for heavyweight truck sales. Heavyweight trucks move a large percentage of the dollar value of freight around the country and when it contracts, it can foreshadow a slowdown in overall economic growth.
When the year-over-year change in truck sales is -2.5% or worse and the S&P 500 is below its 12-month moving average, it can indicate recessionary conditions.
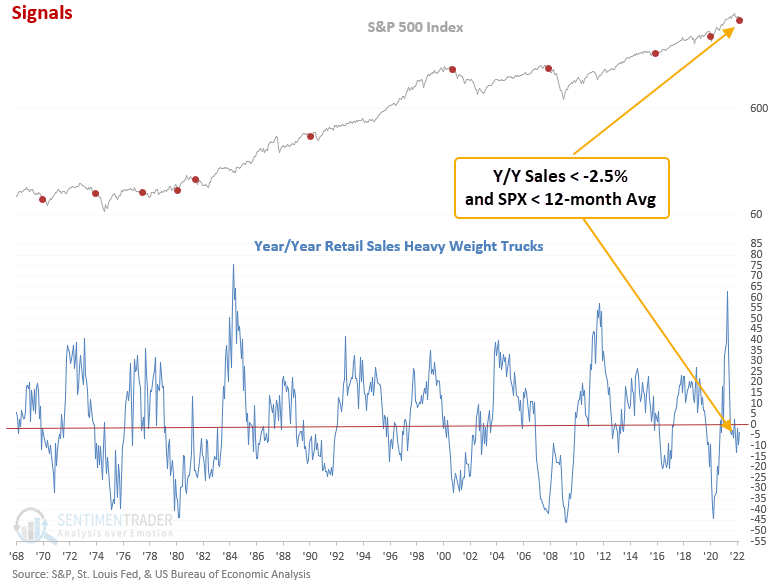
This indicator generated a signal 11 other times over the past 52 years. After the others, S&P 500 future returns, win rates, and risk/reward profiles were unfavorable across short and medium-term time frames. Returns were negative at some point in the first 6 months in 11 out of 11 instances.
Defensive sectors and industries performed much better, while cyclical groups were underwhelming, especially financials.
About the only potential positive - the mood is so bad it might be good
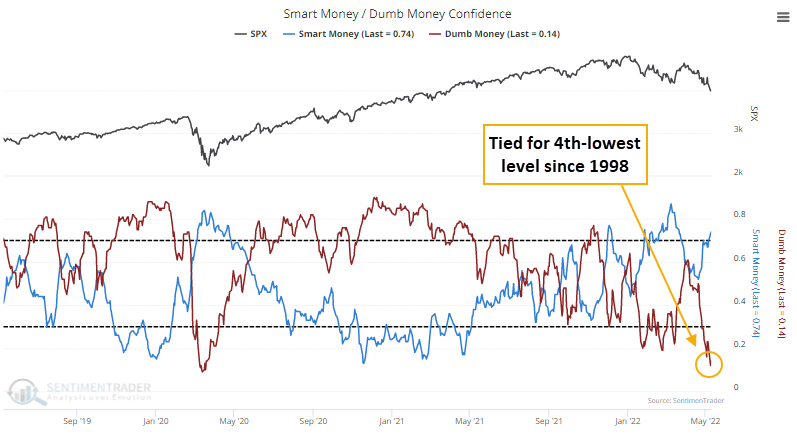
The Dumb Money is panicking while the Smart Money is buying. For only the 11th time since we began calculating it in 1998, Dumb Money Confidence in a rally fell to only 12% this week. After all ten of the other readings, stocks rallied by double digits in the months ahead.
At the same time, Smart Money Confidence has climbed well above 70%. There have only been a handful of times both indicators were at such opposite extremes simultaneously.
At various times, either Dumb Money Confidence or Smart Money Confidence is at more of an extreme than the other is. So even if one side isn't particularly stretched, the spread between them could be. Because of the wide moat between the two Confidence indexes, that spread is now wider than +60%.
The Backtest Engine shows that some readings above +60% occurred during protracted bear markets. Even so, the S&P 500 sported a positive return over the next two months after 82 out of 87 days. The losses were all small: -1.2%, -2.3%, -0.7%, -1.0%, and -1.5%.
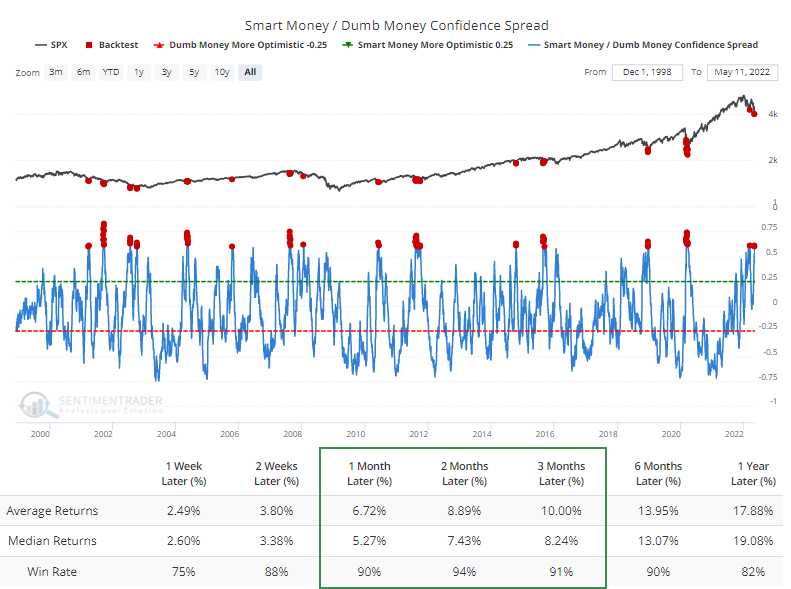
There is always a tradeoff between buying when others are panicking and waiting until things calm down. If we look for times when the spread exceeded 60% for at least a couple of days and then fell below 60% for a couple of sessions, the S&P 500 continued to rally with consistency in the months ahead, with no massive losses at any point in the next couple of months, but gains were also more subdued.
If bonds are ever going to rally, now would be a good time
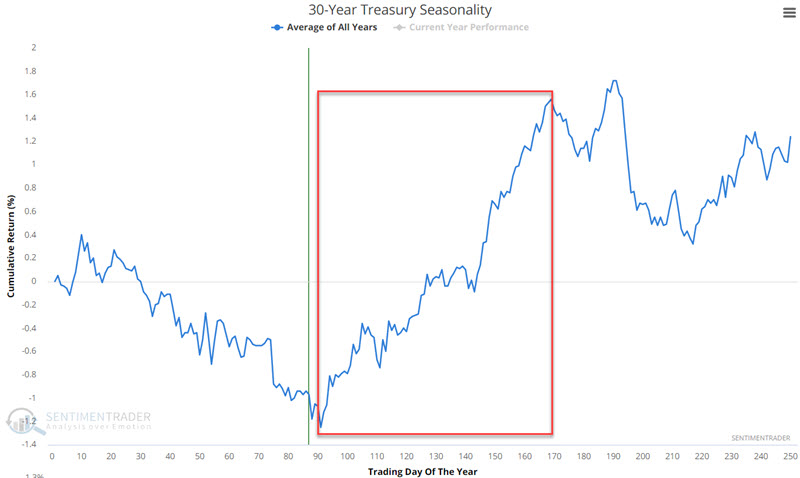
Since March 2020, bonds have been hit harder than anytime in the last 40 years. Now would be a reasonable time to expect the selling to alleviate, as Jay showed that the seasonal trends for long-term treasuries are about to enter a favorable period.
No seasonal trend is ever guaranteed to work out every time. That said, history is replete with situations where a deeply oversold (or overbought) market reversed following the start of a significant new seasonal trend.
The chart below displays the annual seasonal trend for the thirty-year Treasury bond futures.
Biotech's seasonal window is turning more positive, too
Jay showed that the biotech sector today looks a lot like the energy sector several years ago - unwanted, unloved and in the midst of a punishing decline with seemingly no clear end in sight.
The biotech sector is oversold enough that a sizeable rebound could unfold at any time. The annual seasonal trend for ticker IBB (iShares Biotechnology ETF) shows a favorable portion of the year begins at the close of Trading Day of Year (TDY) #87 and extends through TDY #179. For 2022, this period extends from the close on 5/6/2022 through 9/27/2022.
The chart below displays the hypothetical cumulative return from holding biotech funds only during the seasonally favorable period since 1986.
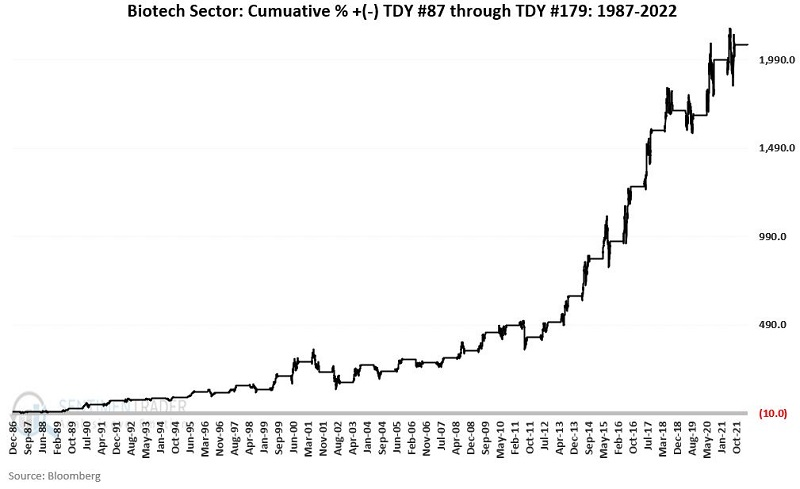
This window showed a positive return 26 times averaging +16.3%, while it lost ground 9 times averaging -8.0%.
About TradingEdge Weekly...
The goal of TradingEdge Weekly is to summarize the research published to SentimenTrader over the past week. Sometimes there is a lot to digest and this summary is meant to highlight the highest conviction or most compelling ideas we discussed. This is NOT the full research that's published, rather it pulls out some of the most relevant parts. It includes links to the published research for convenience; if you don't subscribe to those products it will present the options for access.