
TradingEdge Weekly for Mar 6 - Financial sector warnings, RGDI insights, Energy sector extremes, Treasury bonds outlook, Nikkei volatility

Key points:
- The S-TCTM Risk Warning Model Triggers a Risk-Off Signal
- Off the Beaten Path: The Gross Domestic income Edition
- The Crazy Energy Sector
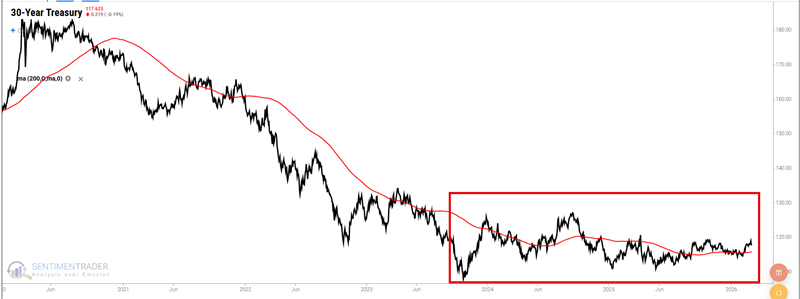
- Five Reasons Not to be a Long-Term Investor in T-Bonds
- The Nikkei 225 Hits the Brakes
House view:
- Stocks:
- Short-term: Bearish. U.S. equities are hit hard by a surge in Middle East geopolitical risk and a spike in oil prices. Both the VIX and CDX are in unfavorable positions. The S-TCTM risk warning model has triggered an alert. Weakness during the window period will overshadow the long-term upward trend. Market breadth is weak, and risk sentiment has shifted sharply toward risk-off. This time frame covers 1-4 weeks.
- Intermediate-term: No view. Market momentum continues to weaken, but has not yet reached the threshold for risk-off. The market remains caught in a tug-of-war between stagflation concerns (higher energy costs reviving inflation) and economic resilience. The S&P 500 still holds above its 200-day MA, which provides a strong long-term cushion, but upside is constrained by renewed rate fears and geopolitical uncertainty. Leadership is narrowing sharply into defensive and energy related equities. This time frame covers 1-5 months.
- Long-term: Bullish. The longer term uptrend remains intact as long as key support levels hold. U.S. economic resilience persists relative to global peers. Long-term breadth indicators across sectors and global markets show no significant downside, typically signaling positive returns for most stock indices over the next 6 to 12 months. This time frame covers 6-12 months.
- Energy and defensive sectors show strong momentum and above average win rates
- Tech remains resilient but selective, supported by solid earnings from key leaders
- Very long-term favors high cash flow, low multiple, and stable margin businesses
- Bonds: Long-term cycles remain bearish. The 10-year U.S. Treasury yield is rising despite equity weakness, as markets price in a second wave of inflation from surging oil. Investors are no longer buying bonds for safety but instead selling them on inflation fears, creating an unusual "stocks down, yields up" regime. Seasonal trends and structural headwinds continue to favor caution for long duration bonds.
- Commodities: A powerful geopolitical demand shock has erupted in energy, with crude exploding above $80. An effective commodity trend model is currently bullish for precious metals. Gold is caught in a tug-of-war between safe-haven demand and headwinds from higher yields and a stronger dollar, churning near $5,080 but holding critical support above $5,000.
- Crypto: We follow several simple systems for U.S.-traded bitcoin, which we consider the equivalent of the S&P 500 for crypto. Amid the market's paradigm shift to real assets and fiat credit doubts, crypto assets face valuation revaluation pressure from tech stock sell-off contagion, but long-term fundamental support from tokenization remains. Market volatility rises with the overall financial market, and short-term price performance is dominated by risk appetite shifts, with structural opportunities tied to institutional adoption and underlying technology innovation.
- Triple 40: Bearish
- RSI Momentum: Bearish
- Trend and Relative Trend: Bearish
- PMI: Bullish
- M2 ROC: Bullish
- Notable Moves in Global Markets:
- Japan: Amidst a global stock market slump and heightened risk aversion, Japan's stock market staged a rebound from oversold conditions. The Nikkei 225 index edged up 0.62% to close at 55,620.84 points, demonstrating relative resilience compared to other global markets.
- Hong Kong: Hang Seng edges higher, supported by a strong earnings reaction in JD.com, which lifts broader tech and logistics sentiment. The market withstands external geopolitical pressure on earnings resilience and structural support.
- Europe: STOXX 600 falls as the region faces dual pressure from energy supply risks and resurgent inflation fears. High energy sensitivity overriding any near-term stabilization hopes.
Where we're at
Most investors have the most riding on equities. We feel that the most significant determinants of success for investors are whether to adjust their allocation to that asset class based on factors that have historically had a good record of preceding above- or below-random returns in the months ahead.
Those factors include the probability of a looming recession, sentiment, price action, volatility, breadth, and the bond market. The chart below summarizes the main indicators and composite models we watch for those factors, and they're mostly in bullish regimes. Valuations are not part of these factors since the relationship has been too inconsistent on time frames under one year.
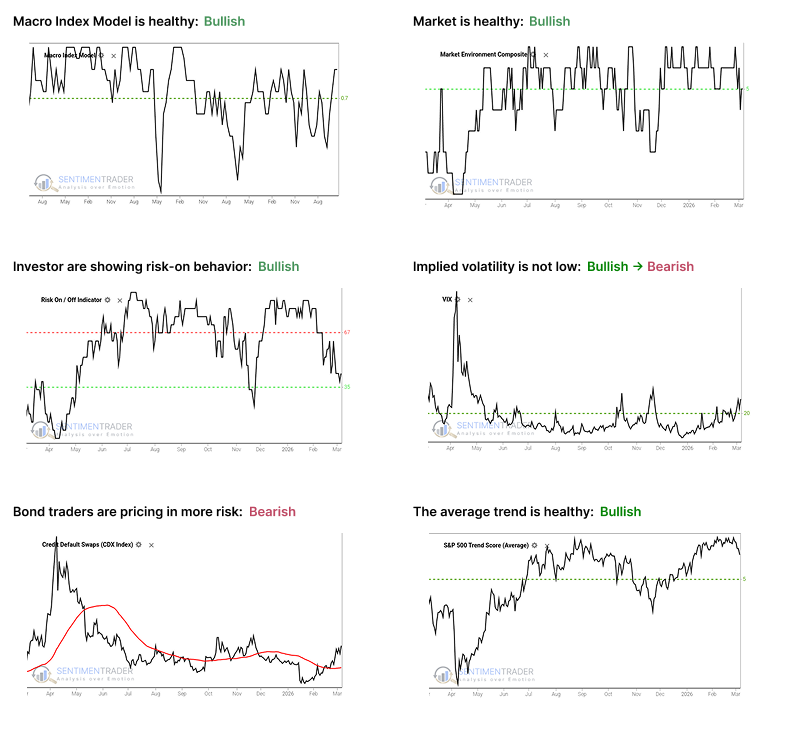
- The Macro Index Model is above the 50% threshold, which has been a vital level as outlined here.
- The Market Environment has been skittish, but is currently healthy. Future returns, especially for higher-beta indices, has been markedly better, with less risk, when the environment is healthy as outlined here.
- The Risk On / Off Indicator shows that investors are still in risk-on mode. This has been a good sign for future returns as outlined here.
- Implied volatility is at or above 20, signaling a volatile environment. The S&P 500 has historically performed poorly when this is the case, as outlined here.
- Credit default swap spreads are above their 50-day moving average, which is modestly concerning as outlined here.
- A composite of trend measures in SPY and the average S&P 500 stock remain above 5, which show healthy trend conditions.
The S-TCTM Risk Warning Model Triggers a Risk-Off Signal
A specific component of the S-TCTM Risk Warning Model has triggered an alert due to an unusual concentration of new lows occurring within the Financial sector.
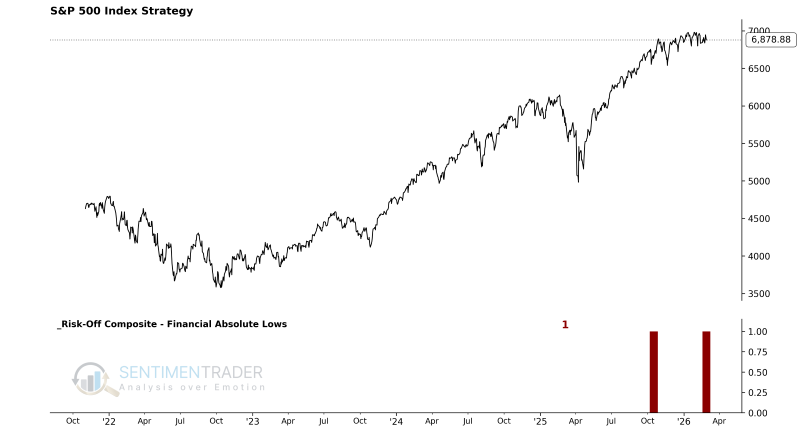
Monitoring the Percentage of Financial Sector Member Lows Risk-Off Model reveals that the percentage of 63-day lows in the S&P 500 Financial sector relative to the total 63-day lows in the broader S&P 500 has exceeded 38%.
The S-TCTM Risk-Warning Model has officially triggered a risk-off signal (March 3, 2026).
Off the Beaten Path: The Gross Domestic income Edition
Real Gross Domestic Income (RGDI) is a broad measure of economic activity. The 12-month change in RGDI can be used in several different ways to identify potentially favorable periods for stocks.
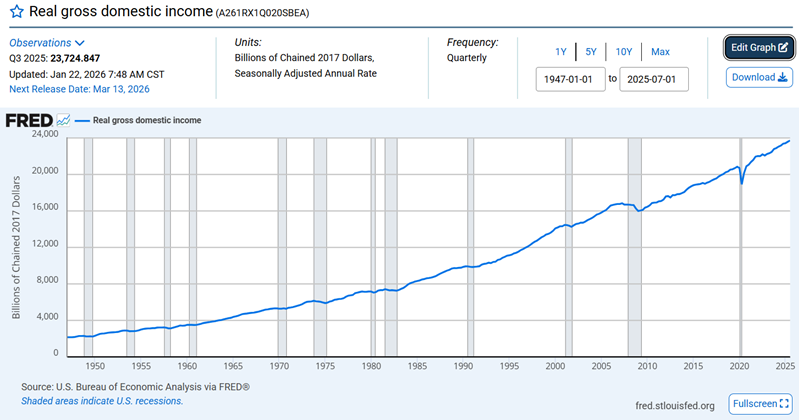
For testing purposes, we evaluate data at the end of the quarter, when the data is reported. For example, Q4 2025 data will be reported on March 13th, 2026.
The Crazy Energy Sector
The breadth indicators of the energy sector show that the percentage of its constituent stocks above their short-, medium-, and long-term moving averages simultaneously hit 100%.
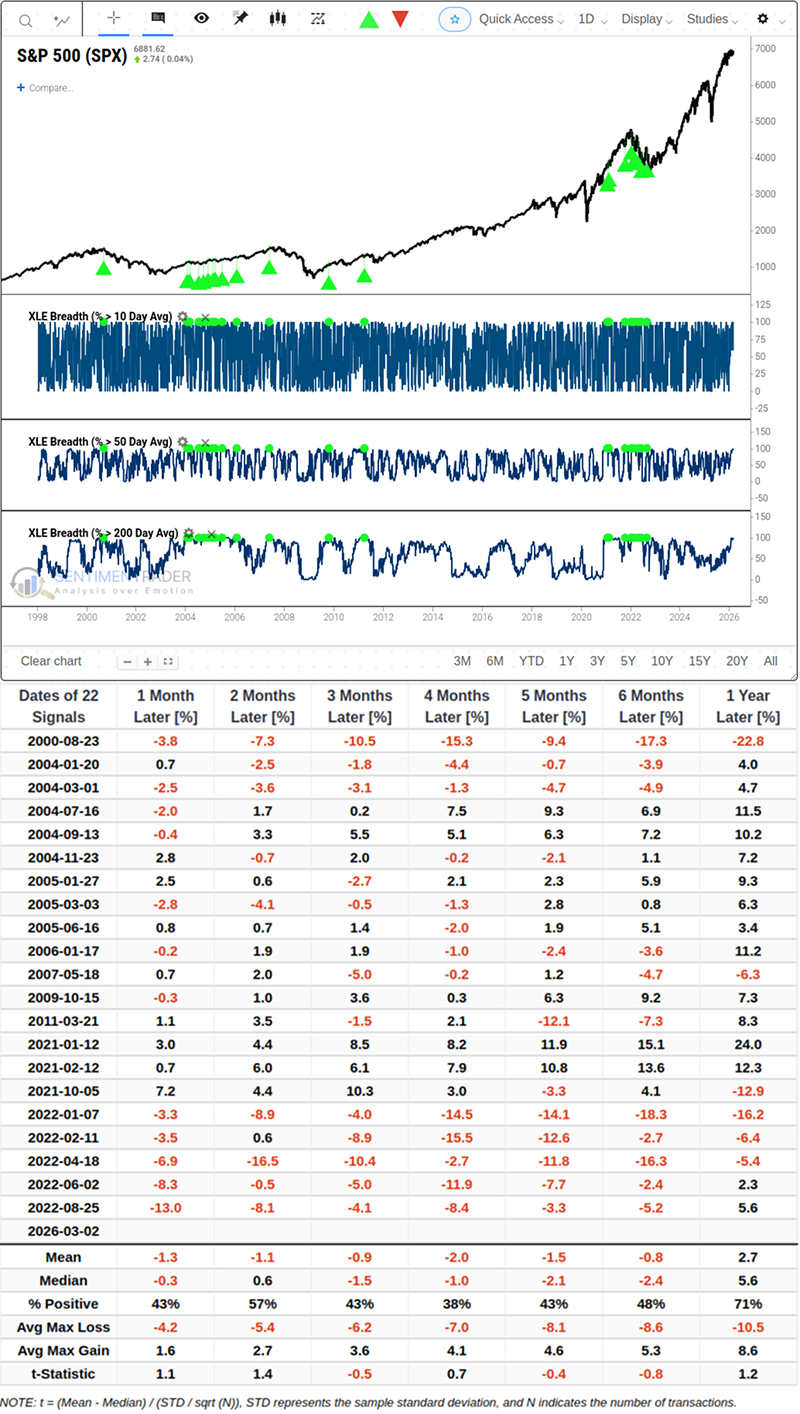
Historical data tend to show that broad market indices usually face headwinds during this period.
Five Reasons Not to be a Long-Term Investor in T-Bonds
The treasury bond market has been beaten down for several years, and the price pattern has been coiling.
The Copper/Gold Ratio, which measures the relative performance of the leading industrial metal versus the leading precious metal, has a surprisingly wide influence across many markets, including bonds.
The Nikkei 225 Hits the Brakes
The Nikkei 225 Index plummeted by more than -7.5% in the short term after hitting a new all-time high.
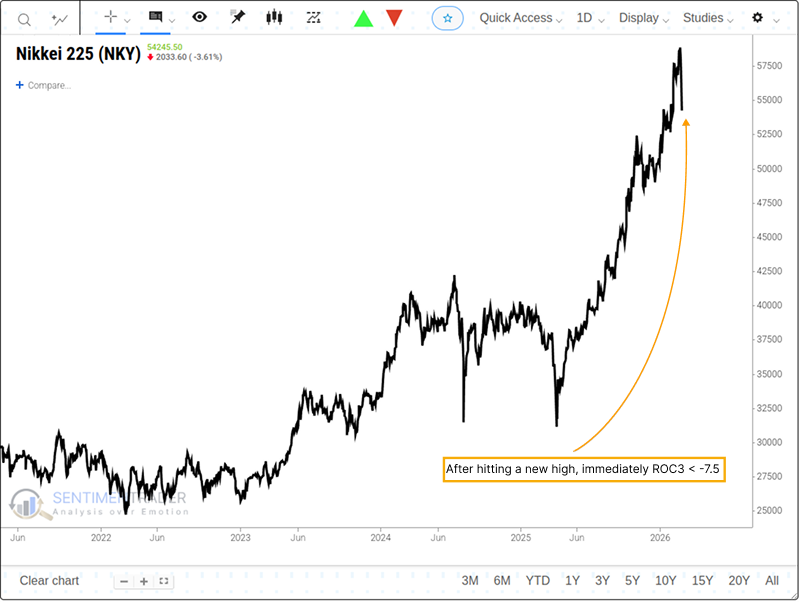
In such extreme cases, the market posted an average return of -0.7% one month later, with only a 25% probability of positive performance.
About TradingEdge Weekly...
The goal of TradingEdge Weekly is to summarize some of the research published to SentimenTrader over the past week. Sometimes there is a lot to digest, and this summary highlights the highest conviction or most compelling ideas we discussed. This is NOT the published research; rather, it pulls out some of the most relevant parts. It includes links to the published research for convenience, and if you don't subscribe to those products, it will present the options for access.