
TradingEdge Weekly for Mar 28 - A remarkable hundred days, persistent momentum, outperforming industrials

Key points:
- A remarkable hundred days
- Five straight months of gains
- Persistent momentum - RSI has held above 50 for more than 80 days
- Breakouts are spreading across global indexes
- Is it finally time for the average stock?
- A two-factor economic model for stocks
- The average industrial stock has been outperforming
- Signs are pointing to a breakout in financials
A remarkable hundred days
It's now been 100 days since the bottom in the world's most benchmarked equity index. And oh, what a hundred days it's been.
Cycling from a rolling 100-day rate of change of less than -15% to greater than +25% has occurred only at some of the most significant inflection points in the past 60+ years. None of the signals suffered anything larger than a -3.5% drawdown within the following year.
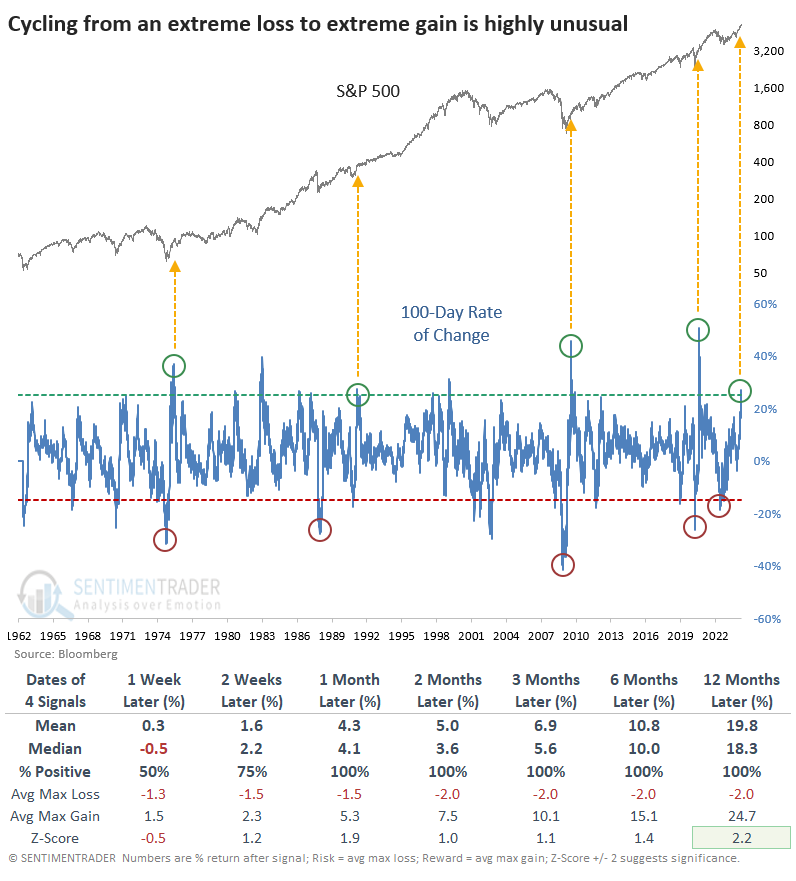
After a modest scare in January, what's also been impressive about the rally is how broad it's been. Since the October low, there have been 11 days when more than 80% of volume on the NYSE flowed into advancing issues.
The table below shows every time the S&P rallied at least 20% from a 100-day low and had at least 10 days with at least 80% Up Volume on the NYSE. There isn't much to nitpick about these returns, as they were exceptional. The only one that preceded major trouble was in 1987, but that took more than six months to develop.
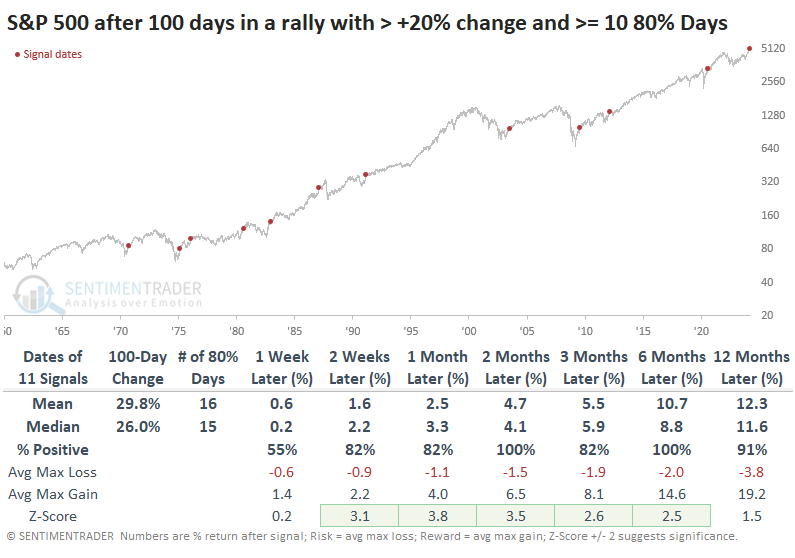
The table of maximum losses and gains across time frames shows that from one through six months later, anything more than even a -3% pullback was rare, while gains were impressive.
Five straight months of gains
The hundred-day rally means the S&P 500 is poised to close the month of March with a higher close for the fifth consecutive month. Jay noted that this has been a favorable momentum signal for the broader stock market.
The trading rules are simple:
- If the S&P 500 closes higher for five straight months, we buy and hold the index for nine months
- If a new signal occurs within the initial nine months, we extend the holding period another nine months (if the S&P 500 closes higher, for example, eight months in a row, each new higher close after the initial five-month signal constitutes a new signal).
The chart below displays the hypothetical equity curve (using month-end closing prices) for the "strategy" (such as it is) above.
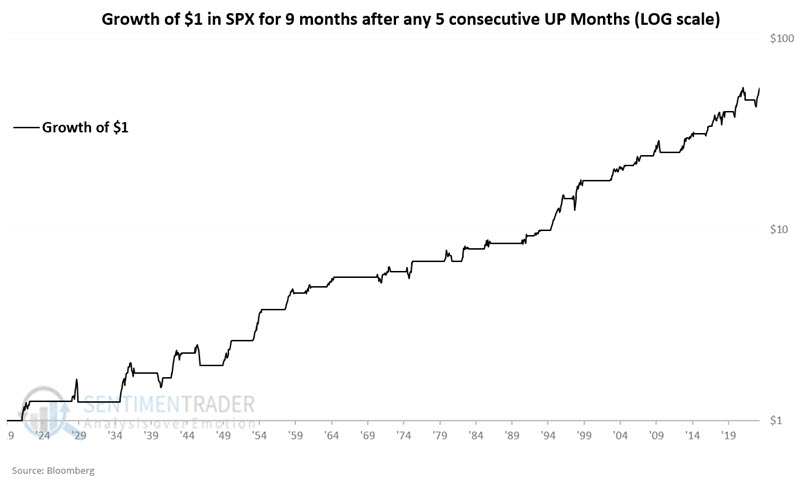
Key things to note include an 89.7% Win Rate and the fact that the method has not shown a loss since 1946.
Persistent momentum
The S&P 500's Relative Strength Index has closed above a value of 50 for 98 straight trading sessions. Dean noted that similar price momentum preceded a 100% win rate over the following two, three, six, and twelve months.
The Relative Strength Index (RSI), created by J. Welles Wilder, is a popular technical indicator that measures price momentum. After shifting above 50 last fall, the S&P 500's Relative Strength Index (RSI) has maintained a reading above that level for 98 consecutive trading sessions, the sixth-longest streak in history.
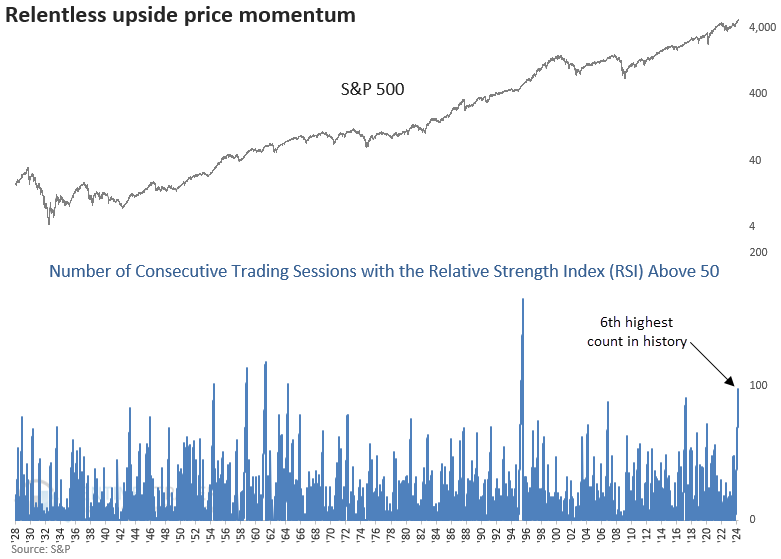
Once the RSI indicator persists above 50 for 80 consecutive trading sessions, the outlook for the world's most benchmarked index was nothing short of spectacular, maintaining an undefeated record over the following two, three, six, and twelve months.
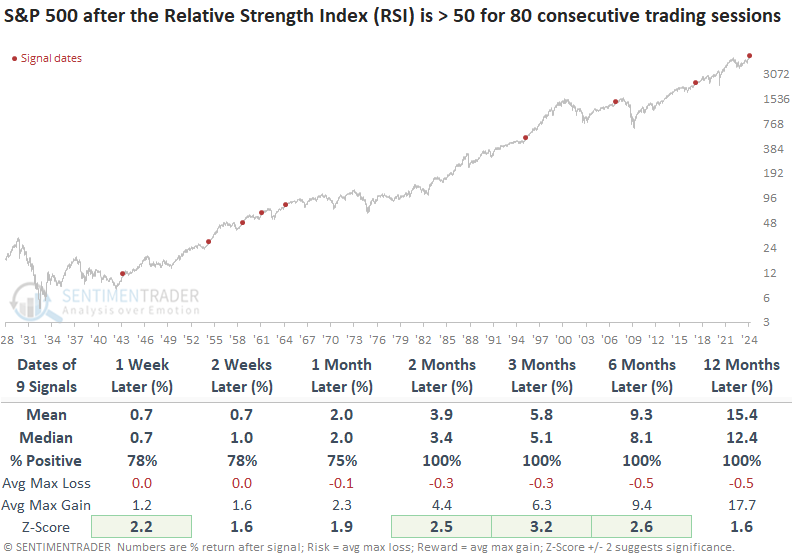
Over the next twelve months, the S&P 500 defied expectations by avoiding a maximum loss exceeding -5%.
Among sectors, financials have registered the 6th highest count in history, reaching the most significant level since 1971.
The breakouts are spreading across countries
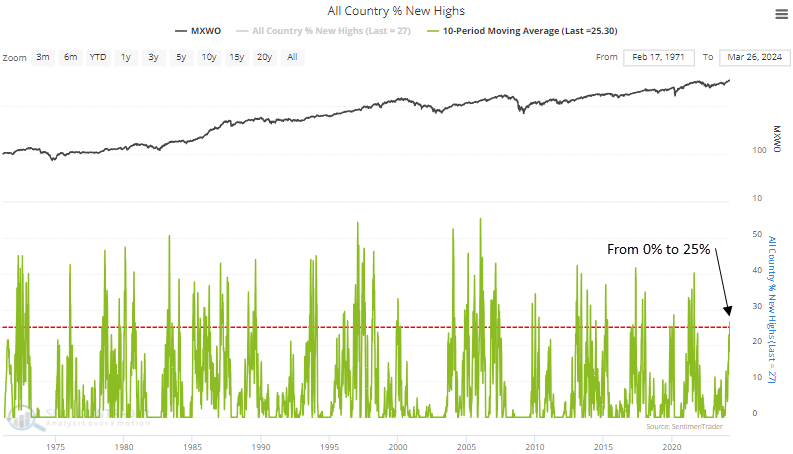
Dean also showed a composite that measures 52-week highs for global indexes that highlights an expansion in breakouts.
Although global indexes have been trending higher, there had been a noticeable absence in 52-week highs until now. The 10-day moving average of global indexes closing at a 52-week high cycled from 0% to greater than 25%, indicating that more and more international markets are breaking out.
Whenever the 10-day moving average of global indexes closing at a 52-week high cycled from 0% to greater than 25%, the MSCI World Index exhibited outstanding returns and win rates, with several horizons showing significance relative to any random time. The three-month horizon was particularly robust, showing a 92% win rate and 21 straight gains between 1980 and 2009.
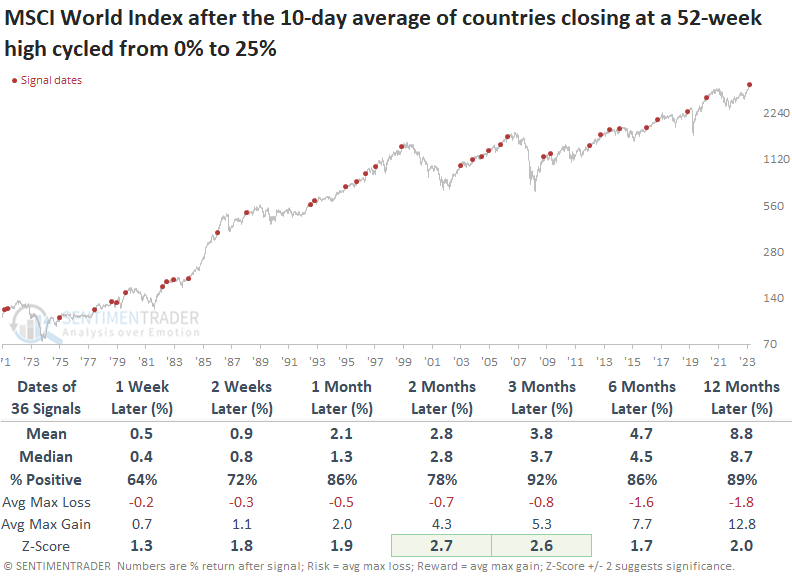
The S&P 500 responded exceptionally well to global breakouts, exhibiting outstanding performance and win rates. From a relative perspective, the world benchmark consistently underperformed the S&P 500, which is unsurprising given that the world's most benchmarked index has been heavily influenced by growth stocks for most of the last three decades.
Finally time for the average stock?
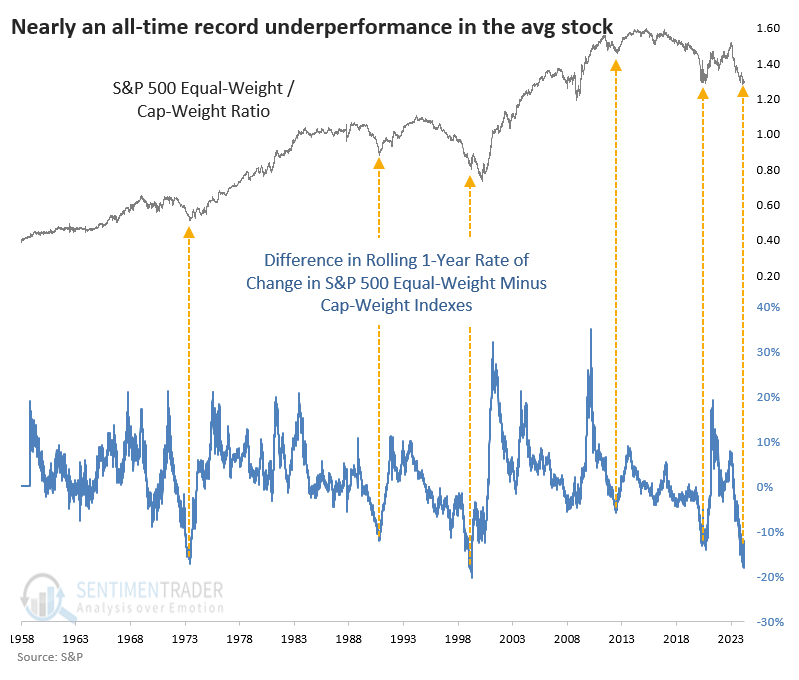
The relationship between the S&P 500 equal-weight and capitalization-weight indexes has gotten significantly stretched, historically so.
The equal-weight S&P's rolling one-year return is just over +20%, while the cap-weight version is more than +32%. It was even more stretched a few weeks ago. The spread in rolling one-year returns between the two versions has only got that stretched one other time - in the spring of 1999, as the internet bubble inflated some high-flying tech stocks. The concern this time is that .ai is the new .com.
We must have some reasonable rule to use in real-time to believe that something has changed. In this case, we'll require that the spread between the two versions' rolling one-year returns has to go at least 15 days since hitting a ten-year low and revert by at least 5%.
The table below shows how the ratio between the equal-weight (EW) and capitalization-weight (CW) versions of the S&P 500 index performed after similar reversals from an extreme in rolling one-year returns. We can see that the equal-weight index outperformed the cap-weight version during the next two years after each signal.
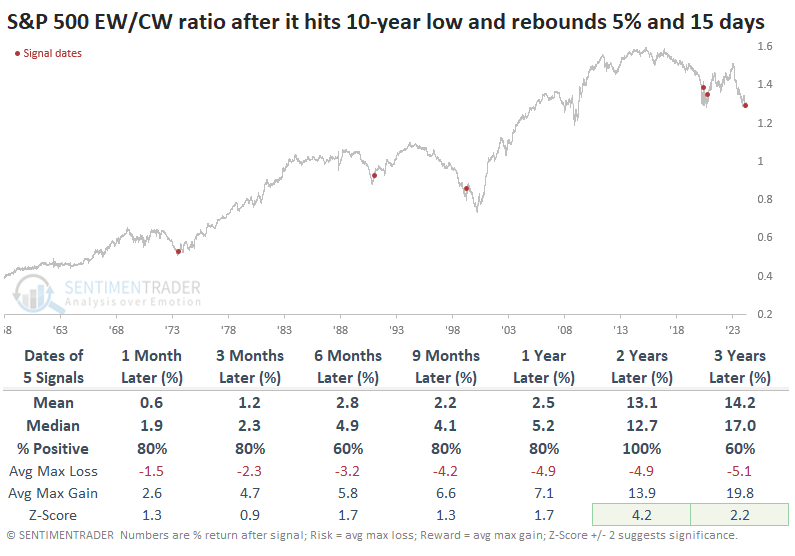
The equal-weight version of the index suffered more than the cap-weight index initially ahead of the popping of the internet bubble, but it lost less in the long term. It also suffered significantly less during the 1974 bear market.
A two-factor economic model for stocks
Any single economic indicator has only a certain amount of utility as it relates to the stock market. Jay suggested the real value is in combining economic indicators that measure different aspects of the economy to get a broader picture.
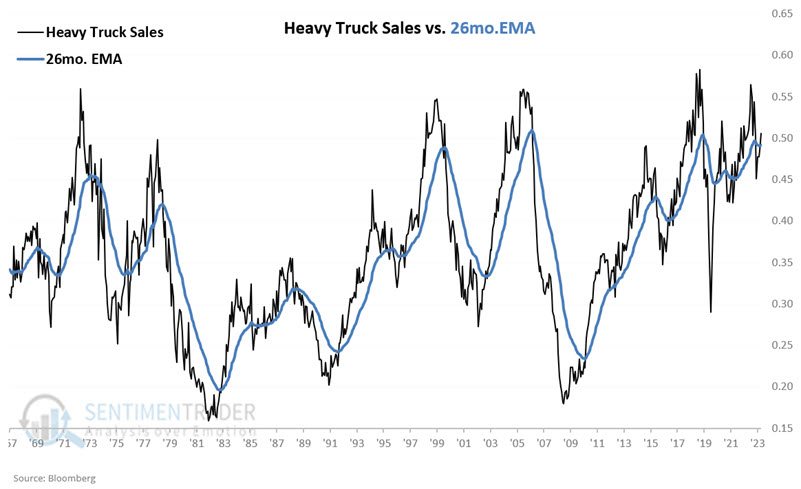
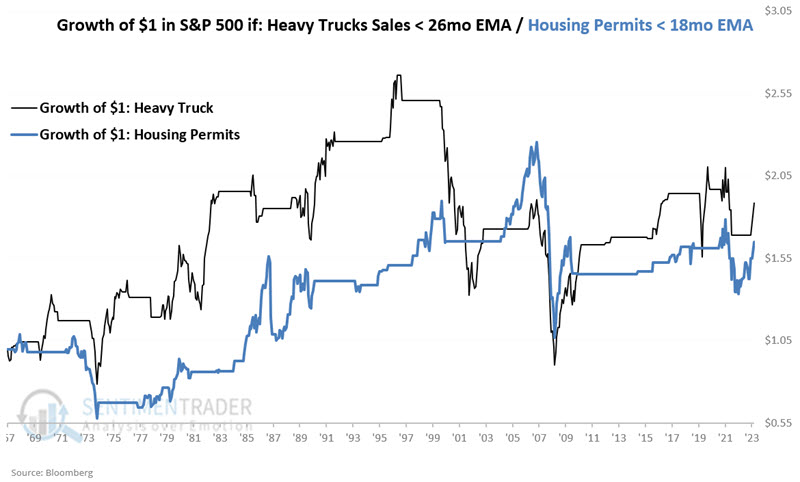
The USA Heavy Truck Index tracks the number of heavy trucks newly registered with agencies in the United States. To measure the trend, we compare the latest monthly reading for the index to its 26-month exponential moving average, as shown in the chart below.
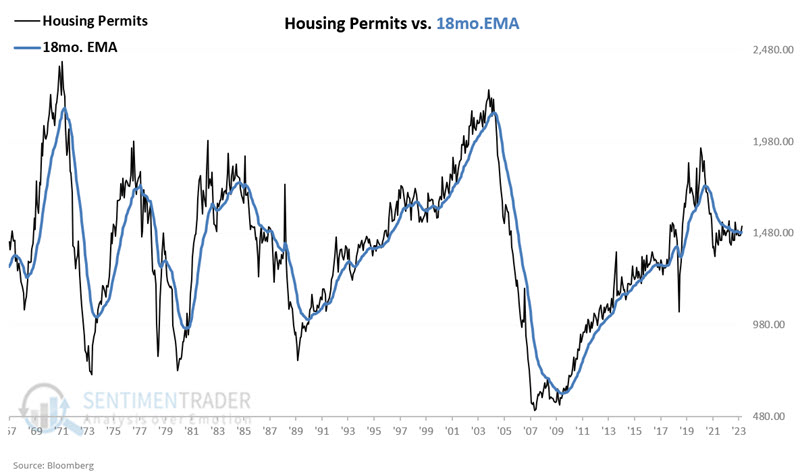
The chart below displays the number of housing permits issued in the most recently reported month and an 18-month exponential moving average. Here, too, the implication is that a rising trend is favorable for the economy - and, by extension, the stock market.
The chart below displays the growth of $1 invested in the S&P 500 when the indicators above are favorable. The black line shows the growth of $1 when the Heavy Truck Index closed the previous month above its 26-month EMA, and the blue line displays the growth of $1 when Housing Permits ended the previous month above its 18-month EMA.
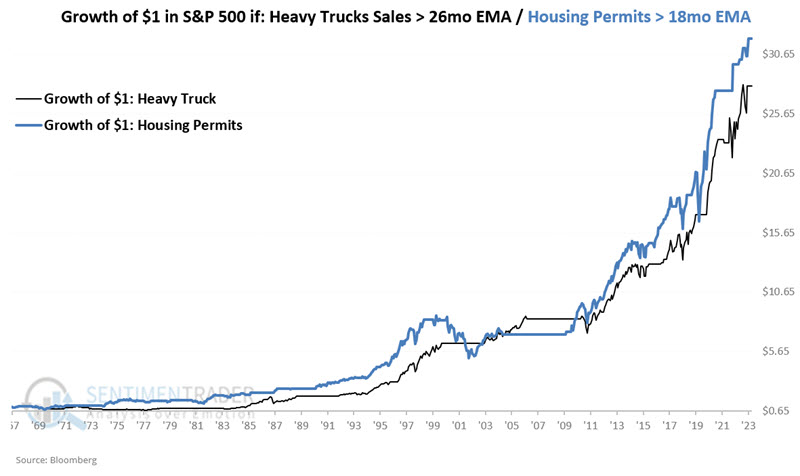
On the flip side, the chart below displays the growth of $1 invested in the S&P 500 when the indicators above are unfavorable. The black line shows the growth of $1 when the Heavy Truck Index closed the previous month below its 26-month EMA, and the blue line displays the growth of $1 when Housing Permits ended the previous month below its 18-month EMA.
Jay then created a simple model combining both indicators to determine whether to hold the S&P 500 over the next month. The latest monthly readings for both indicators have popped back above their respective exponential moving averages. This means that as of the end of March, this model will be rated as favorable for the month of April.
The average industrial stock is outperforming
A model that compares the equal-weighted S&P 500 Industrials sector to the S&P 500 triggered a buy signal. Dean showed that similar relative trend signals from the cyclical sector produced bullish outcomes for the broad market.
Amidst last week's surge in new highs, a relative price trend model that compares the equal-weighted S&P 500 Industrials sector to the S&P 500 triggered a new buy signal, indicating outperformance from the average Industrial sector stock. The equal-weighted Industrials group has historically provided an outstanding broad market message, exceeding performance trends for all other equal-weighted sectors.
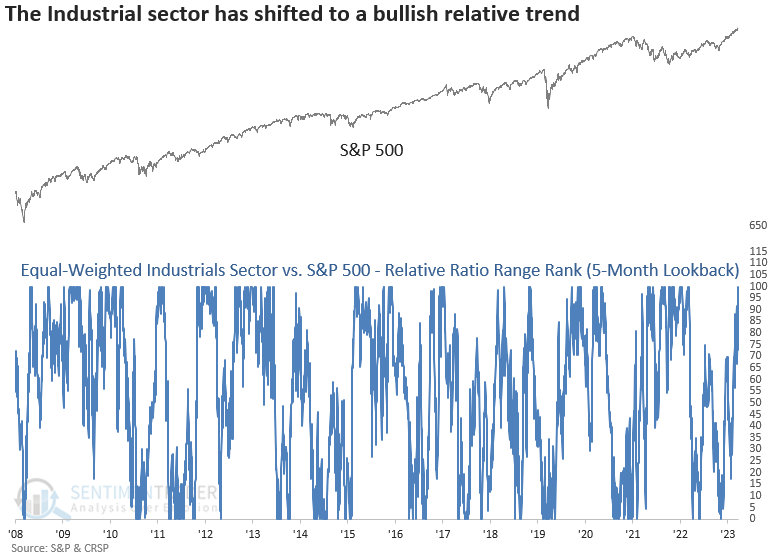
When the relative ratio between the equal-weighted S&P 500 Industrials sector and the S&P 500 shifted from the bottom of its 5-month range to the 98th percentile, returns and win rates for the S&P 500 were excellent.
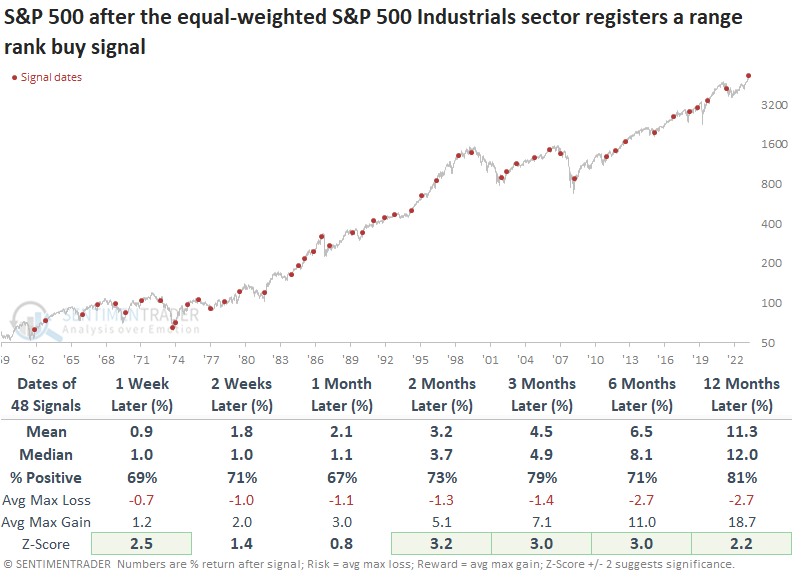
In general, cyclical sectors performed better than defensive groups, and equal-weighted indexes yielded better returns than cap-weighted ones, a trend often observed during stock market recoveries.
This and many other relative ratio models are now tracked on the website's Strategies page.
Decision time for financials
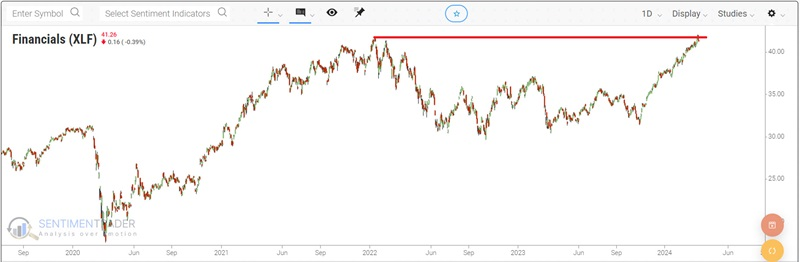
The Financials sector rallied strongly off its October 23 low. Jay noted that a variety of factors and indicators strongly suggest that the sector will ultimately break out to the upside.
The chart below displays a bar chart for the Financials Select Sector SPDR Fund (ticker XLF) over the last four-plus years. Following a non-stop rally since October 2023, XLF finally pierced its all-time high from January 2021 - only to be turned back.
The chart below shows that XLF has entered a typically favorable seasonal period that extends from the close on Trading Day of the Year (TDY) #56 through TDY #88. For 2024, this period began on 2024-03-21 and extends through 2024-05-07.
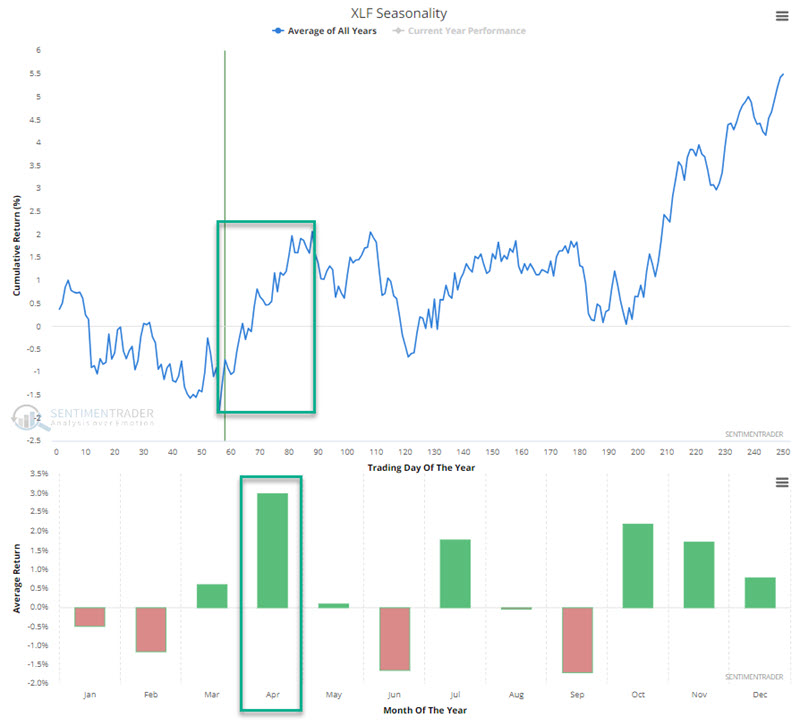
We can also see in the chart above that April has historically been the best month for financial stocks. For testing purposes, we will use the S&P 500 Financial Index (which XLF attempts to emulate) starting in 1953. The chart below displays the hypothetical growth of $1 invested in the financials sector from TDY #56 through TDY #88 every year starting in 1953.
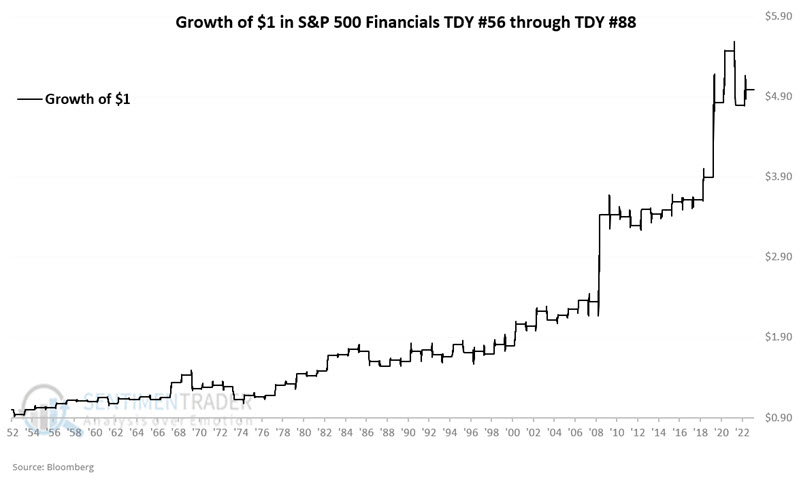
The key things to note in the information above are a) the clear long-term tendency for good performance but also b) the absolute lack of any guarantee on a year-to-year basis (61% Win Rate means roughly 2 out of every five years sees financials decline during this period).
The XLF % RSI 14-Day > 70 indicator measures the percentage of XLF constituent stocks showing a 14-day RSI value of 70% or more. The chart below displays those dates when the XLF % RSI 14-Day > 70 indicator crossed above 56% for the first time in six months.
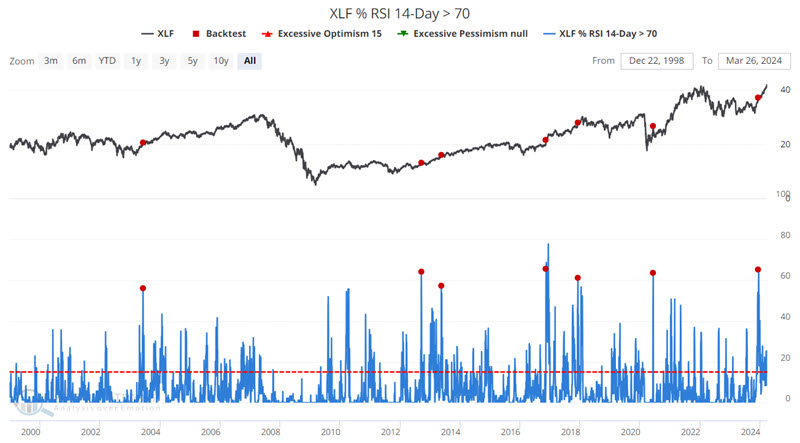
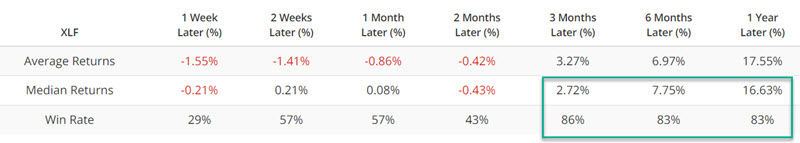
While the last signal occurred over three months ago on 2023-12-13, the critical thing to note is the favorable Win Rates for 3 to 12 months, and that following 5 of the previous six signals, XLF stood higher after 12 months than it did after three months. This, too, lends weight to the "buy the breakout if it happens" idea.
Jay also looked at the percentage of financials holding above their 50-day averages and insider activity, both of which supported higher prices going forward.
About TradingEdge Weekly...
The goal of TradingEdge Weekly is to summarize some of the research published to SentimenTrader over the past week. Sometimes there is a lot to digest, and this summary highlights the highest conviction or most compelling ideas we discussed. This is NOT the published research; rather, it pulls out some of the most relevant parts. It includes links to the published research for convenience, and if you don't subscribe to those products, it will present the options for access.