
TradingEdge Weekly for Mar 24 - Sentiment cycles, banking buyers, Treasury yield trends

Key points:
- Sentiment has cycled back to pessimism after a bout of extreme optimism
- Long-term, price action suggests investors are in the Returning Confidence phase of the sentiment cycle
- If seasonality is going to be any guide, now is the time to rally for the major indexes
- There has been a drastic focus on the biggest stocks, causing a relative decline in equal-weight indexes
- That decline is due in large part to Small-Cap stocks, which have struggled relative to Large-Caps
- Despite banking concerns, corporate insiders in Financials have been buying
- A plunge in real estate stocks has triggered a potential options trade
- There has been a breadth thrust in corporate bonds
- The percentage of Treasury yields in uptrends quickly cycled from 100% to 0%
- An obscure model using seasonality and a ratio of metals prices suggest a headwind for bond prices
Sentiment cycles to another extreme
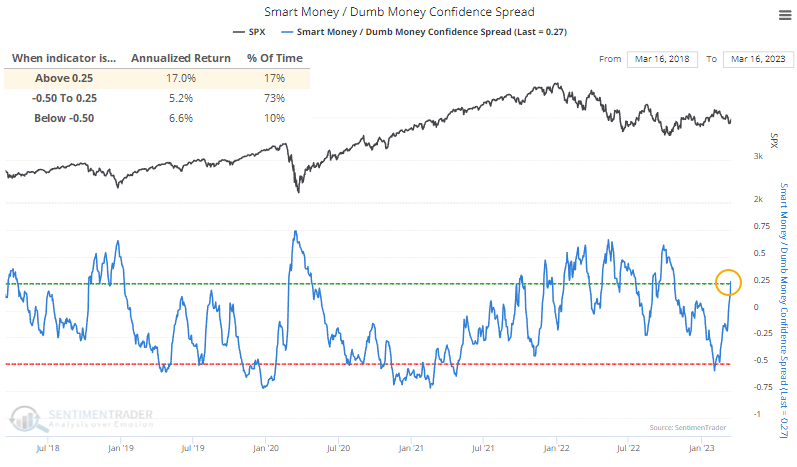
Investors have responded quickly to troubles over the past month, with the spread between Smart and Dumb Money Confidence already moving to an extreme, propelled by raging fears of a banking crisis and implications for further credit tightening.
When the spread has been this wide, the S&P 500's annualized return is an impressive +17.0%, though that masks some extreme interim losses.
After other times when the spread cycled from high optimism territory beyond -0.5 to pessimistic territory above +0.25, short-term returns were inconsistent. Over the next three months, however, the S&P rallied after 14 of 17 signals. There were some notable losses in 2002, 2008, and 2011, and the signal from 2020 triggered in the midst of the pandemic meltdown before rebounding strongly.
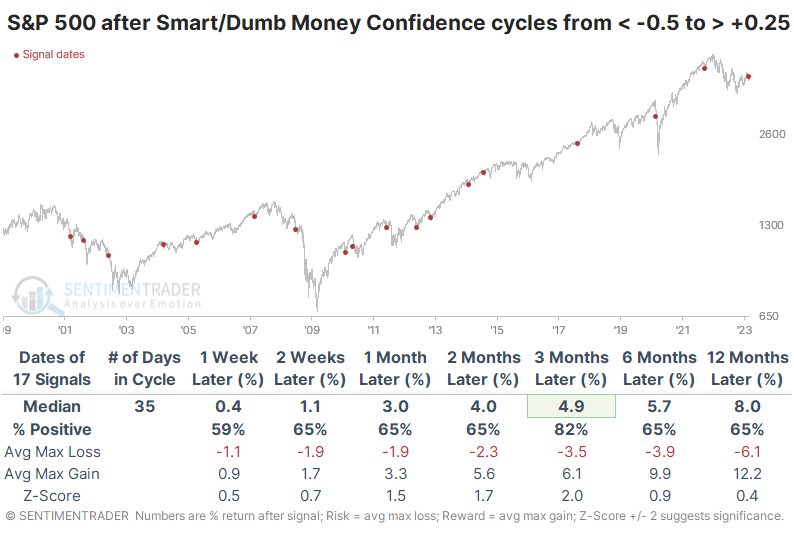
What makes this signal a bit unique is just how fast it unfolded. Sentiment cycled from one extreme to the other in fewer than 30 sessions, one of the fastest turnarounds since we began computing this model in 1999. The handful of other times when sentiment cycled so quickly, the S&P rallied each time over the next few months, though it ultimately failed in 2001, and it required sitting through a painful drawdown during the pandemic.
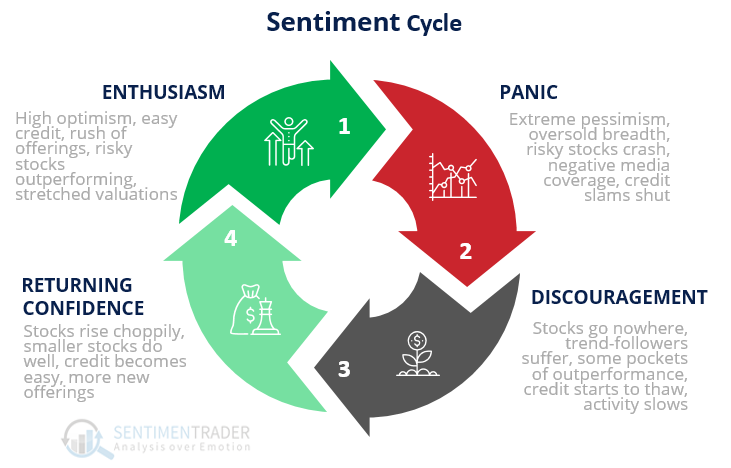
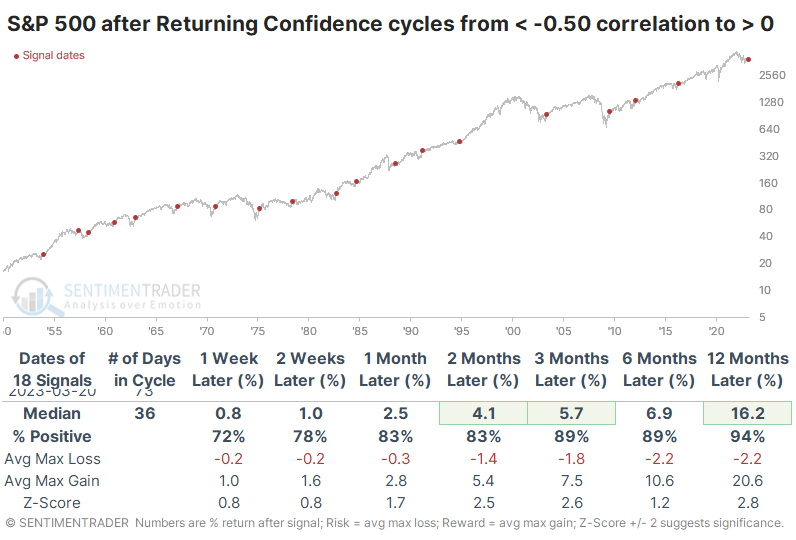
Long-term we appear to be in the Returning Confidence phase of a Typical Sentiment Cycle
Last October, we saw that according to the Typcial Sentiment Cycle, investors had been woefully discouraged for a historic length of time. Now it looks increasingly like we're in the Returning Confidence phase.
A popular heuristic uses some version of the Cycle popularized by Justin Mamis in his 1999 book, The Nature of Risk. The Mamis chart encompasses the price path of U.S. stocks from roughly May 1990 through March 1991. There are essentially four major parts to the Cycle:
Despite all the challenges over the past month, price action is starting to align with Returning Confidence more closely. After the correlation dived to one of the lowest levels in decades, it has since recovered to zero. Qualitatively, smaller stocks are not doing well, and credit is not becoming easy, so those are signs of the cycle that we're not seeing right now.
But for these purposes, we're only looking at the S&P's price action and comparing it to the "ideal" price pattern from the Mamis example of the Typical Sentiment Cycle.
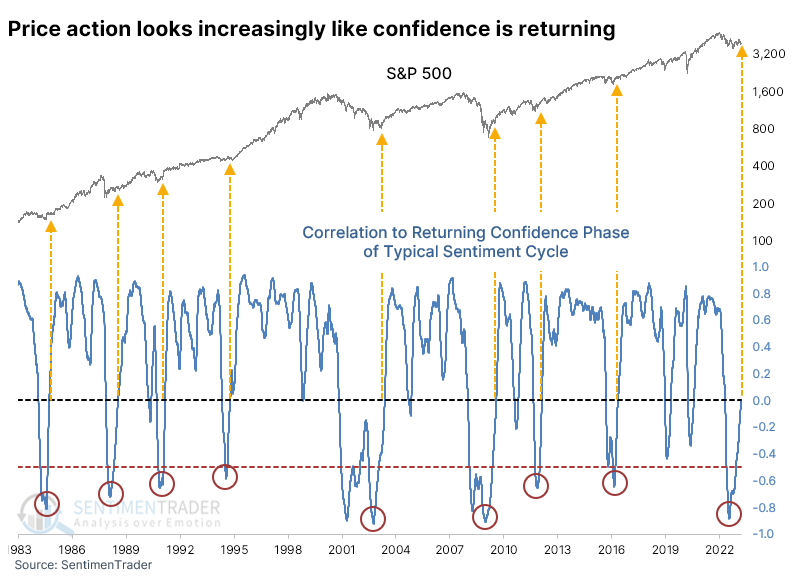
When the S&P's price action suffers a very negative correlation to Returning Confidence and then recovers to zero, its future returns were above average and showed a decent probability of being positive. Almost all the medium- to long-term losses were concentrated in the 1930s and 40s.
If we look at modern markets since 1950, there was essentially only a single failure. Other than the signal in 1957, there were two negligible losses three or six months later. All the other signals sported a positive return, with a shallow average risk versus potential reward.
Soon or near for seasonality
Jay noted that seasonality suggests it may be "soon or never" for the major stock market indexes. The market tends to enjoy something of a "Spring Fling" from the late March to early-June period.
Three major U.S. indexes - the S&P 500, the Nasdaq 100, and the Russell 2000 - are soon entering a seasonal period that tends to show market strength.
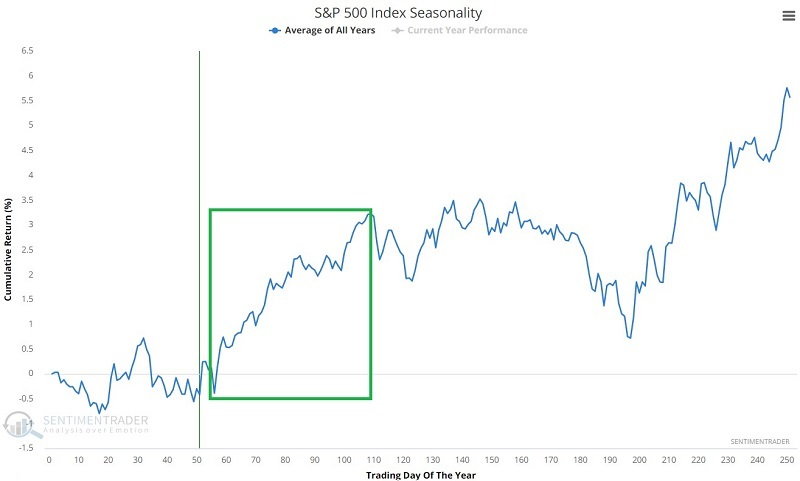
While the Nasdaq 100 has slightly different trough and peak dates, for the test below, for all three indexes, we will focus on the period extending from the close on Trading Day of the Year (TDY) #56 through TDY #109. For 2023, this period extends from the close on 2023-03-23 through 2023-06-08.
The chart below displays the growth of $1 invested in each of the three indexes only during these windows since 1985. The top performer during this period has been the Russell 2000, but there was much variation over the years.
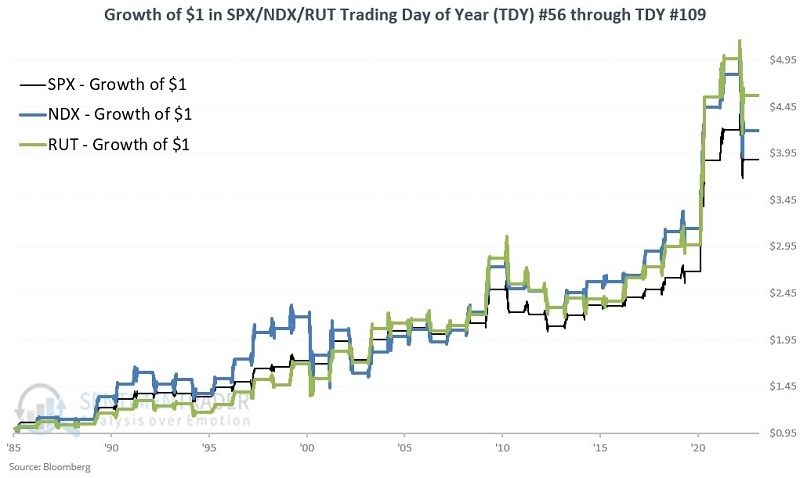
All three indexes rose during at least 65% of the years during these windows, with average gains of 4% or more, and much larger maximum gains than losses.
In addition, 2023 is a pre-election year in the four-year presidential cycle. The chart below displays the growth of $1 invested in each index during the seasonal windows in pre-election years.
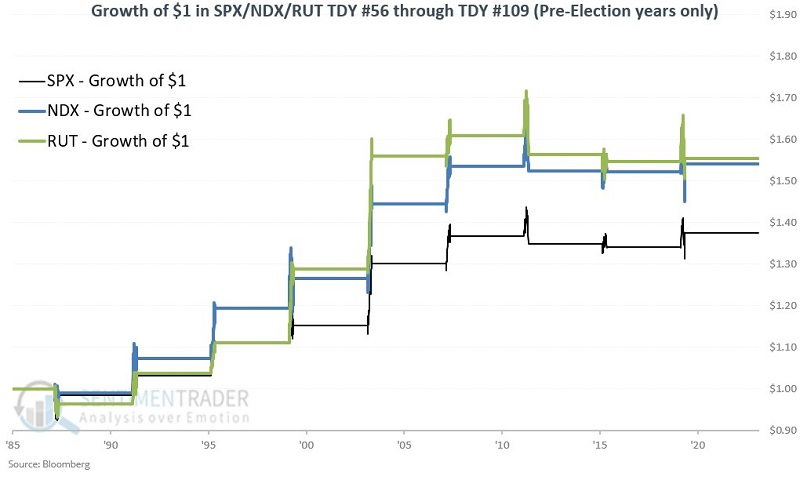
All three indexes rose during six of the nine cycles, but the median gains were larger, and there was even more of a spread between the largest gains and losses. The biggest loss for the Nasdaq 100, for example, was only -1.0%.
Investors have been flocking to some of the biggest stocks
Dean showed that a relative ratio system for the equal vs. cap-weighted S&P 500 has rotated to the cap-weighted S&P 500. After similar signals, the cap and equal-weighted S&P 500 index struggled over the next month, and defensive sectors tended to outperform.
In times of uncertainty, equity investors play it safe by allocating money to the relative safety of the cap-weighted S&P 500, as its index-weighting methodology tends to favor large companies with higher-quality balance sheets. A trading system that applies a 26-week range rank to the relative ratio between the equal and cap-weighted S&P 500 index triggered a rotation signal in favor of the cap-weighted S&P 500 index.
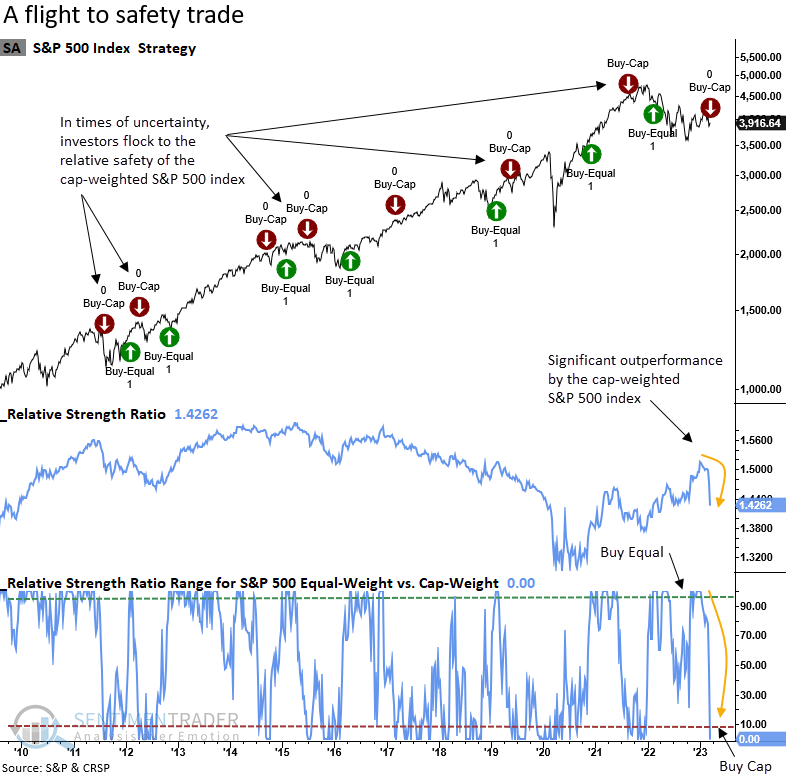
When the relative ratio between the equal and cap-weighted S&P 500 rotates in favor of holding the cap-weighted index, the S&P 500 index tends to struggle over the next month. Since 2007, signals have shown a loss in every single case at some point over that time frame. Except for a few bear market instances, the long-term results look solid.
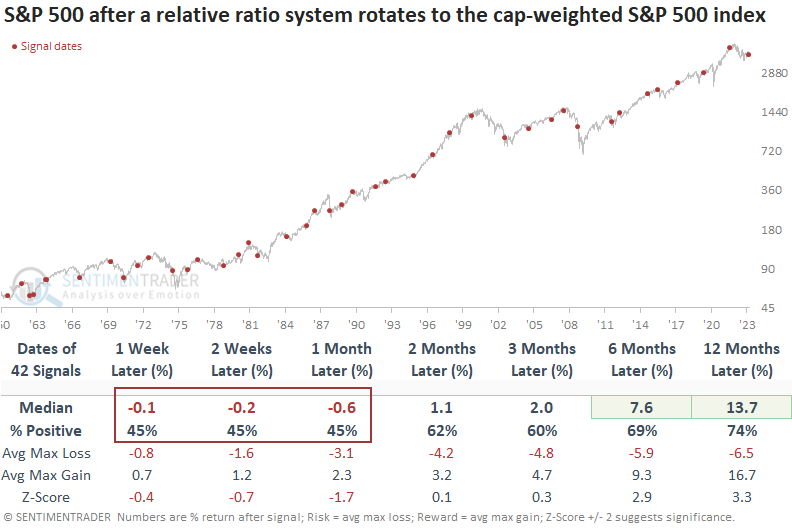
The S&P 500 equal-weighted index shows slightly weaker results than the cap-weighted version over the next few months. From a long-term perspective, one would be better off holding the equal-weighted index based on the return and win rate profiles.
Smaller stocks have been a drag
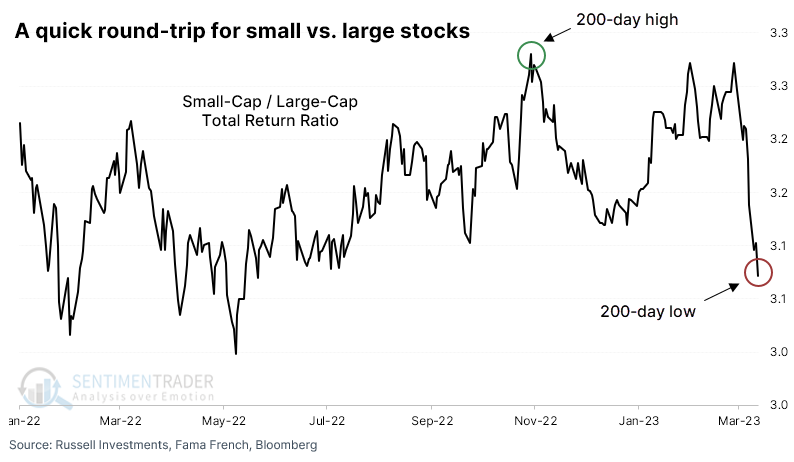
Small-caps have been hammered in recent weeks, thanks partly to struggling Financial stocks. Investors have gathered in some of the largest-cap stocks as a sort of haven, sending the ratio between the two factors on a while ride.
The ratio had nearly exceeded its 200-day high just a few short weeks ago, and now it's mired at the lowest level in more than 200 days.
Analysts tend to read a lot into this ratio, assuming that if small stocks struggle against their bigger brethren, it bodes ill for the economy and, thus, the stock market. There is some evidence that it at least tends to precede more weakness for smaller stocks versus larger ones. After other times the ratio cycled from a 200-day high to a 200-day low, small stocks underperformed most of the time over the next couple of months.
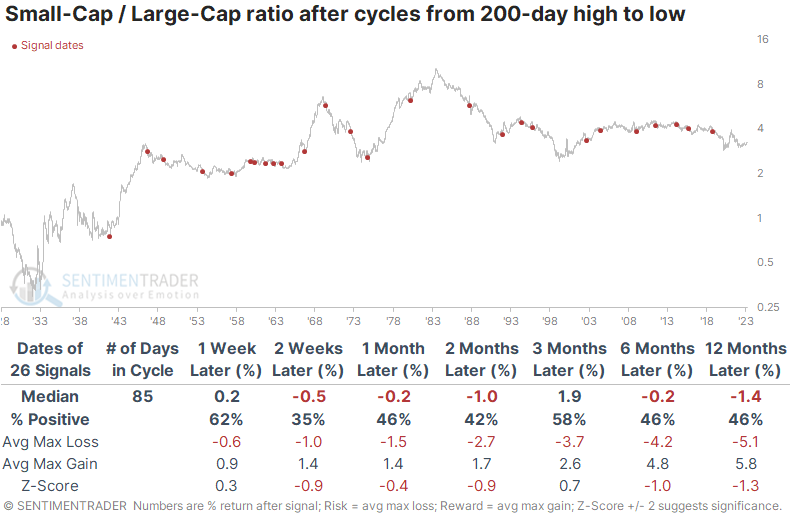
As an indicator for the S&P 500, the most benchmarked index in the world, it wasn't a very accurate warning. The S&P rose more than 60% of the time across all time frames. Its average return was only modestly above random, and the risk versus reward was nothing special.
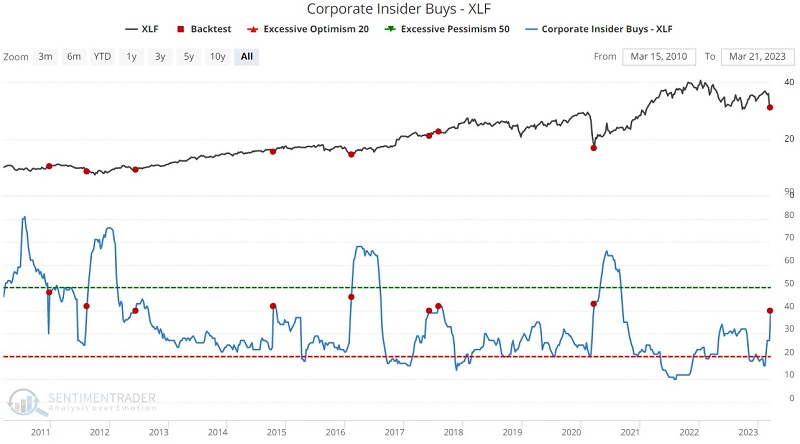
Despite banking concerns, insiders have been buying
Talk of a "banking/financial crisis" has dominated the business news in recent weeks. Even so, Jay noted that financial corporate insiders have been voting with their wallets.
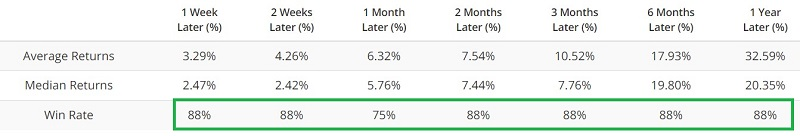
The chart below displays Corporate Insider Buys among component companies of the Financial Select Sector SPDR Fund ETF (XLF) and denotes those times when the indicator crossed above 39.9. Note the sharp uptick in buying over the past two weeks. Under similar buying conditions, XLF rallied 88% of the time between 2-12 months later and outperformed the S&P over the next year after 6 of 8 signals.
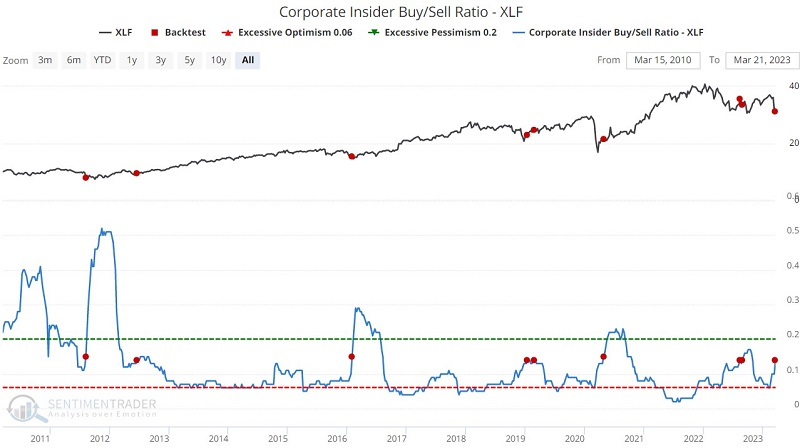
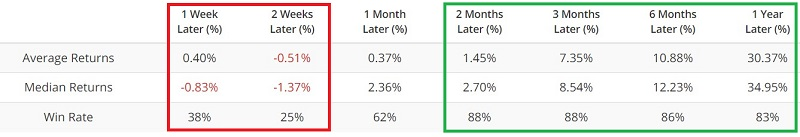
Insiders would presumably be more inclined to sell shares if they anticipated a collapse in their sector. While insider selling has picked up somewhat, it remains subdued relative to other periods. The indicator below combines buying and selling activity into the Corporate Insider Buy/Sell Ratio - XLF indicator. The red dots note those times when the ratio has crossed above 0.139. Again, mostly gains over the medium-term.
Real estate is plunging
Jay showed that the real estate sector has sold off hard in recent weeks. The good news is that the sector will soon enter a favorable seasonal period. For an investor willing to accept an above-average level of risk, there may be an opportunity in options.
The chart below displays the annual seasonal trend for ticker IYR. Note that the seasonal trend will bottom on Trading Day of Year #56. A favorable period then extends through at least TDY #81. For 2023 this period extends from the close on 2023-03-23 through 2023-04-28.
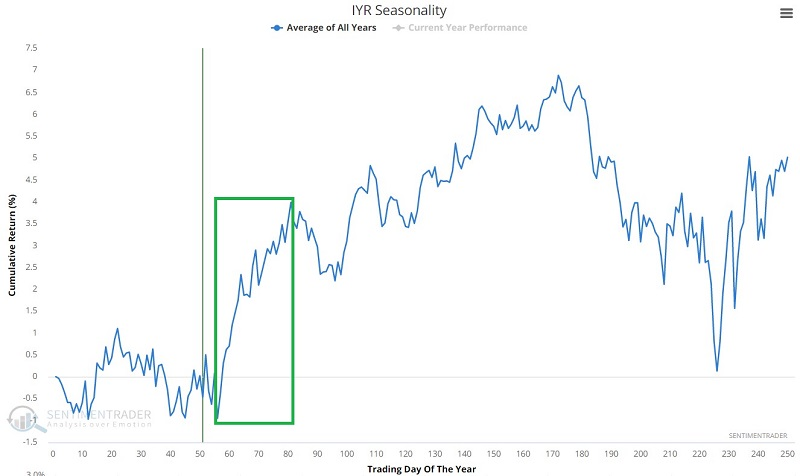
Of course, it is essential to recognize that the chart above is NOT a roadmap. It is merely a depiction of the historical annual tendency.
The chart below shows an SL Green Realty (SLG) bar chart along with implied volatility expectations from the options market. It has recently spiked to an extreme level.
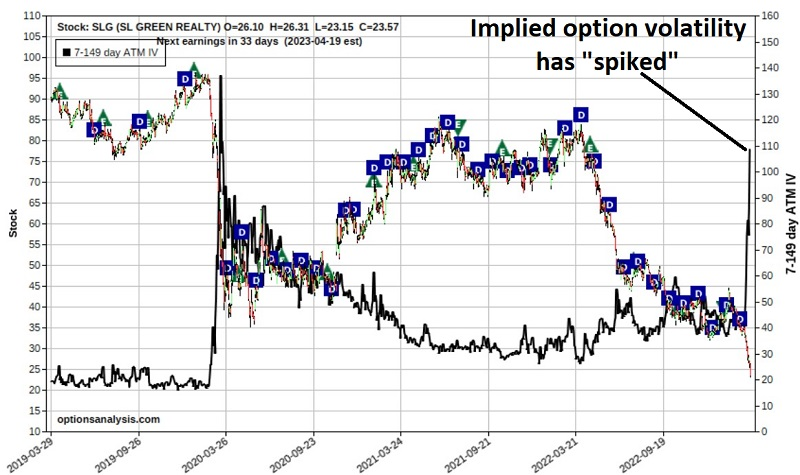
No one advocates buying the stock today. The questions to ask are, "am I willing to bet that this stock will NOT drop another -36% in the next 35 days?" and "if it does fall that far that soon, am I willing to buy it then, knowing that the dividend yield at that time would be more than 20%?"
The strategy we will consider is selling a cash-secured put. We will sell an out-of-the-money put option and collect the option premium. The present high implied volatility (IV) guarantees we will collect top dollar for selling the put option. To enter this trade, we will need to have enough cash in our account to ensure that we can buy 100 shares of stock per put option sold at the strike price of the option sold.
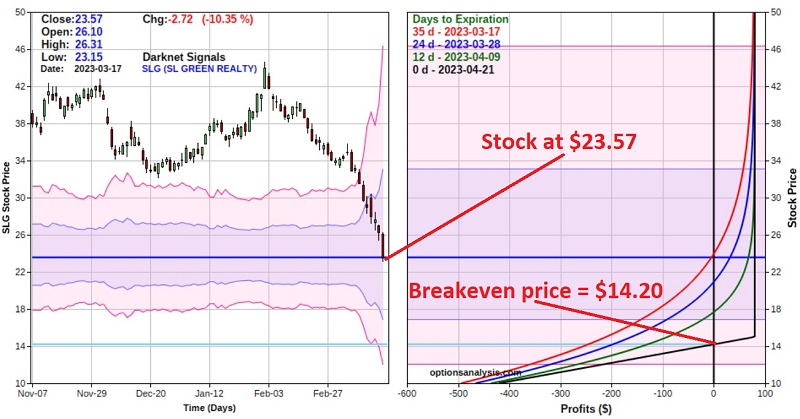
Our example trade for SLG involves selling the Apr21 2023 15 put at $0.80. The particulars for the trade appear in the screenshot below.
Things to note:
- As this is written, SLG stock was trading at $23.57 a share
- There are 35 calendar days left until the Apr21 2023 options expire
- We sell the 15-strike price put, so we must have $1,500 in our account in order to guarantee that we can buy 100 shares of SLG if the stock is put to us. This amount can include the $80 option premium we receive for selling the put option. So the maximum risk is $1,420 (the maximum risk would only be incurred if we were required to buy the stock at $15 a share and the stock ultimately went to 0 while we were still holding the shares)
- We receive $80 for selling the put option, so if the option expires worthless, our return would be 5.63% in 35 days ($80 income/$1,420 risk)
- The stock must fall another -36% from 23.57 to reach the strike price of $15 (i.e., this trade is a bet that the stock won't fall that far that soon)
- If SLG stock does fall to $15 before the April options expiration and the put option is exercised, we will buy 100 shares at $15 a share - however, our effective breakeven price is $14.20 because of the option premium we received when we sold the put
Another thing to note that may make this trade attractive to a particular segment of investors is this: The annualized dividend, as just announced, is $3.25. If we buy the shares at an effective price of $14.20, the dividend yield at the time would be roughly 22.9% (barring a cut in the dividend - it is up to the investor to explore the likelihood of a dividend cut before making a trade).
In a perfect world, our two potential outcomes are collecting a 5.63% yield in just over a month (if the option expires worthless) or buying a presumably undervalued stock with a monstrous dividend yield (if the option is exercised). But again, the risks that the investor takes on are the risk that the stock continues to fall much farther in price and/or that the dividend gets cut somewhere along the way.
A thrust signal for corporate bonds
Dean showed that price trend and breadth-based indicators for investment-grade bonds turn bullish. After similar conditions, investment-grade bonds showed solid long-term results.
The recent reversal in Treasury yields from uptrends to downtrends sent investment-grade bond prices surging again, triggering the 5th breadth thrust buy signal in the last ten months. While 3 out of 4 previous alerts showed a gain at some point in the first month, the increased upside participation did not materialize into a long-term trend change for an investment-grade bond index until now.
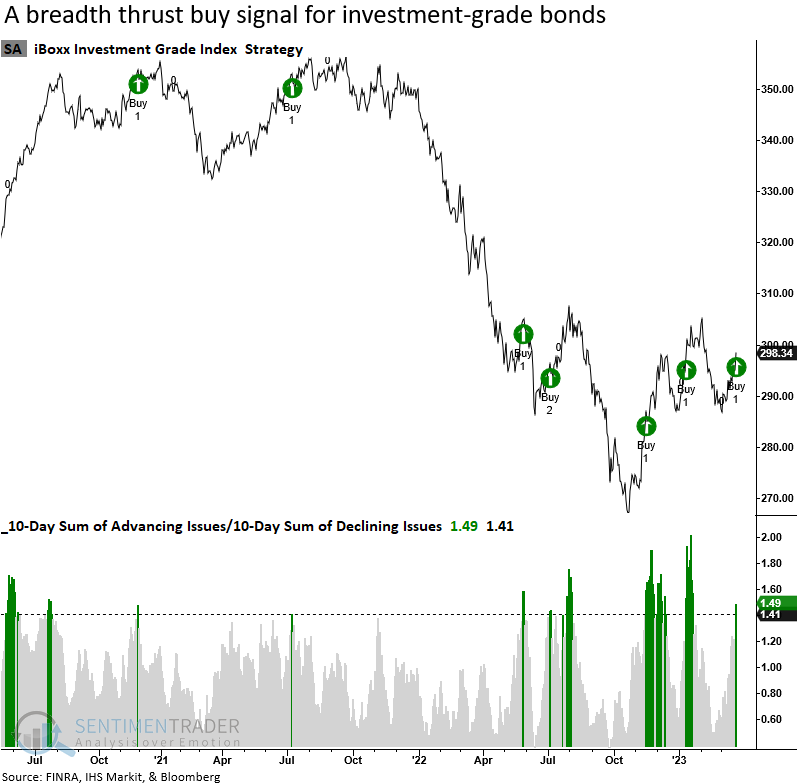
When a breadth thrust signal triggers for investment-grade bonds, the iBoxx IG Index shows a clear upward bias across all time frames. The sweet spot occurs three months later, which offers a solid win rate and z-score.
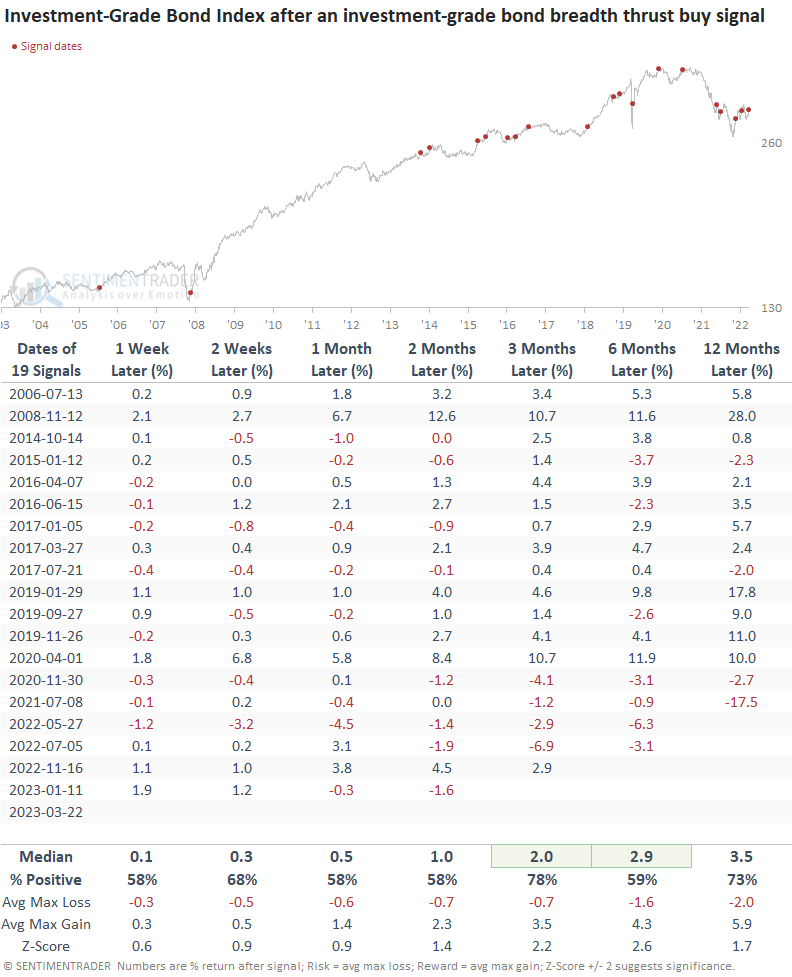
Over the last ten months, the cluster of breadth thrusts slowed the extreme downside momentum in the iBoxx Investment-Grade Bond Index. In doing so, price-based indicators bottomed and have now turned up, lifting a composite trend model to the second-best score possible.
Treasury yields are plunging, too
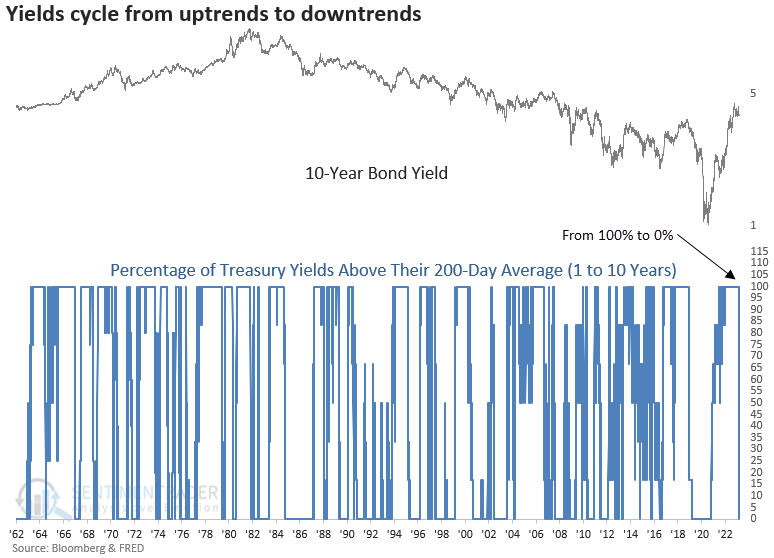
Dean noted that the percentage of Treasury yields above their 200-day average cycled from 100% to 0%. After similar reversals, yields declined across most time frames consistently.
For the first time since 2019, the percentage of Treasury yields with maturities from one to ten years trading above their 200-day average cycled from 100% to 0%. The abrupt trend reversal occurred in only one session, which had never happened before now.
When the percentage of Treasury yields above their 200-day average cycles from 100% to 0%, the 10-year yield showed a fairly consistent downward bias. Over the next two months, the 10-year declined 75% of the time. Interestingly, more than half of the signals occurred in a rising rate environment (1966-82), which also marked a secular bear market for equities.
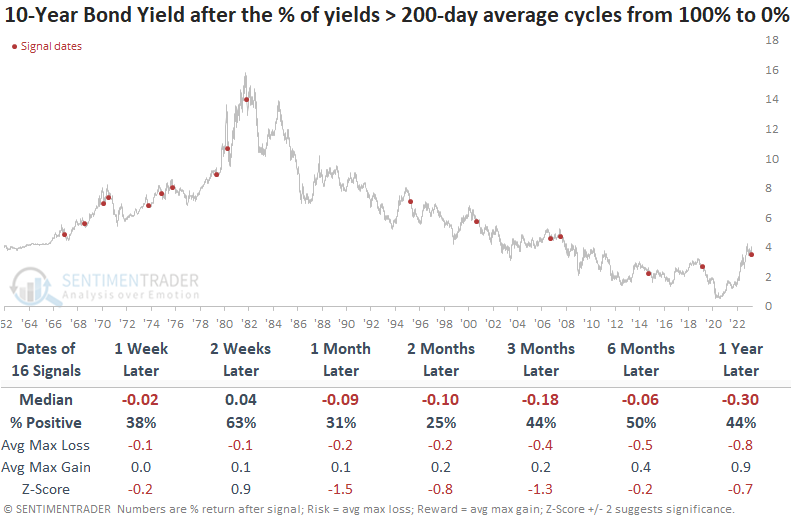
The 1-year T-Bill yield fell 81% of the time over the next few months, which was the most consistent decliner among all the maturities.
If you're concerned that we're in a higher-for-longer rate environment due to sticky inflation, similar to the 1966-82 period, the 10-year yield tended to fall over the next few months despite a secular uptrend in interest rates.
Dean also looked at returns in the S&P 500 and various sectors after these signals. The medium- to long-term returns in the S&P 500 were solid, though there were some outliers.
Seasonality and metals ratio remains a bond headwind
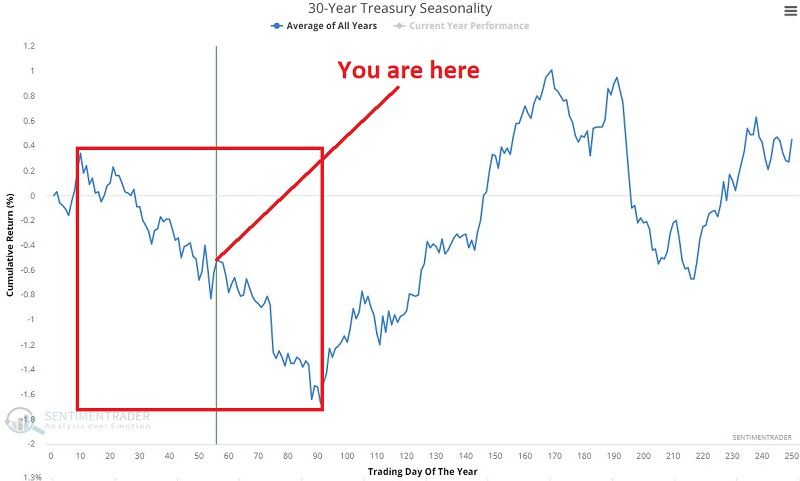
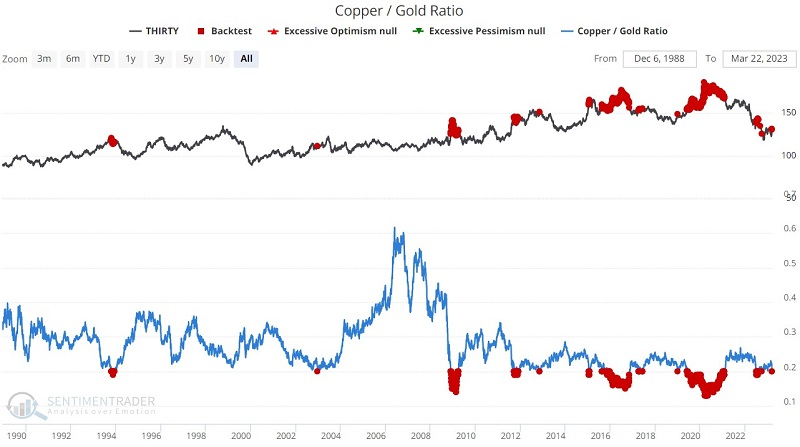
Jay suggested that T-bonds have long shown a tendency to decline during the first three months of the year, and extreme readings in the copper/gold ratio have a history of highlighting reversals in bond prices. When either of these indicators is unfavorable, T-bonds typically struggle.
The chart below shows the annual seasonal trend for ticker TLT. An unfavorable period extends from the close of Trading Day of Year (TDY) #10 through TDY #91. For 2023 this period extends from the close on 2023-01-17 through 2023-05-09. We are presently roughly halfway through this period.
Unrelated to seasonal influences, Treasury yields and the copper/gold ratio have typically enjoyed a reasonably strong correlation, though it has weakened since January 2020. When the copper/gold ratio reaches an extreme and reverses, T-bond prices also typically reverse.
The chart below highlights all days when the copper/gold ratio indicator was below 0.20, with the 30-year treasury future price in the top clip. Note the tendency for T-bond price weakness following such readings.
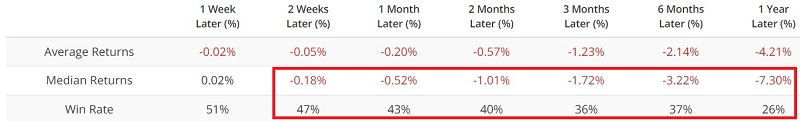
For this test, we will create a two indicator Combined Model. The first indicator is bearish the Trading Day of Year is between #10 and #91. The second indicator is bearish if the Copper/Gold Ratio indicator has been below 0.20 within the last year.
The chart below displays the cumulative $ +(-) from holding a long position in T-bond futures only on days when the seasonality and metal inputs were negative.
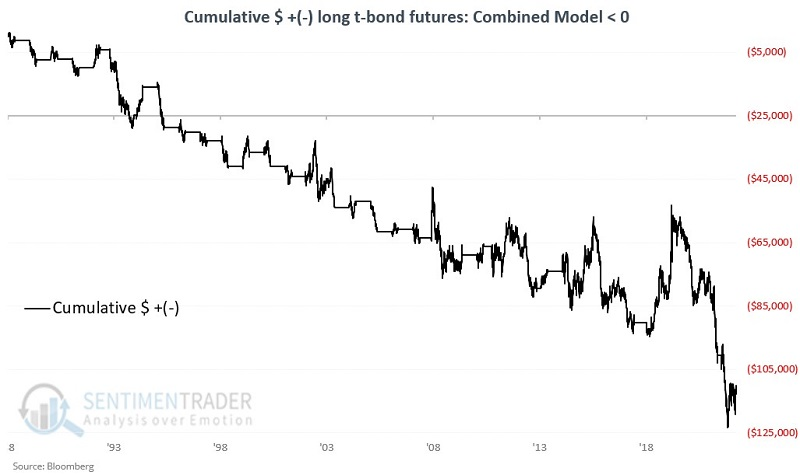
Since January 1989, the cumulative return in a T-bond contract when the model was positive was +$152,466. When the model was negative, the contract returned -$112,778.
At the moment, we are between Trading Day of Year #10 and Trading Day of Year #91, so the seasonality input will remain negative through May 9. The copper/gold ratio fell to 0.1983 on March 17, so the metal input to the model will stay negative for another year.
Does that mean that t-bonds are doomed to continue falling for another year? Not at all. But based on the results above, this somewhat crude model remains firmly on the unfavorable side of the fence for T-bonds.
About TradingEdge Weekly...
The goal of TradingEdge Weekly is to summarize some of the research published to SentimenTrader over the past week. Sometimes there is a lot to digest, and this summary highlights the highest conviction or most compelling ideas we discussed. This is NOT the published research; rather, it pulls out some of the most relevant parts. It includes links to the published research for convenience, and if you don't subscribe to those products, it will present the options for access.