
TradingEdge Weekly for Mar 22 - Highs continue to spread, strong and quiet momentum, good energy

Key points:
- New 52-week highs continue to spread
- Positive momentum has trickled down to industries
- Big tech has been strong, and the move has been relatively quiet
- Traders are pricing in quiet trends across asset classes
- Small speculators are holding large bets on major equity index futures
- The average energy stock has broken out to a new high
- The sector is also entering a positive seasonal window
- German stocks are, too
- Copper has had a great couple of weeks
- Unleaded gas is in a favorable time of year but may have front-run some gains
New highs continue to spread
The parade of stocks hitting 52-week highs continues. Dean showed that annual highs for stocks in the Discretionary, Financial, and Industrial sectors surged higher, with similar expansions in new highs suggesting the uptrend in the S&P 500 will persist.
On Thursday, a considerable number of stocks catapulted higher, sending the percentage of S&P 500 stocks registering annual highs to the most significant level since May 2021. Financials, Industrials, and Consumer Discretionary maintained the highest proportion of members registering a high.
New highs also expanded at the index level, with more than 60% of cyclical sub-industry groups closing at the highest level in a year. So, both internal and external measures of price action for stocks that are sensitive to shifts in the economy confirm the uptrend in stocks.
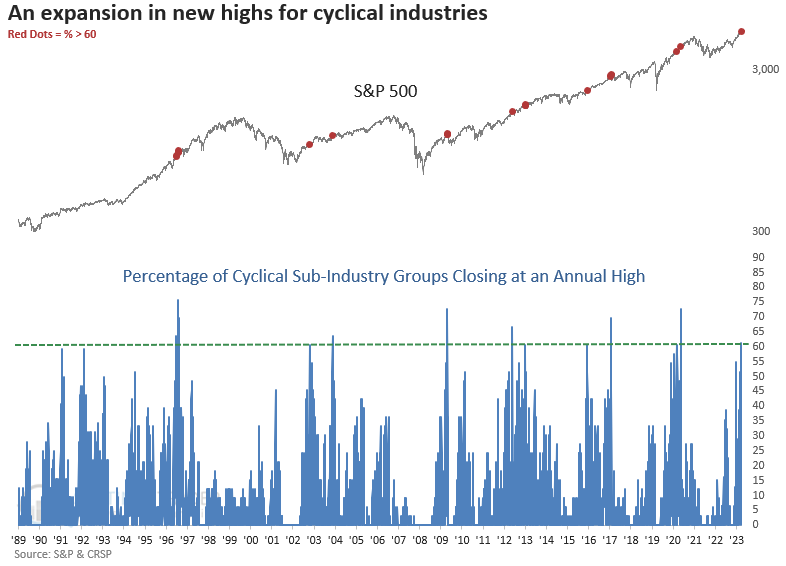
When more than 30% of stocks in the Discretionary, Financial, and Industrial sectors recorded annual highs, the S&P 500 tended to rally over the following year, but the sample size was very small.
Lowering the threshold to 25% to increase the sample size, the S&P 500 displayed favorable returns and win rates, especially over the subsequent six and twelve months. In both of those time frames, the average maximum gain surpassed the average maximum loss by a considerable margin.
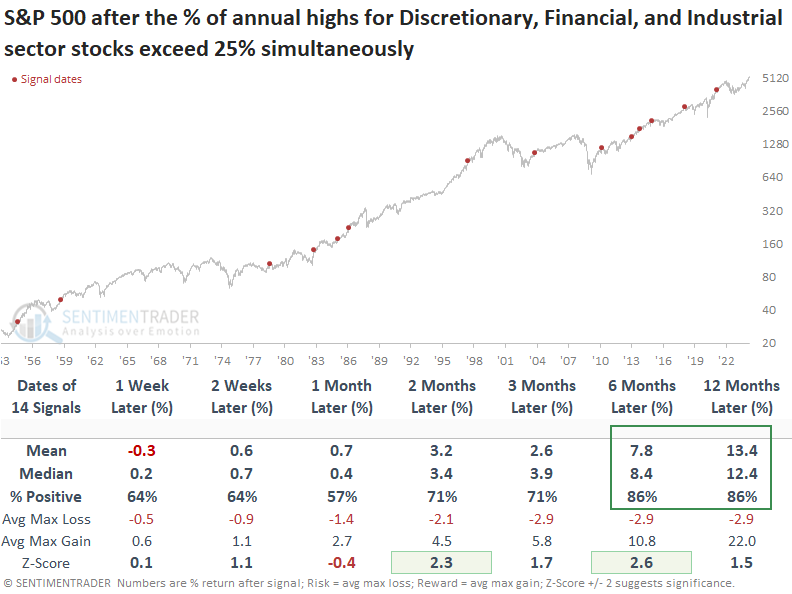
Over the following year, Discretionary and Industrials outperformed the S&P 500 while Financials underperformed.
Momentum is trickling down to industries
A substantial number of sub-industry groups are exhibiting positive year-over-year returns. Dean showed that since 1948, similar price momentum dynamics preceded a 100% win rate for the S&P 500 a year later.
Last week, another big-picture indicator incorporating price action for small, medium, and large-capitalization stocks experienced a bullish shift. For the 30th time since 1933, the percentage of sub-industry groups with a positive 1-year rolling return cycled from less than 20% to greater than 80%.
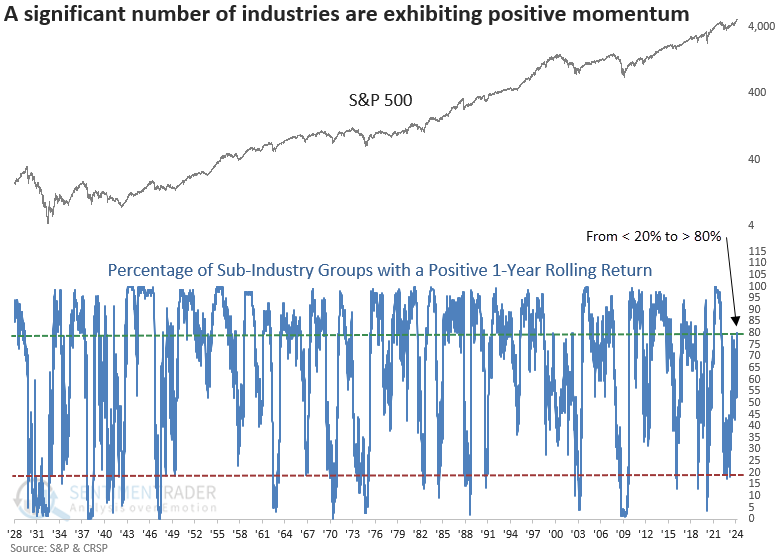
A resurgence in positive long-term price momentum for sub-industry groups heralds a favorable outlook for the S&P 500 over the subsequent year. Since the 1946-49 drawdown, precedents have been outstanding, showing a gain every single time a year later.
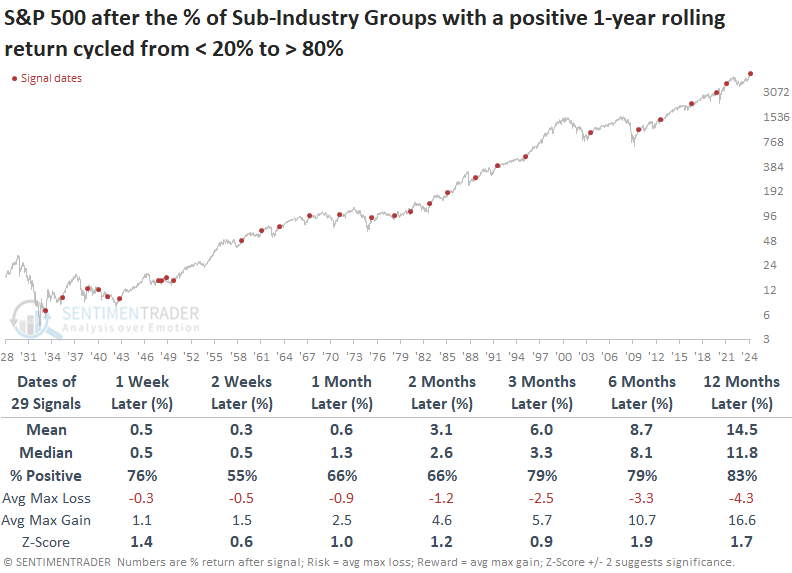
Since the bear market of 1946-49, drawdowns one year later have consistently remained subdued, with no instance of a maximum loss exceeding -10%, except for a single occurrence triggered prior to the onset of the Covid crash.
Big tech is quietly strong
It's no secret that the big tech stocks powering the Nasdaq 100 (NDX) have been in a powerful uptrend. What may be a bit surprising is how quiet the rally has been.
Over the past 90 sessions, the NDX has averaged a large daily average change of more than +0.25% per day with a low and declining standard deviation among those daily returns - pretty much a textbook definition of a strong, quiet uptrend.
When the quiet uptrend reached the current threshold, annualized returns in the NDX tended to suffer. It averaged about half the returns during more normal periods. Too much of a good thing is not necessarily a good thing; all apologies to Mae West.
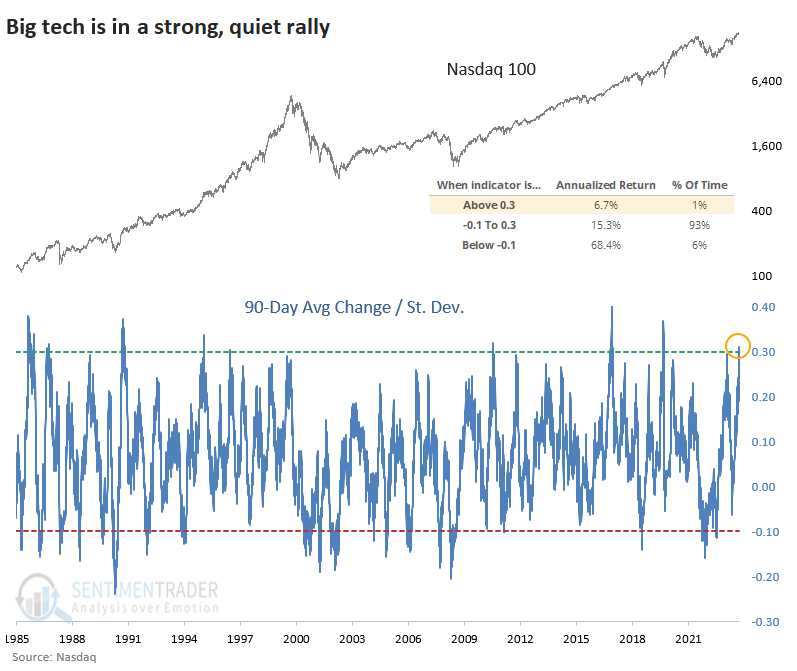
Just because annualized returns during these periods were low, it didn't mean it was a good sell signal. Rather, forward gains tended to be muted in the short-term but still mostly positive.
The table below shows returns in the NDX after the ratio of its 90-day average return to its standard deviation rises above +0.3. In the short term, returns weren't all that great, with half of the small sample showing gains. But over the next six months, each sported a positive return.
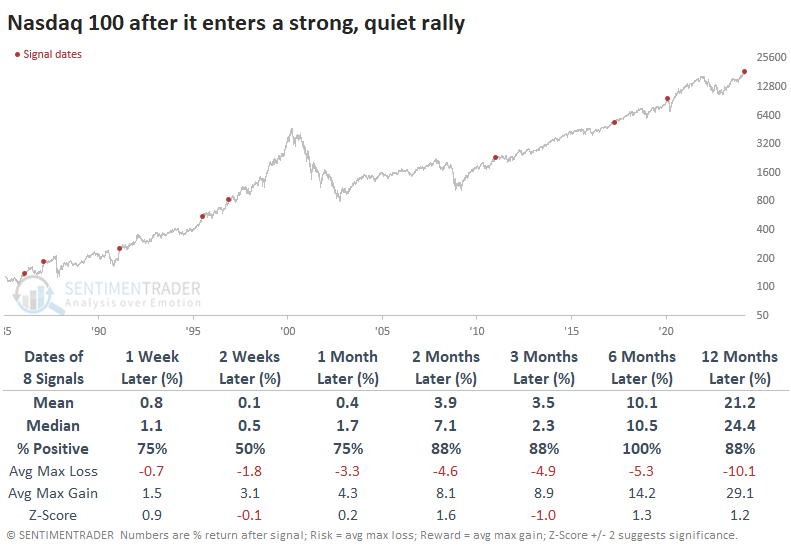
The table of maximum gains and losses across each time frame shows that up to three months later, only one of the signals suffered more than a -3.3% drawdown, that exception being the 2020 pandemic.
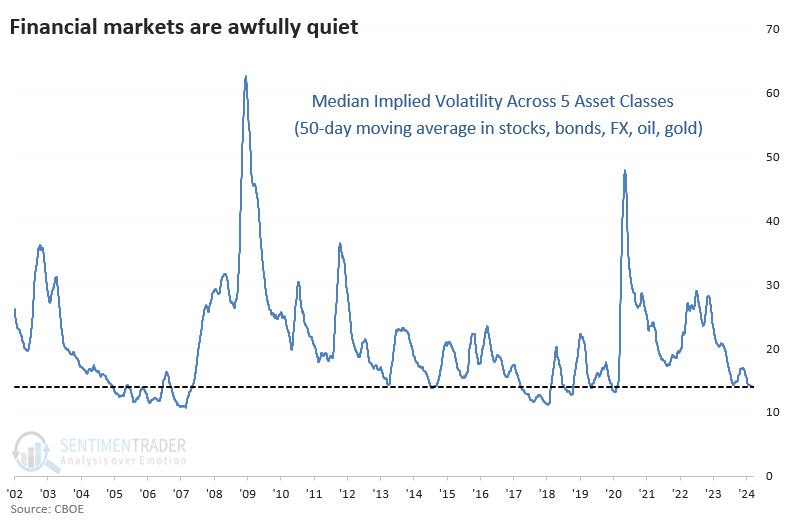
Traders are pricing in calm in other markets, too
Even if other asset classes not rallying as much as equities (or rallying at all), traders are betting that those other assets will remain relatively calm. Across five different assets, implied volatility has dropped precipitously from levels a year ago.
The median implied volatility across stocks, bonds, foreign exchange, crude oil, and gold has averaged less than 14% over the past 50 days. That's the lowest since early 2020 and one of the lowest levels in over two decades.
The table below shows returns in the S&P 500 when the median cross-asset volatility 50-day average crosses below 14. While its returns were mixed over the medium term, there were few significant losses. Even though the only significant decline occurred during the pandemic, there also weren't many large gains up to six months later. This is consistent with low-volatility environments.
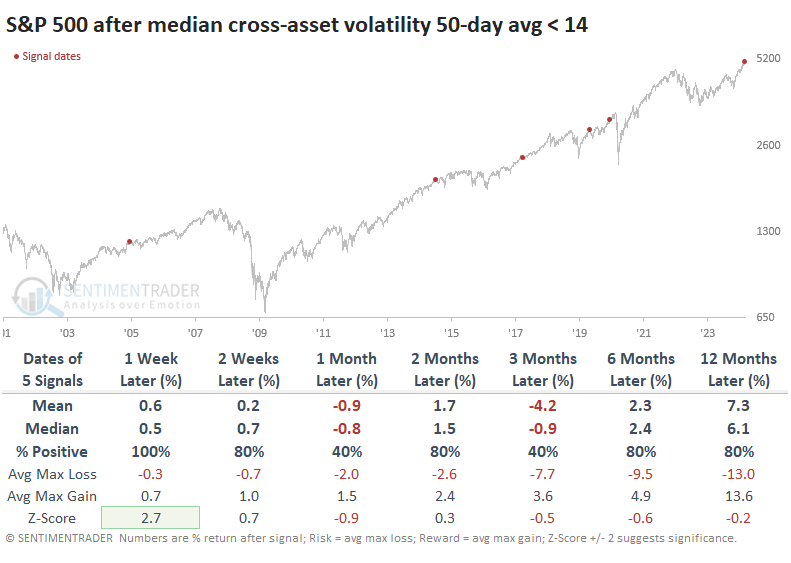
In fixed income, 10-year Treasury futures whipped around over the next couple of weeks but generally rallied afterward. Over the next six months, the futures showed a gain every time, with an impressively skewed ratio of reward to risk.
The U.S. dollar didn't respond all that well after these signals; all but one of the signals saw the dollar decline either three or six months later.
Gold mostly rallied after these signals, with four out of five signals showing a positive one-year return.
Out of all the markets, crude oil responded the worst. Oil suffered a double-digit decline over the next three months after four of the five signals.
Small speculators are loving stocks at the moment
One worry is that small speculators in stock indexes have reached their most bullish net position ever. Jay noted that this action does not in and of itself constitute a sell signal, but does suggest that sentiment may be moving from a positive to a potential negative for stocks.
As small speculators tend to be the "Wrong Way Corrigan's" of the stock market, it can be helpful to note when their bet position reaches an extreme - such as now.
The chart below highlights all weeks when the Small Spec Index Position indicator was above 29, meaning they held approximately $29 billion worth of contracts net long among major equity index futures contracts.
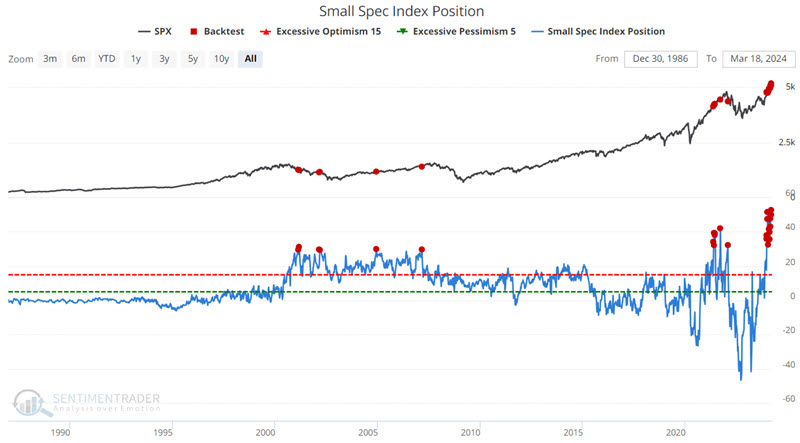
Interestingly, they have shown a tendency to be right - for a while - before everything typically goes wrong. As you can see in the table above, the Win Rate for two months and three months is 83% and 86%, respectively. But from there, things have tended to go seriously south. The 12-month Win Rate is only 8%, with a median decline of -7.04%.
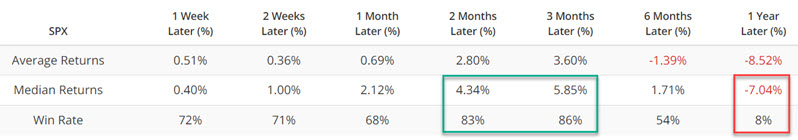
The chart below displays the hypothetical growth of $1 invested in the S&P 500 Index only from three months following an initial signal through 12 months after the initial signal - or any overlapping signals (i.e., a new signal that occurs within 12 months of a previous signal extends the holding period for another 12 months).
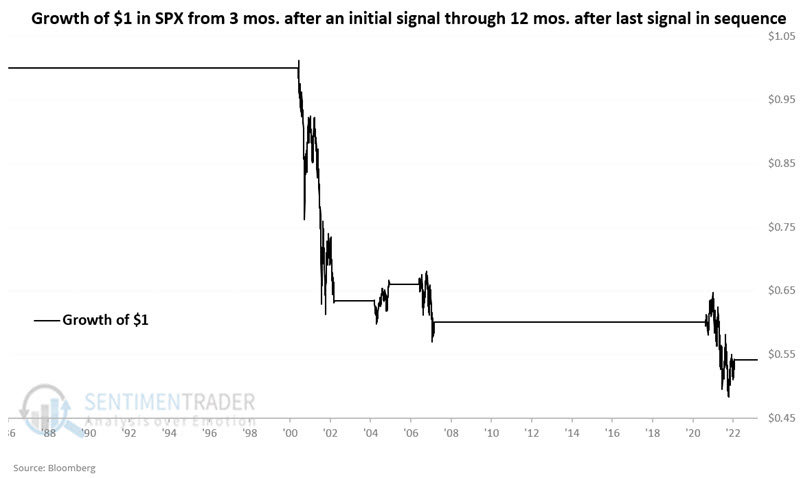
The average energy stock is hitting new highs
The advance-decline line for the S&P 500 Energy sector closed at a new multi-year high. Dean noted that the S&P 500 Energy sector resides below its high, creating a bullish divergence.
Usually, stocks enter a catch-up phase when the advance-decline line reaches a new high before a stock index.
In instances where the S&P 500 energy sector advance-decline line reaches a two-year high, as the index ranks between the 90th and 99th percentile of its two-year range, the S&P 500 energy sector tends to rally over the subsequent year, with returns and win rates exceeding the study period results across every one of the outlook time frames.
In 24 of the 28 instances, the index surged to a new 2-year high before six months had passed, with the majority of occurrences happening swiftly thereafter.
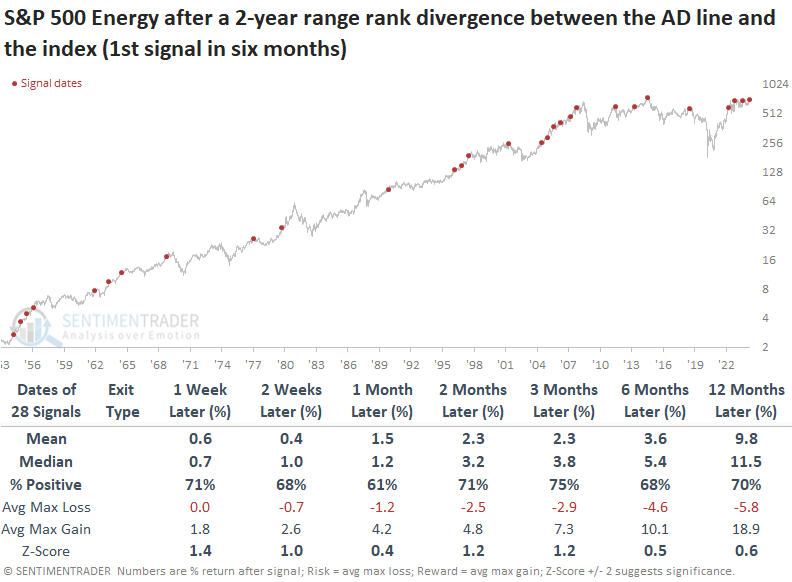
In just two instances over the following two months, the maximum loss exceeded -10%, a remarkable anomaly given the sector's typically volatile nature.
Energy stocks are also entering a favorable time of the year
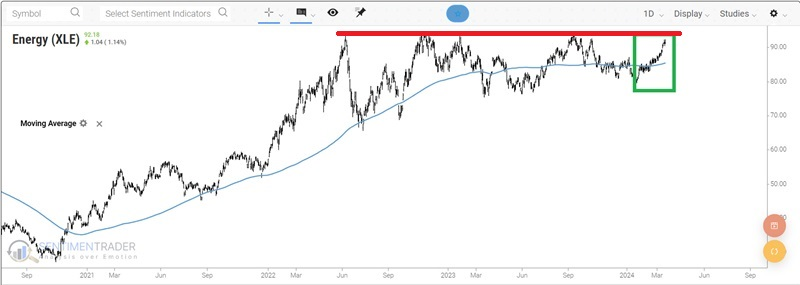
The energy sector has rallied over 15% since mid-January. Even so, Jay showed that history suggests that traders continue to give the bullish case the benefit of the doubt.
When energy stocks go, they tend to really go. Despite its lack of net upside in the past 16 years, this sector can offer terrific trading opportunities. In the chart below, we see that XLE has enjoyed a nice run so far in 2024 and is facing some apparent upside resistance.
The question on traders' minds is, "Can the rally in energy continue?"
The annual seasonal trend for the iShares Energy ETF (ticker XLE) has a seasonally positive period that extends from the close on Trading Day of the Year (TDY) #56 through TDY #110. For 2024, this period extends from the close on 2024-03-21 through 2024-06-07. The chart below displays the hypothetical growth of $1 invested in the energy index only during this period every year (log scale).
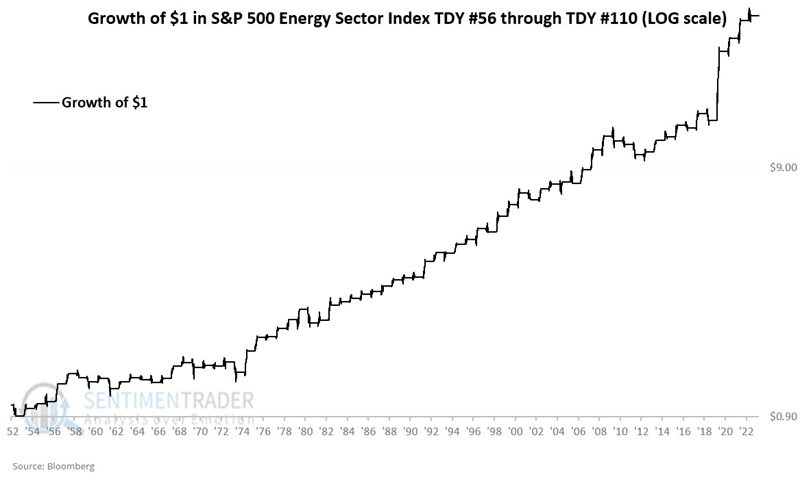
These windows sported a gain 73% of the time, with an average gain about twice as large as the average loss. More impressively, it rallied more than +10% during 21 years while suffering a loss larger than -10% only once.
The popular XLE fund had an even better performance during its shorter history.
German stocks also have a positive seasonal window
The German stock market has been treading water for seventeen years. But Jay showed that the late March through April period has tended to witness favorable results.
The iShares MSCI Germany ETF (ticker EWG) is literally unchanged in price from its level 17 years ago. In fact, as of a month ago, it was trading at the same price as it was in February 2000.
Can this advance continue? The annual seasonal trend for EWG shown below suggests the answer may be "Yes, and soon."
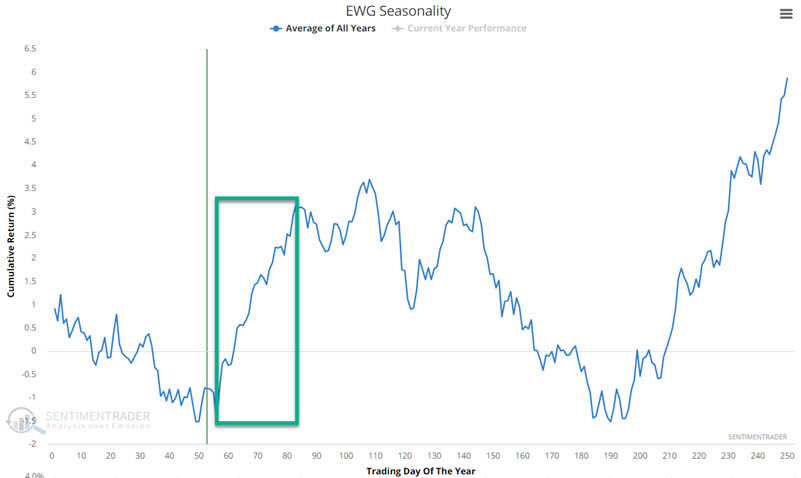
The chart above highlights the period that extends from the close on Trading Day of the Year (TDY) #56 through TDY #83. For 2024, this period extends from the close on 2024-03-21 through 2024-04-30.
The chart below displays the hypothetical growth of $1 invested in ticker EWG only during this period every year EWG started trading in 1996.
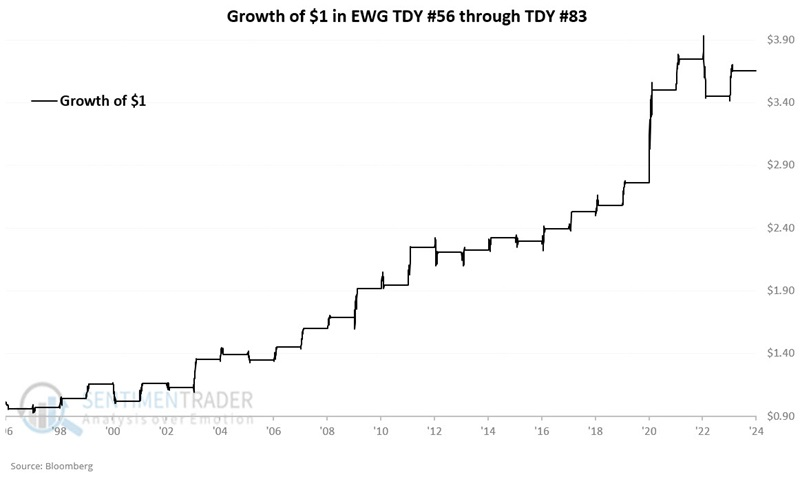
Historical seasonal results skew to the favorable side, with 3 out of 4 years showing a gain. Likewise, regarding moves greater than 10% or more during this period, favor the winning side by 7 to 1.
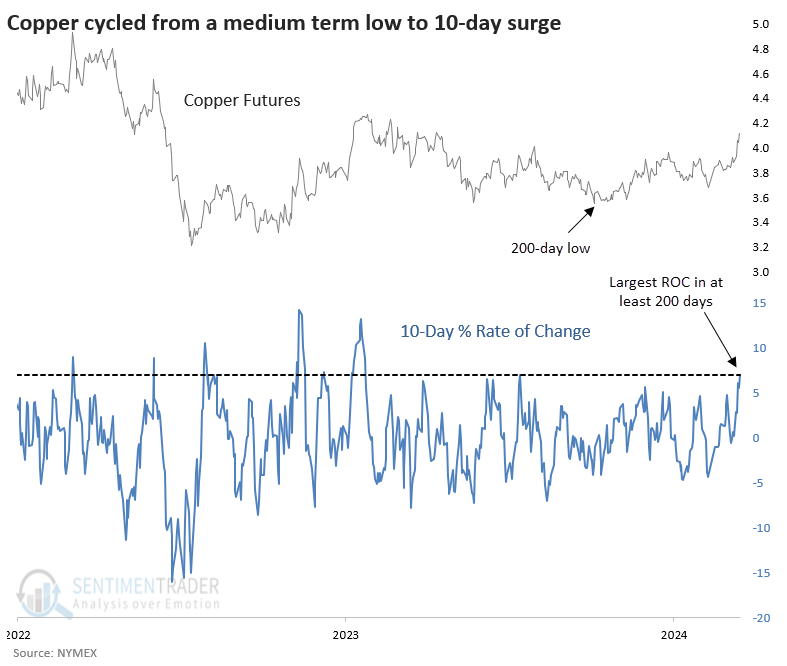
Copper had a great couple of weeks
It's not just the headline-grabbing high-beta stocks that have been surging lately. Money has been moving into often-overlooked sectors and entire markets.
One of those is copper, which has jumped 7% over the past two weeks. That's the largest 10-day rate of change in over a year for the metal. This is coming off what had been at least a 200-day low in copper last October, a potential sign of a shift in investors' mentality.
The table below shows every time the metal cycled like this over the past 35 years. Several of them did, in fact, indicate that sentiment had shifted in a sustained way. These patterns coincided with long-term bottoms in 1993, 2009, and 2020. Most of the others either showed negative one-year returns or interim drawdowns so significant they would have scared out a typical investor.
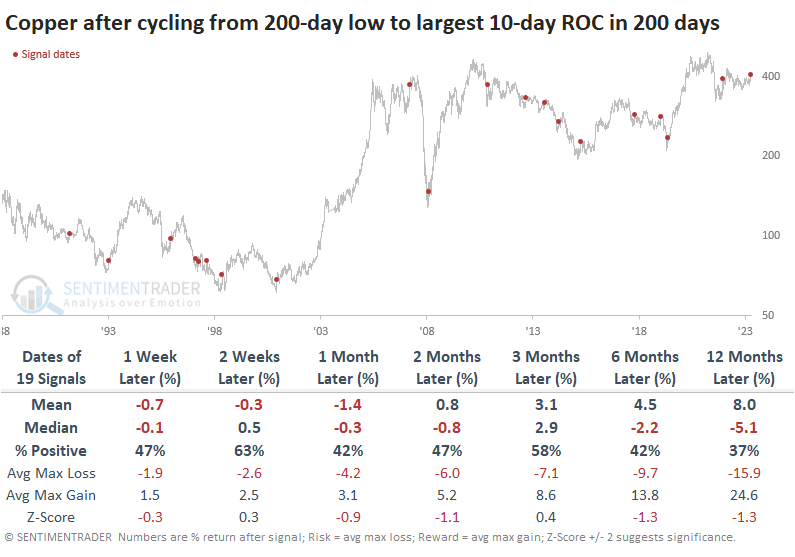
Copper is often referred to as an indicator of health for other markets. There is very little reason for this other than it was in a textbook somewhere, and everyone else just started parroting those talking points.
The best returns over the medium-term were in the S&P 500 and emerging markets indexes. The latter sported a gain 79% of the time two months later, enjoying a median rally of nearly +5%. Longer-term, the Nasdaq 100 was the best performer. Less inspiring, the small-cap Russell 2000 struggled up to a month later, gold didn't perform well across any time frame, and the broader commodity complex did even worse.
Unleaded gas is in a positive seasonal window but may have front-run the gains
Unleaded Gas demonstrated a seasonal tendency to rise in price during late winter into spring. Jay noted that 2024 is following the script, but the price is somewhat overbought.
The chart below displays the annual seasonal trend for Unleaded Gas futures. It has been pretty cooperative so far. One potential reason for a pause is that unleaded Gas has already exceeded the typical performance for the first six months of the year according to the historical seasonal average.
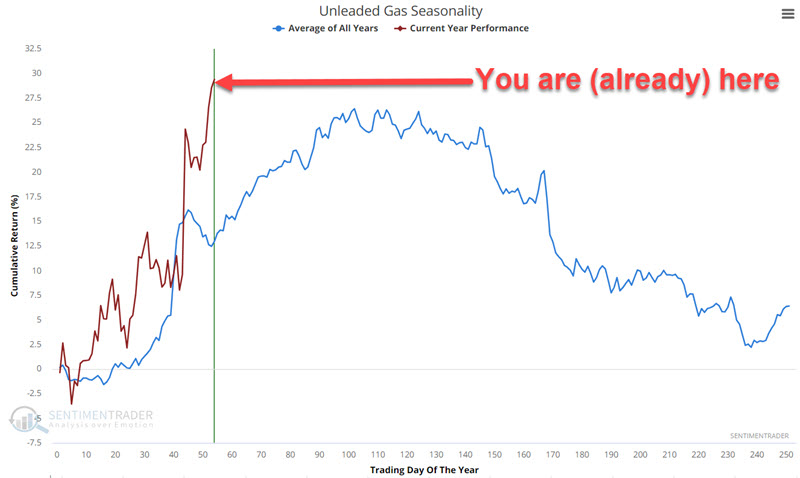
The seasonally favorable period extends to TDY #103 (2023-05-23). With the seasonal trend favorable and price action also favorable, the implication is that traders should continue to give the bullish case the benefit of the doubt. That said, a trader who has yet to jump in on the long side of unleaded Gas might consider waiting for the market to work off its present overbought RSI status before doing so.
The chart below displays the hypothetical cumulative gain from holding a long position in unleaded gas futures only during the TDY #53 through TDY #102 period every year since 2006.
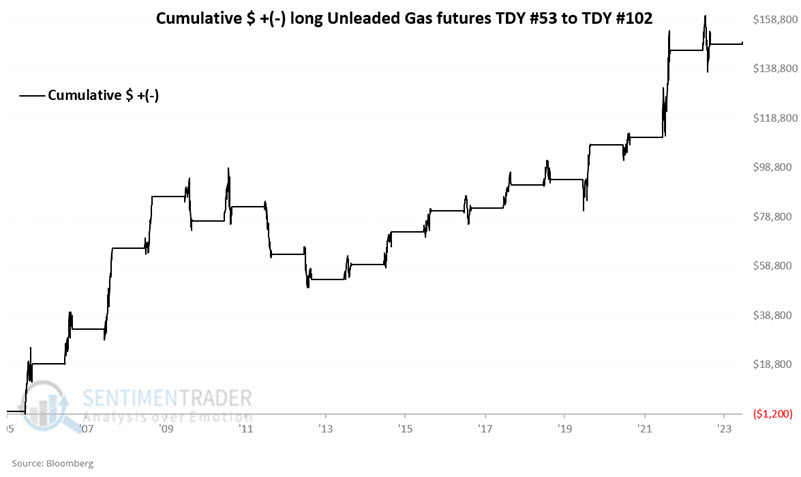
The good news is the high Win Rate and the fact that moves more than $10K in contract value skew 7 to 2 to the winning side. The bad news is that 2010, 2012, and 2013 saw significant losses (-$9,904, -$19,375 and -$10,164, respectively).
Unleaded gas futures trading is not for the faint of heart or the undercapitalized.
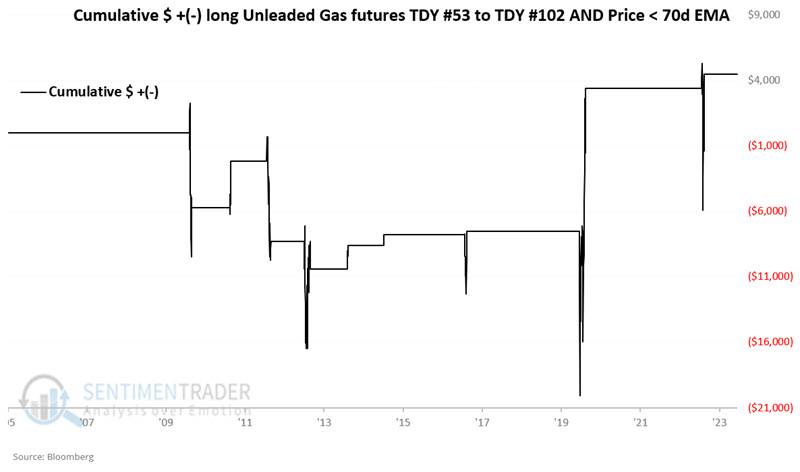
To highlight the potential importance of incorporating price trends into any seasonal drive trading, the chart below displays the hypothetical cumulative $ +(-) for a long position in unleaded gas futures when TDY is between 53 and 102, and unleaded gas futures were trading below the 70-day EMA.
A trader who wants to gain exposure to the gasoline market but who does not want to trade unleaded gas futures can do so by buying shares of UGA just as they would buy shares of stock. That fund has mostly adhered to the seasonal trend of the futures contract.
About TradingEdge Weekly...
The goal of TradingEdge Weekly is to summarize some of the research published to SentimenTrader over the past week. Sometimes there is a lot to digest, and this summary highlights the highest conviction or most compelling ideas we discussed. This is NOT the published research; rather, it pulls out some of the most relevant parts. It includes links to the published research for convenience, and if you don't subscribe to those products, it will present the options for access.