
TradingEdge Weekly for Mar 21 - Quick correction, sliding SKEW, relative gold

Key points:
- The S&P 500 fell into a correction, and we looked at how they unfolded during bear (and not bear) markets
- Already, the index enjoyed a larger price reversal
- SKEW is sliding
- Seasonality says more may be in store
- So do sentiment surveys, which showed a washout among bulls
- Gold has soared relative to stocks
- Gold is in a favorable 4-year cycle
- Keeping an eye on gas prices
Correction concerns
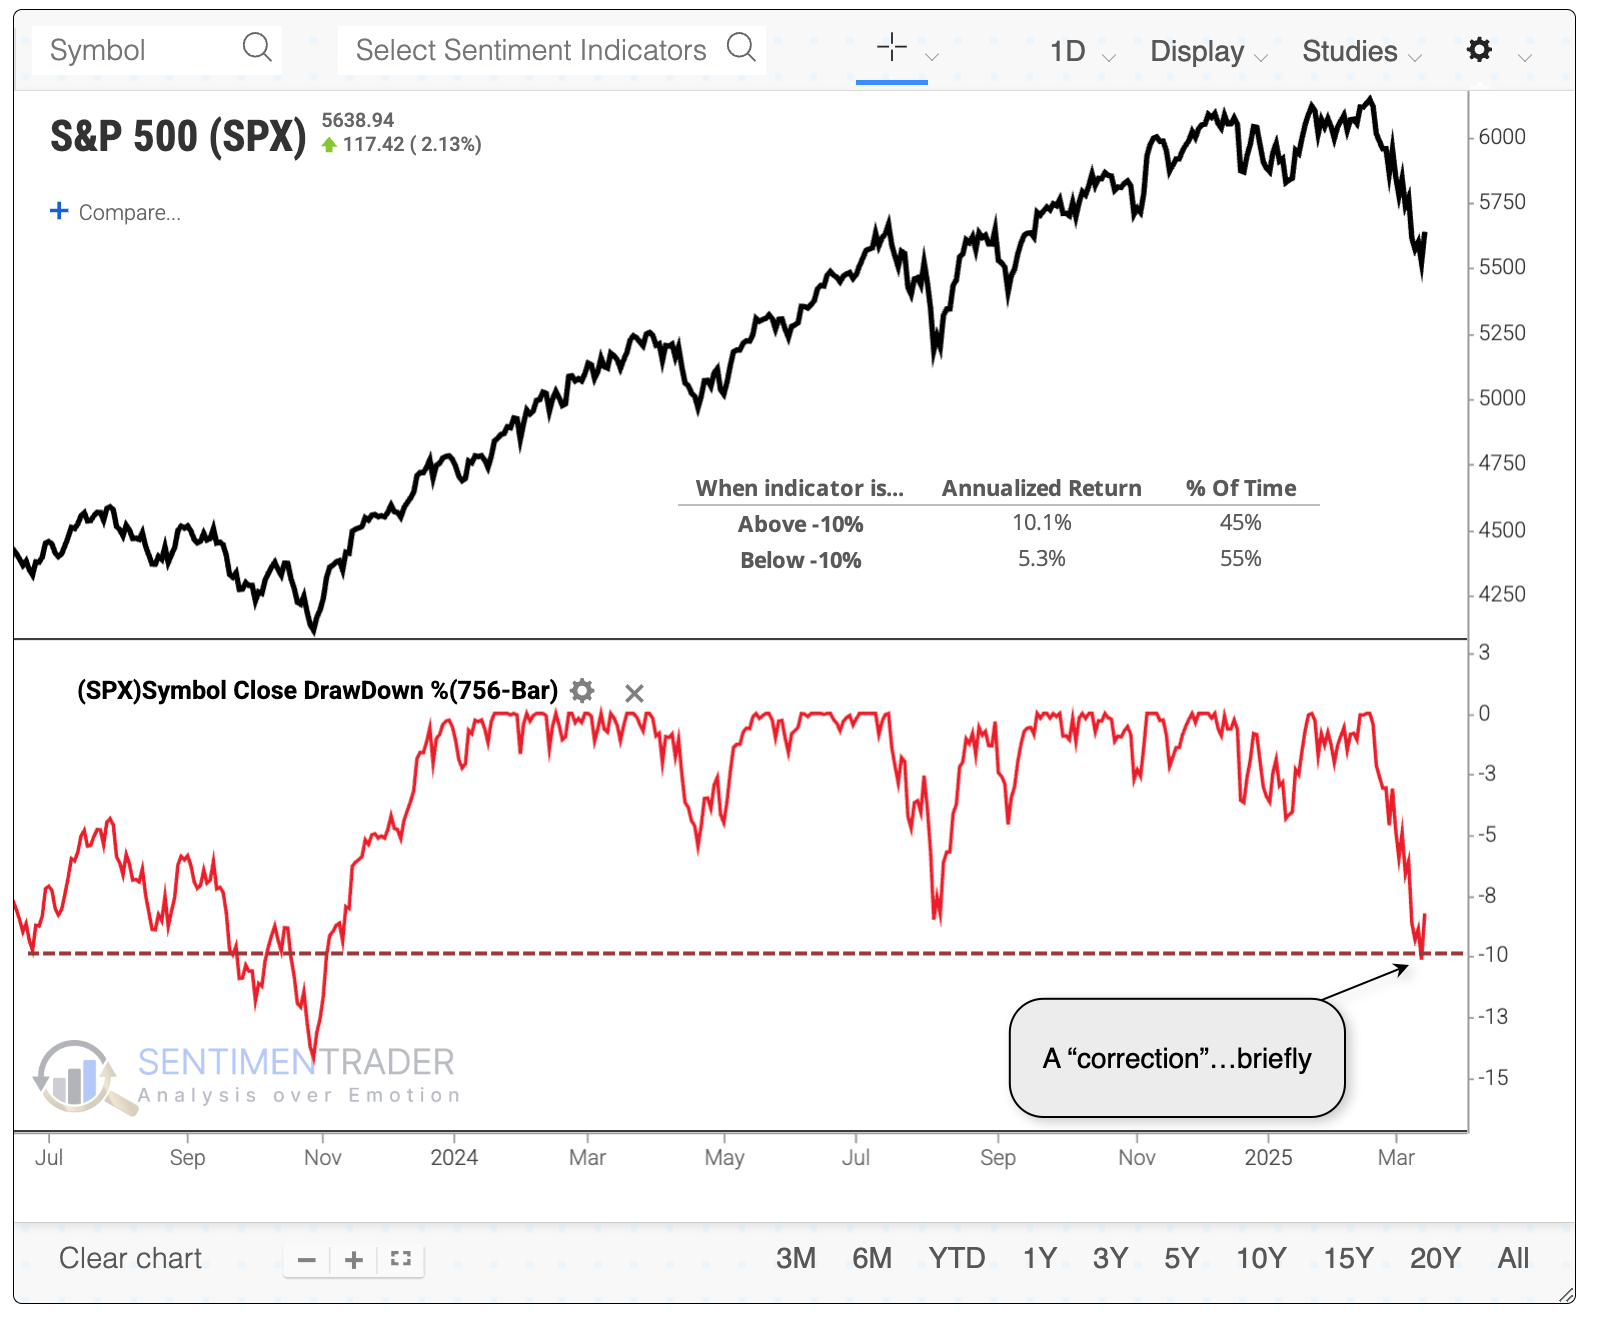
The whole world knows by now that the most benchmarked equity index in the world, the S&P 500, fell into a correction.
So far, the feared correction lasted all of one session. That's a good thing, too - we can see below that the S&P's annualized return gets cut by about half when it is 10% or more from its most recent multi-year high.
For the corrections that turned into bear markets, half the instances lost another -10% within the first month after falling into a correction. Even within the next two months, no instance gained more than +10% from the correction point. Most of these were relatively quick, losing more than -5% within the first two months.
Let's turn to the corrections that bulls hope are most similar to our current instance. These are the corrections that did not morph into bear markets, meaning that the S&P 500 did not fall more than -10% at any point within the following year.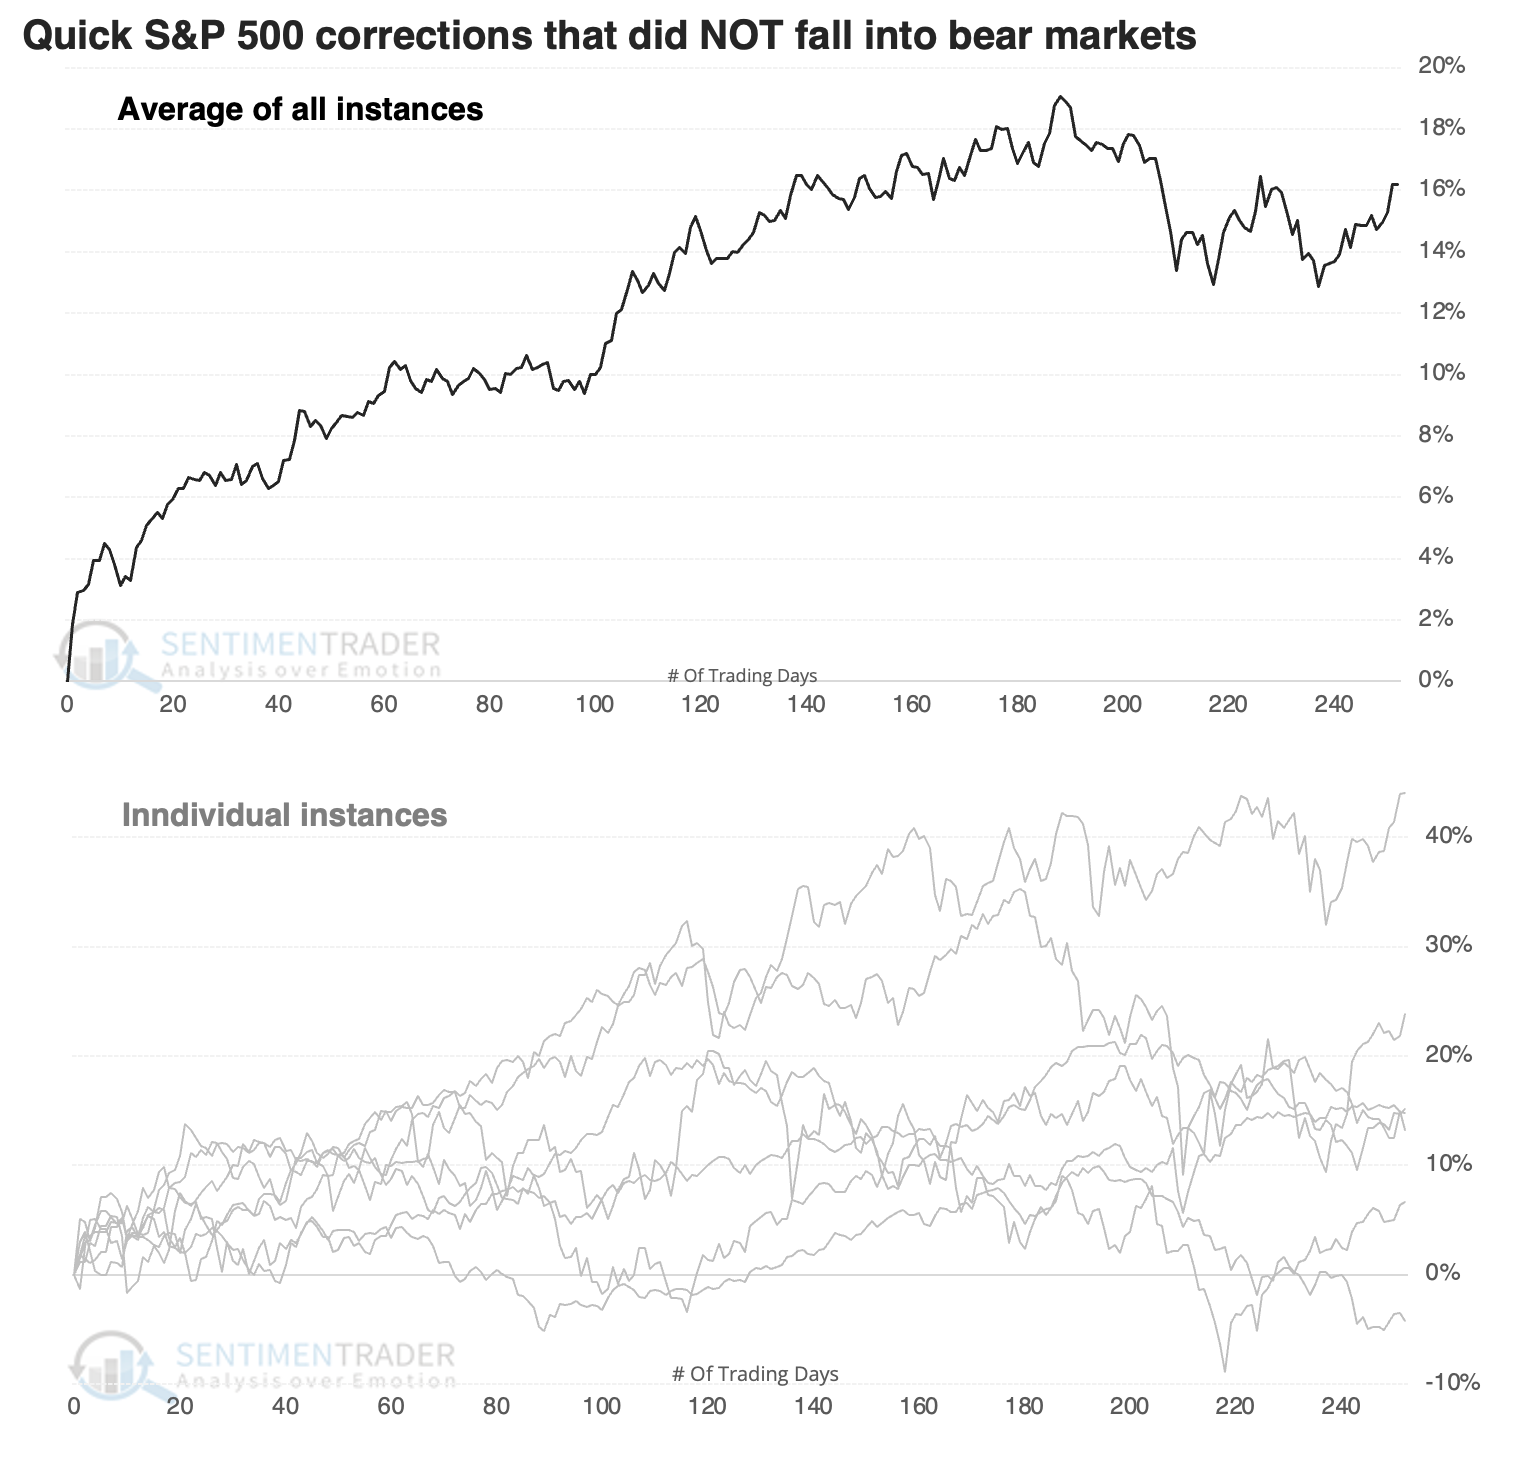
These rebounded quickly, like some of the bear market instances, so that doesn't tell us a lot. But these were also highly consistent, not giving back much, if any, of their gains as the weeks progressed. Not a single instance lost even -5% from the correction point within three months, and all seven of them gained at least +5%.
It's perhaps notable that of the four times the S&P 500 acted least like it did over the past year, the index fell into a bear market. The most-correlated years didn't show any consistent pattern - two of the three most-correlated did not fall into a bear market, but only six of the ten most-correlated did not, just a 60% probability.
About that rebound...
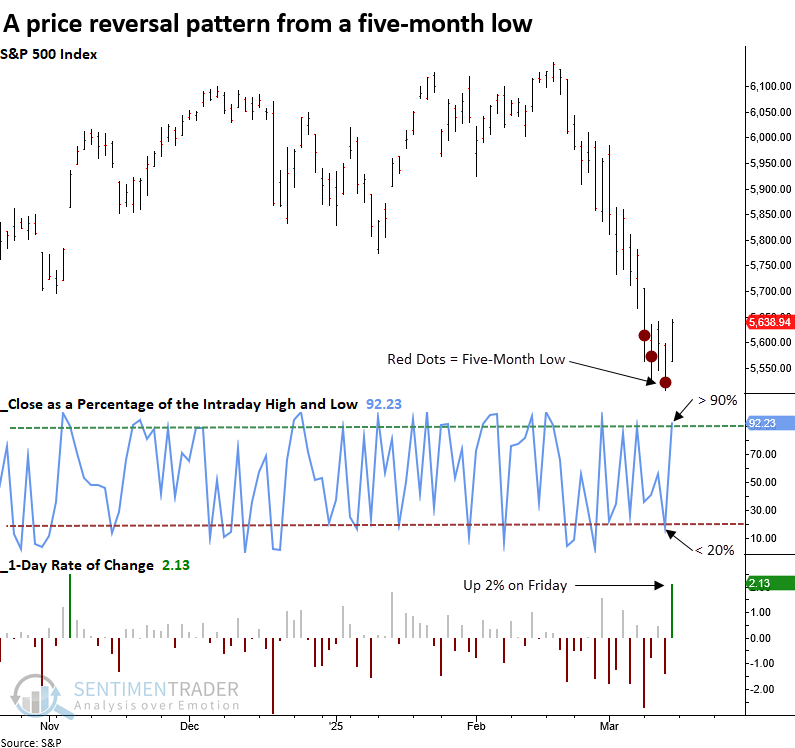
The S&P 500 closed at a 5-month low on Thursday before rebounding on Friday, finishing up 2%. Dean showed that following similar price patterns, the S&P 500 advanced 88% of the time over the next three months.
Although this appears to be a bullish reversal setup, it's essential to remain objective and let the data guide our outlook rather than relying on the eye test.
Whenever the S&P 500 experienced a two-day reversal pattern, as outlined above, the world's most benchmarked index tended to increase over the subsequent week, rallying 73% of the time. However, it lost momentum between two and eight weeks later, showing a 53% win rate before resuming its rally, indicating a typical bottoming pattern.
While the sample size is smaller, when the reversal pattern appears with the S&P 500 less than 20% below a high-correction territory - a similar pattern emerges: an initial bounce, a stall, and another rally. The three-month outlook improved notably, with gains in all but one instance.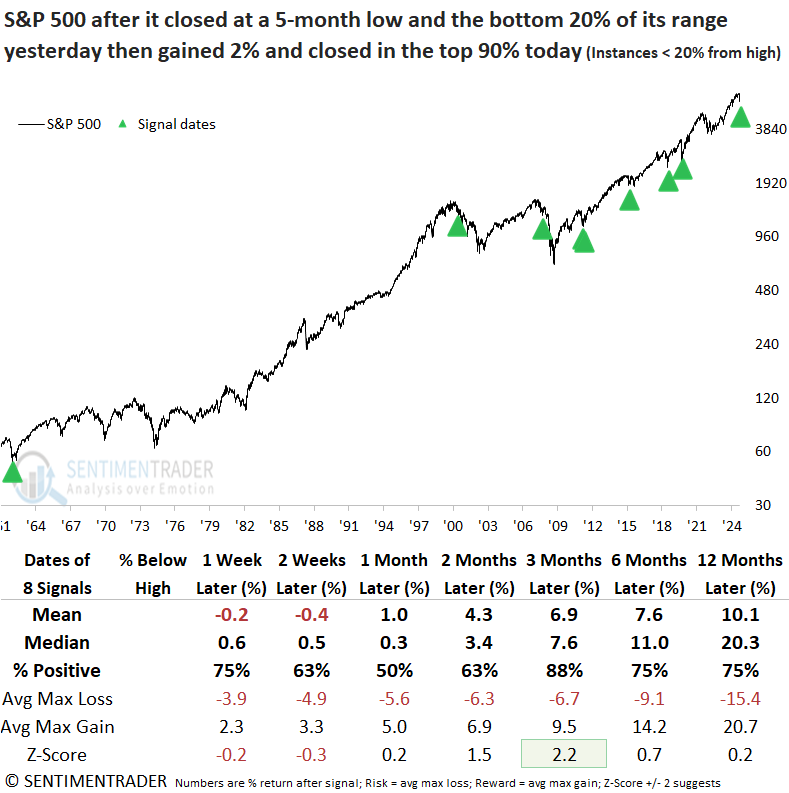
There are several resistance points for the S&P 500, with the 200-day moving average at approximately 5740 as the initial hurdle.
SKEW is sliding
The SKEW Index is an indicator designed to measure market risk. Jay showed that the rate-of-change in the index recently flashed what has historically been a favorable signal for stocks.
The SKEW Index, calculated and distributed by the Chicago Board Options Exchange, shows the risk of a "black swan" type of event in equities within the next 30 days. Basically, it shows the risk of a swift, sharp drop in prices as determined by options traders in the S&P 500 index.
We will use week-ending data from here for the SKEW Index and the S&P 500 Index. Let's look at the 13-week percentage rate of change in the SKEW Index. The chart below overlays the S&P 500 Index weekly close (black line, scale on the right), the 13-week % change in the SKEW Index (blue line, scale right) and -15% (red line, scale right).
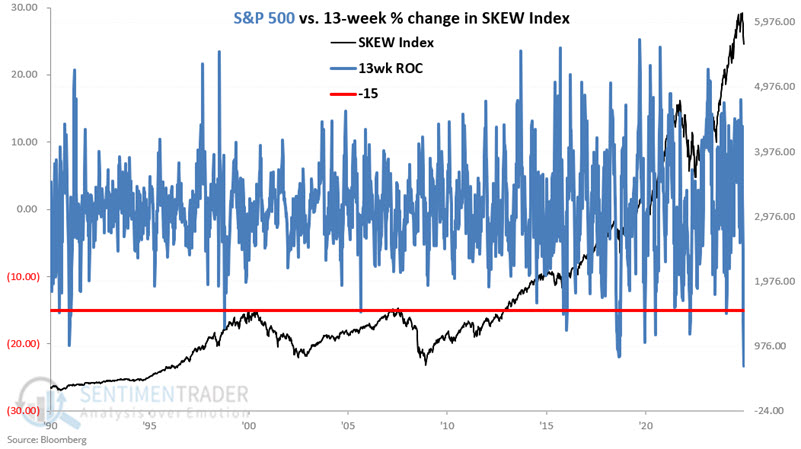
Let's examine the rare occasions when the 13-week % change for the SKEW Index fell to -15% or lower and subsequent S&P 500 performance. The most recent signals were 2024-05-03 and 2025-03-07.
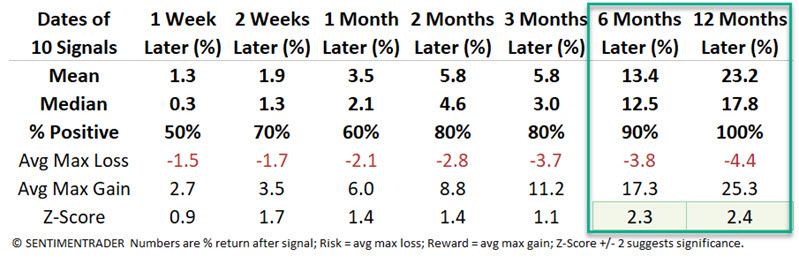
Note the compelling Win Rates, Median Returns, and Z-scores for six and twelve months after signals. While this is just one indicator, and thus more "weight of the evidence" than "proof positive," based on historical results, this interpretation of the SKEW Index falls on the favorable side of the weight of the evidence ledger.
Seasonality is now a tailwind
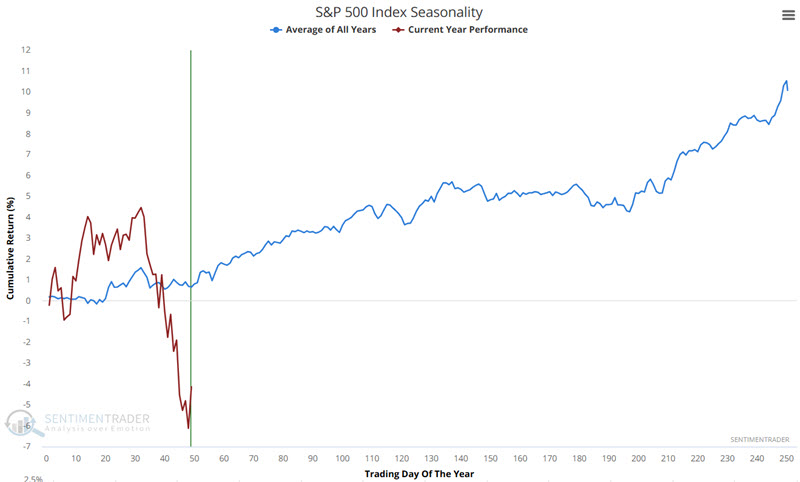
Jay noted that the S&P 500 is entering one of its most reliably favorable periods of the year.
The chart below shows the annual seasonal trend, with price action for the S&P 500 so far this year overlaid. Remember that the seasonal chart is more about direction than price magnitude. In the broadest sense, stocks have followed their seasonal tendencies so far-i.e., strength through Trading Day of Year (TDY) #32 and weakness into TDY #49.
The annual seasonal trend shows an upward bias from Trading Day #49 through TDY #75. For 2025, this period extends from the close on 2025-03-14 through 2025-04-22. The chart below displays the hypothetical growth of $1 invested in SPX only during these windows every year since 1953.
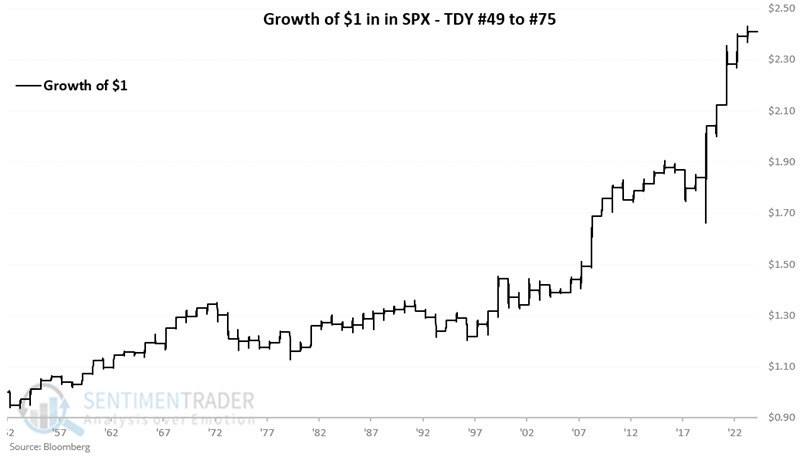
The windows showed a gain 71% of the time. More impressively, the S&P gained more than +6% during nine years while losing more than -6% only once.
Many bulls already left (or say they did)
The S&P 500 has rebounded well after falling -10% from its peak. It should be further encouraging that the rebound may have significantly more to go since so many bulls already ran for the exits.
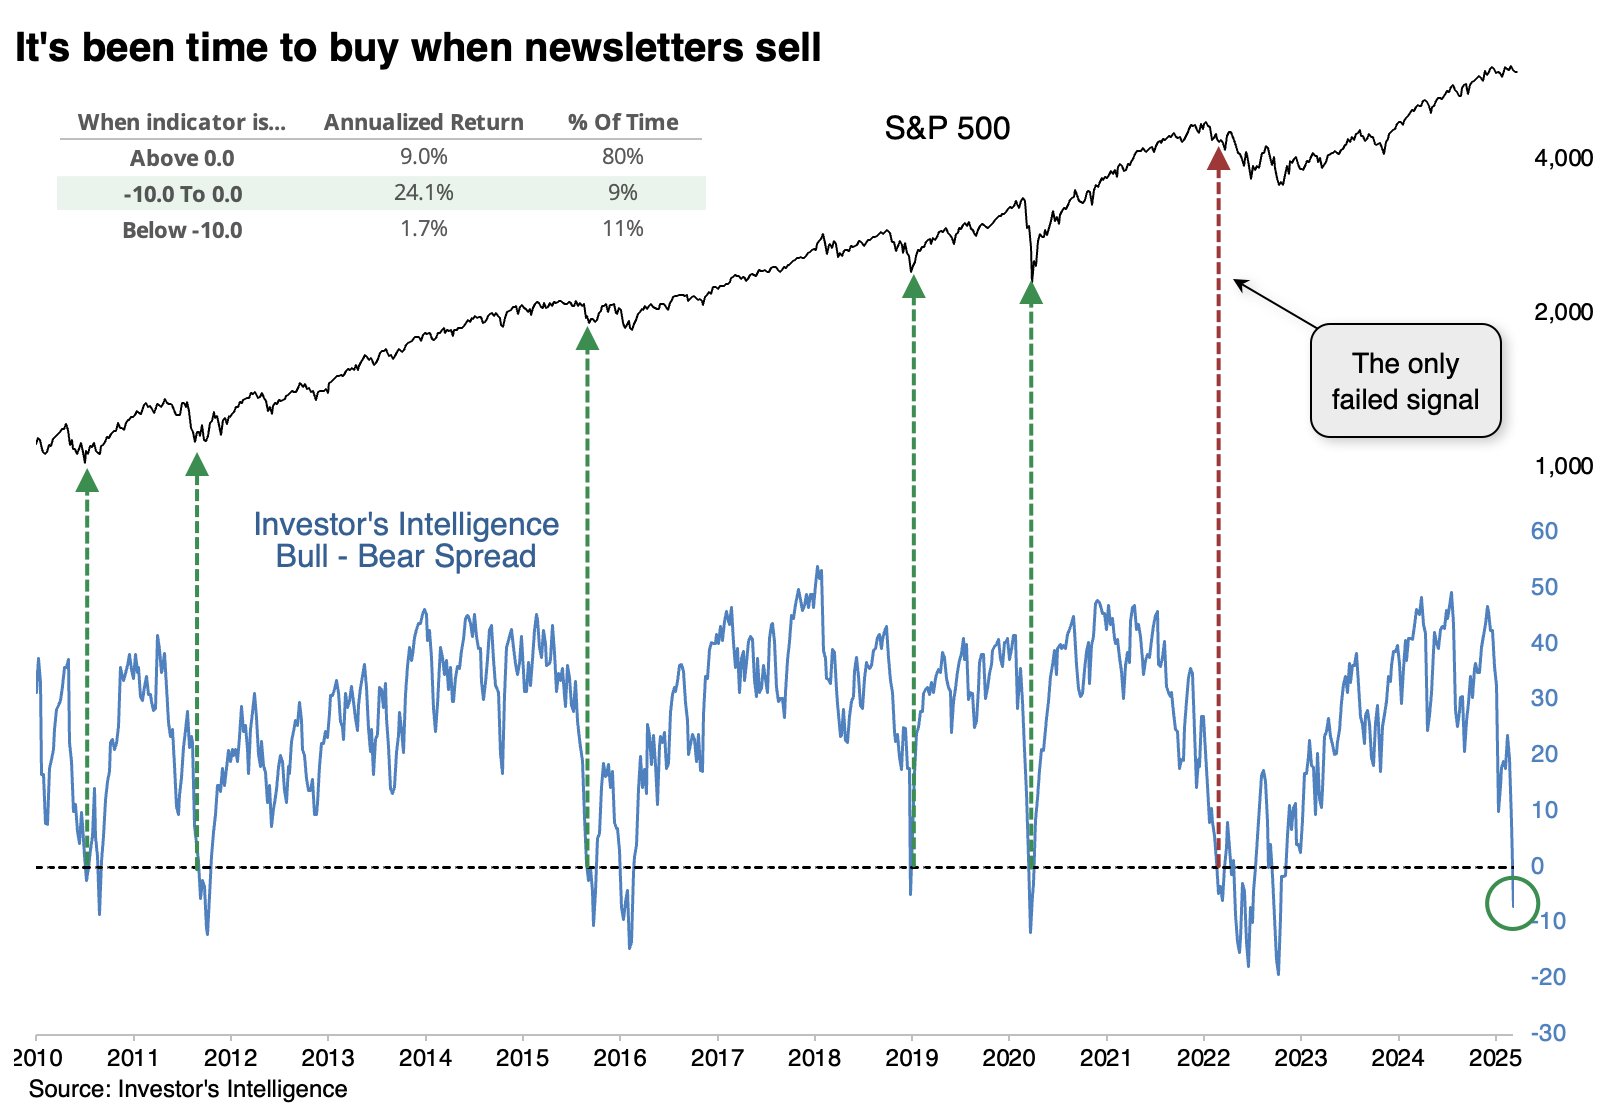
The granddaddy of sentiment surveys, Investor's Intelligence, noted last week that there were fewer bulls than bears among the newsletters they poll. When the spread is mildly negative, the S&P's annualized return is an excellent +24.1% because we typically get only mild net bearish readings during bull markets.
The table below shows how the S&P 500 fared after bears outnumbered bulls for the first time in at least a year. The S&P enjoyed a positive return either one or two months later after 13 of the 14 signals.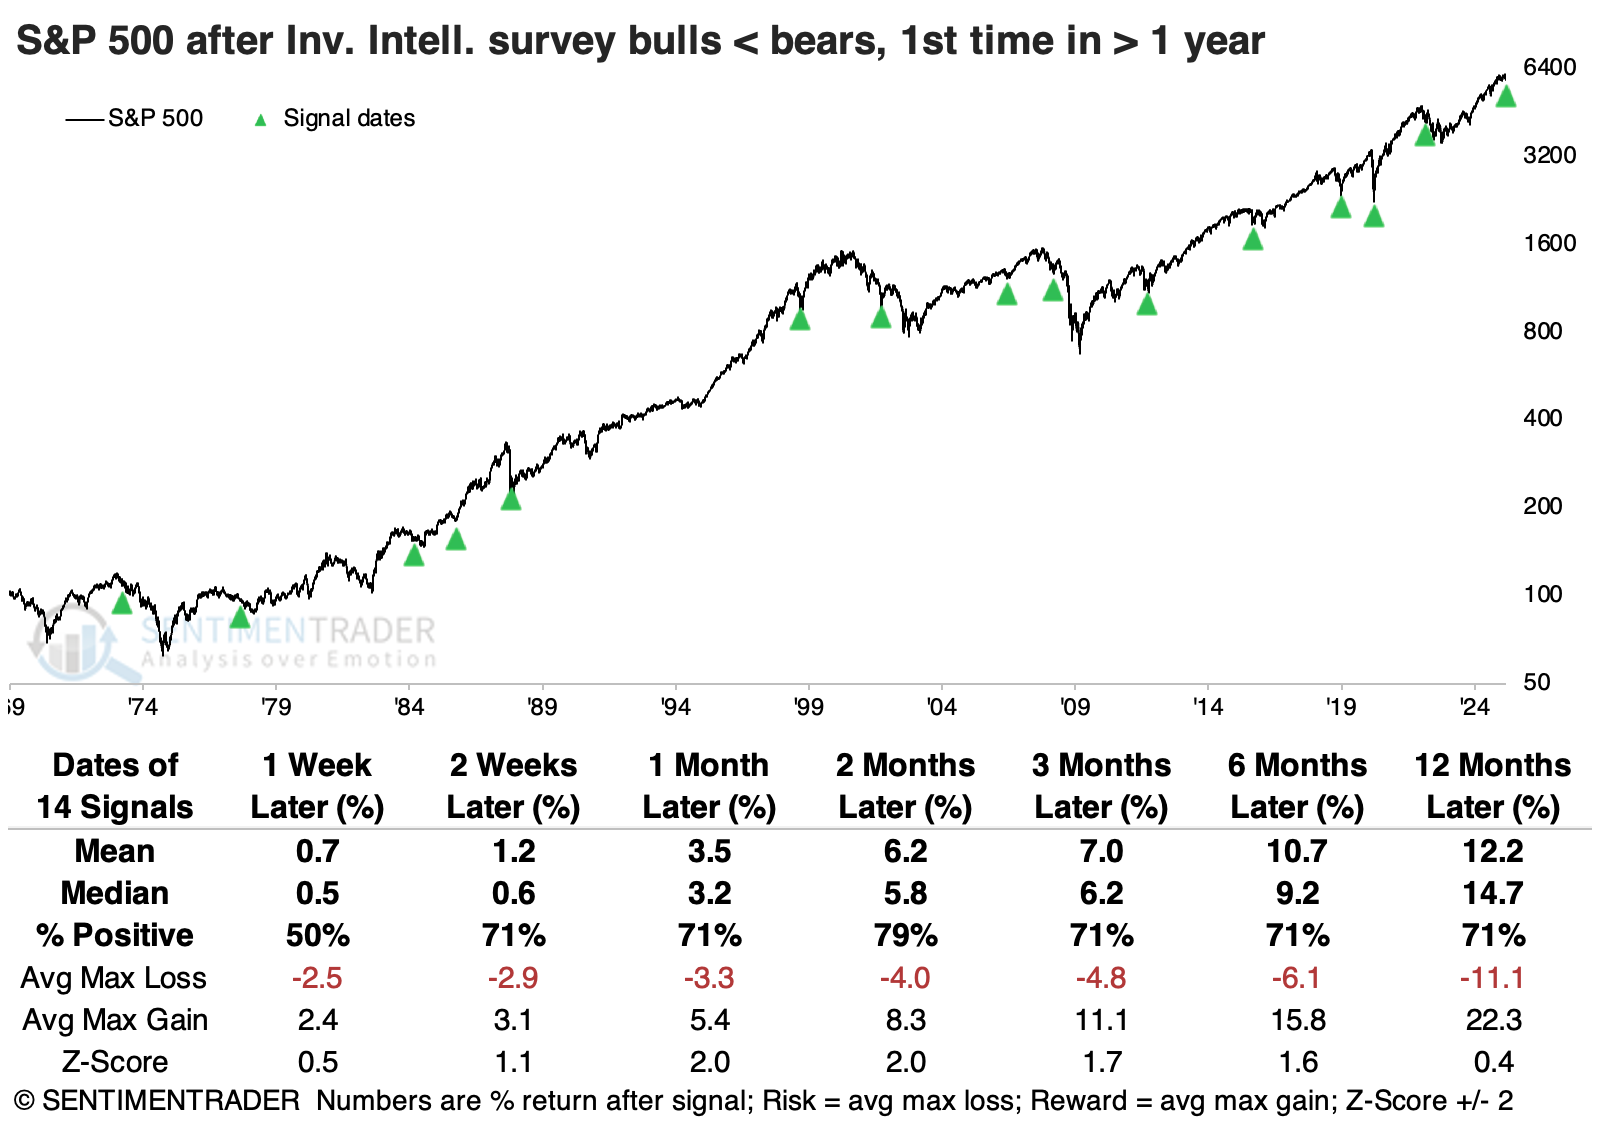 A handful of surveys go into the AIM Model, which has understandably cratered in recent weeks. The model had been showing that well more than 80% of investors were bullish, and that plunged to less than 5%. According to Backtest Engine 2.0, that preceded decent rebounds in the S&P 500 over the next two months, with only two minuscule losses.
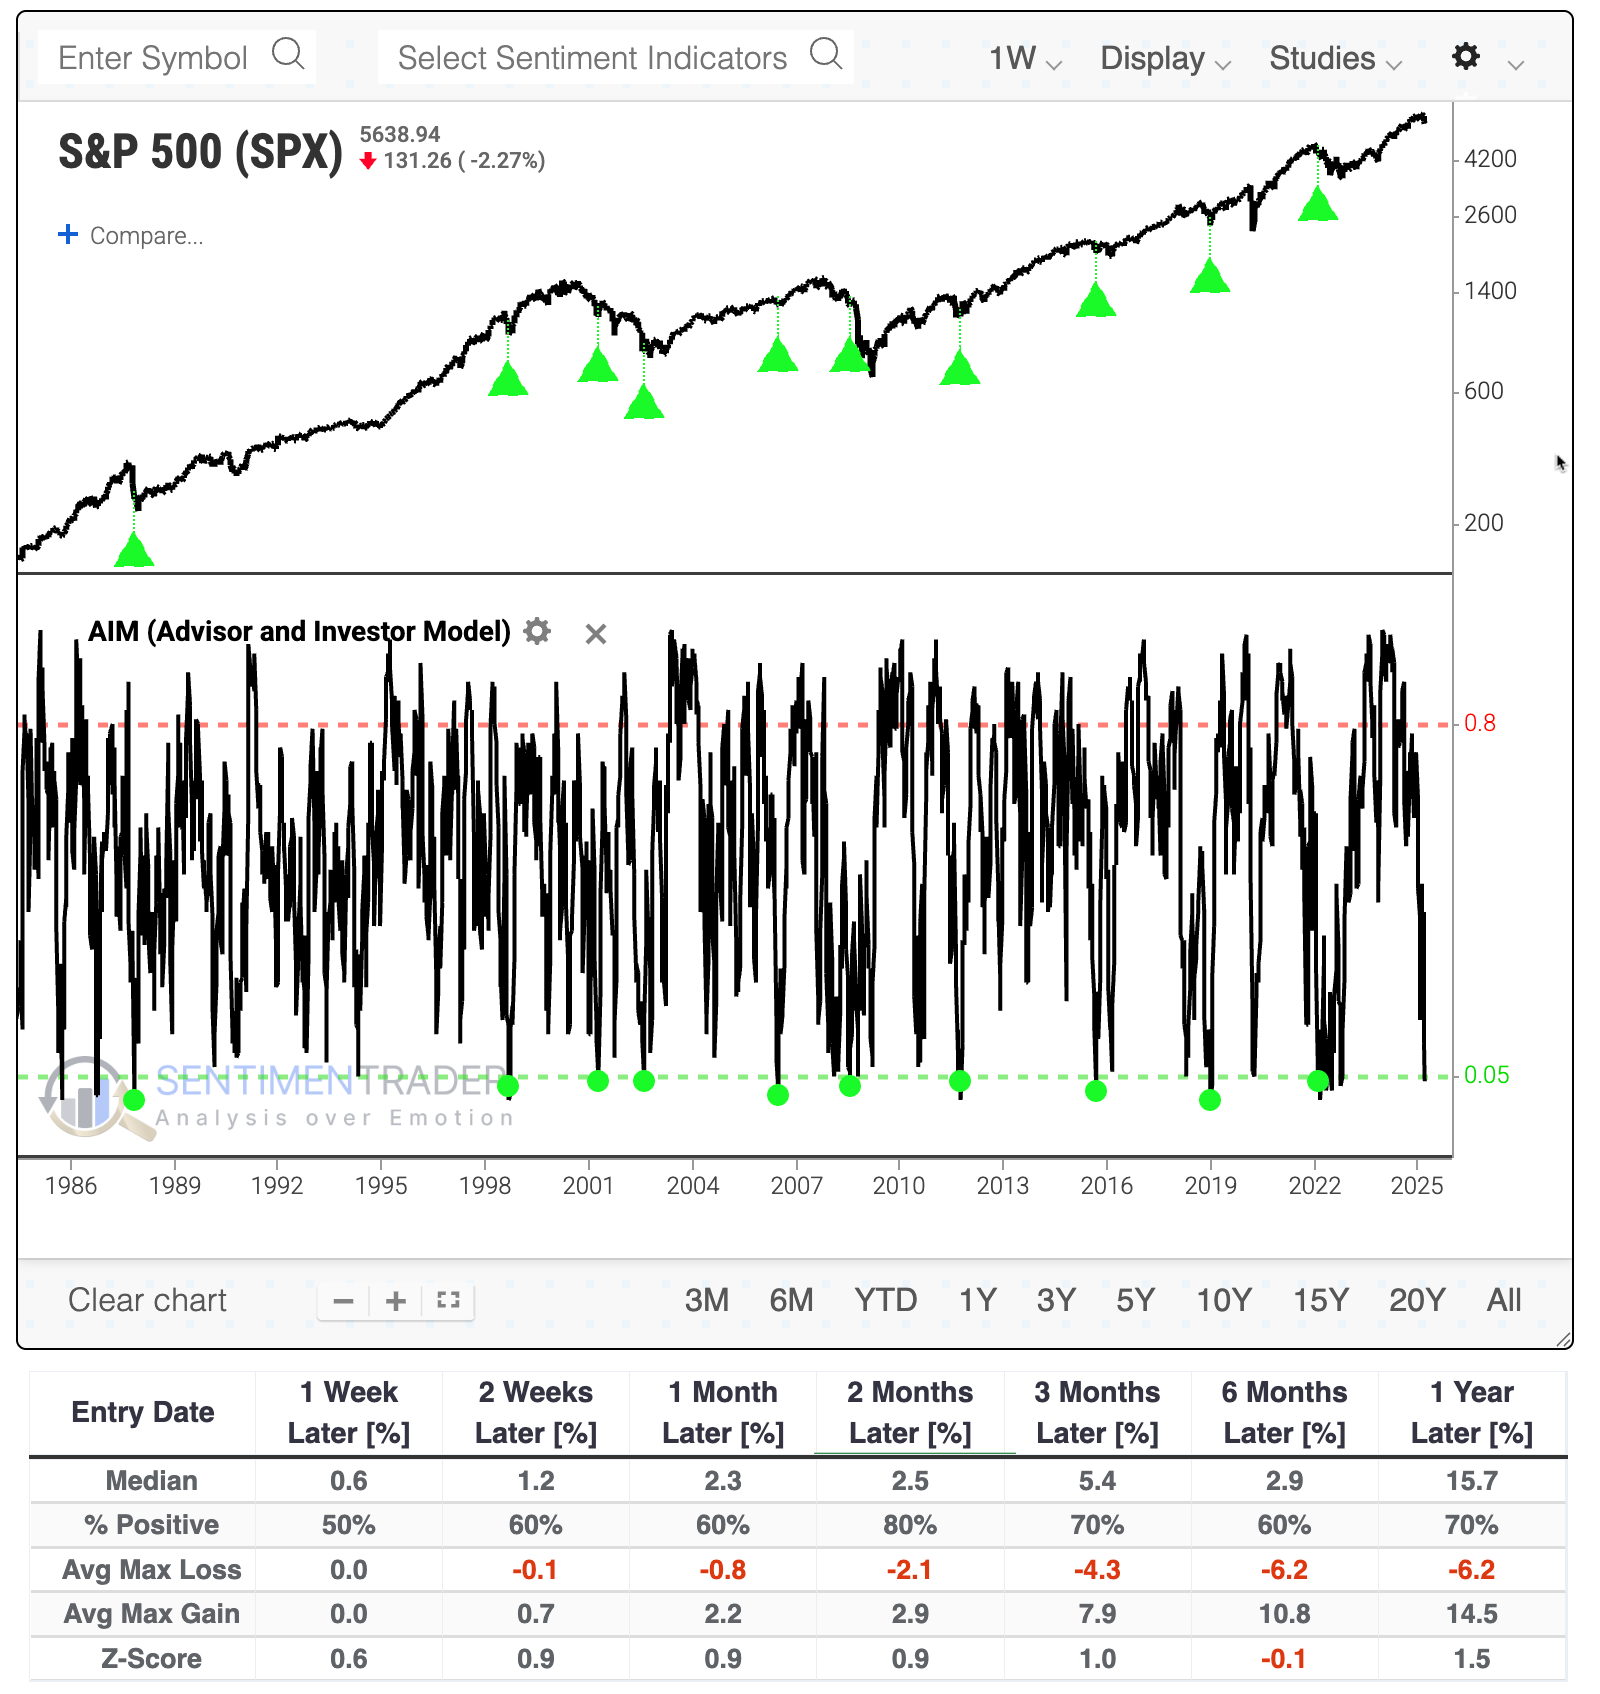
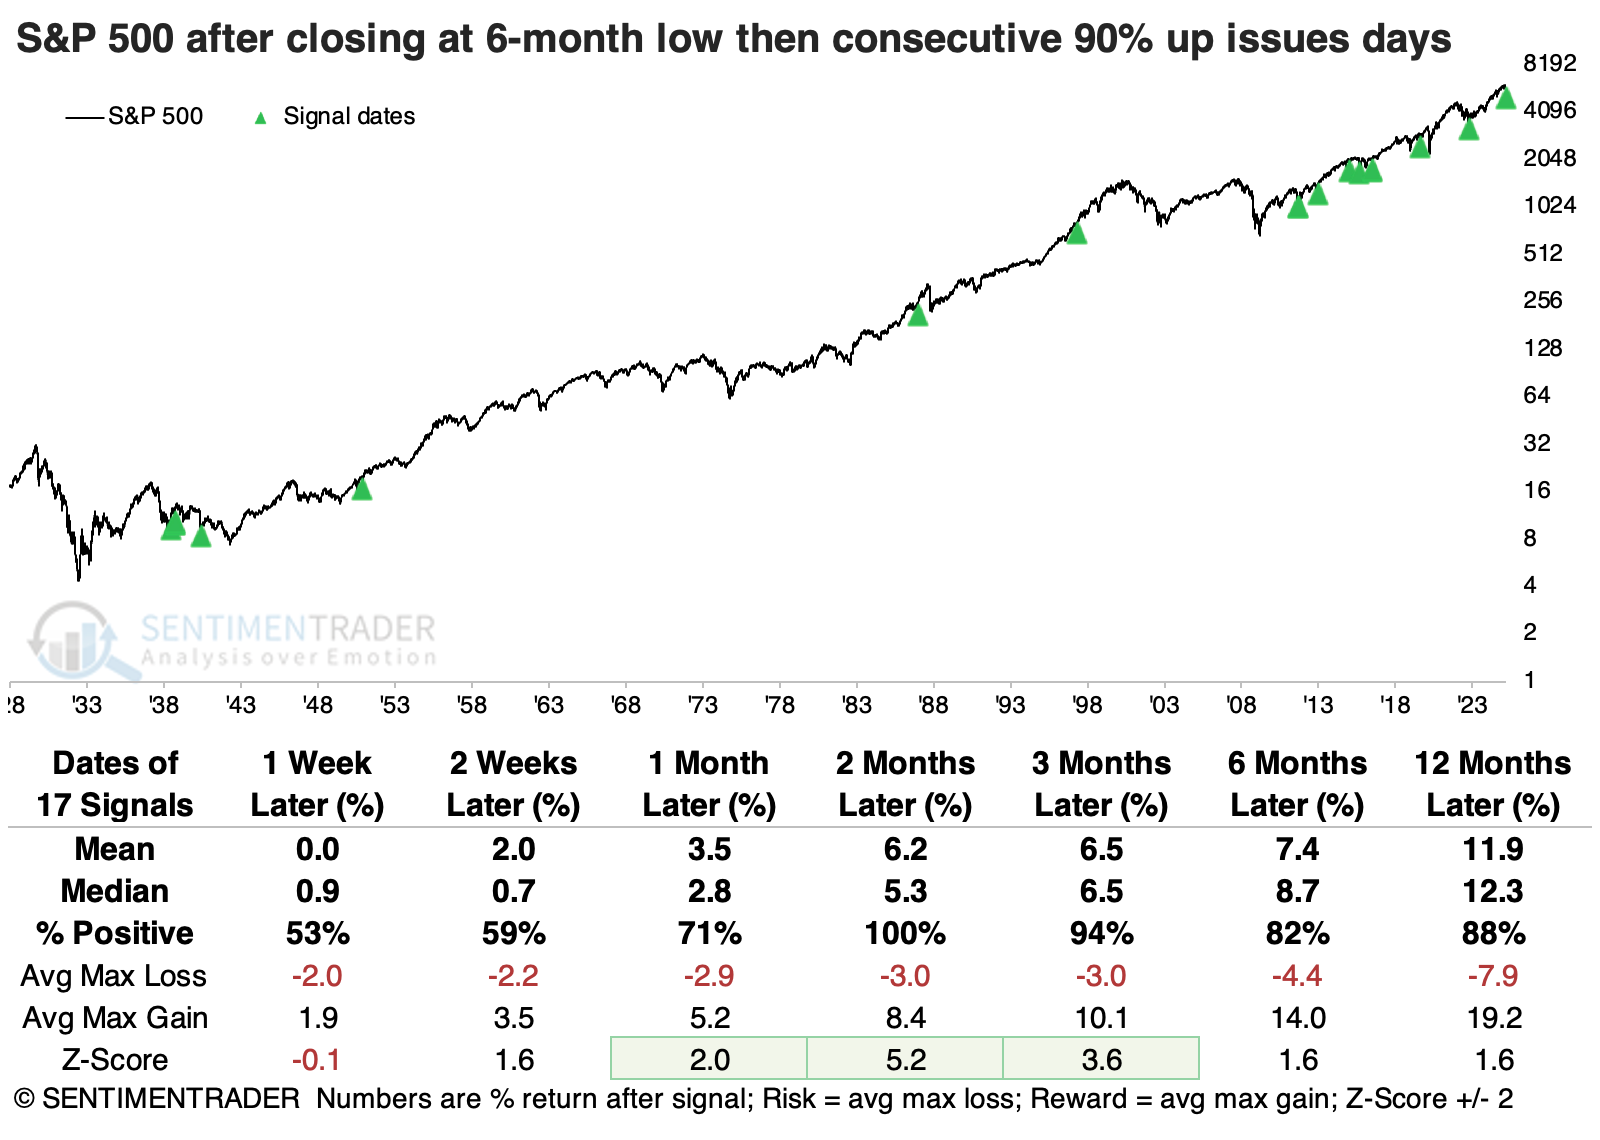
Already, they have shown signs of storming back after more than 90% of stocks in the S&P 500 advanced on back-to-back sessions after the index had set a 6-month low. That has been a reliable sign that more gains were in store.
Gold soars vs. stocks
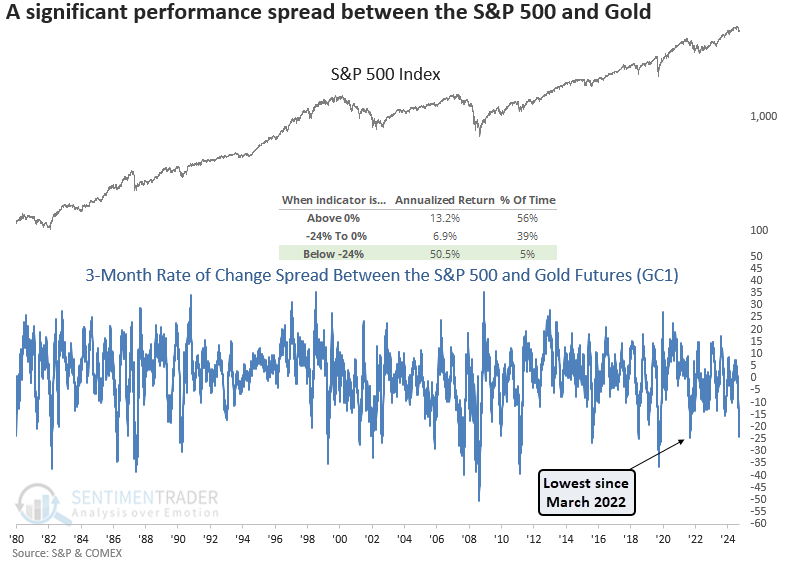
The 3-month rate of change spread between the S&P 500 and gold futures plunged below -24%. Dean showed that comparable performance gaps indicate that stocks might rebound in the coming months. Should stocks rally, gold is likely to face challenges over the next few months.
As shown in the chart below, a spread reading below -24% has occurred only 5% of the time since 1970 and has typically led to significant up days, resulting in an annualized S&P 500 return of 50%.
Whenever the 3-month rate of change spread between the S&P 500 and gold futures dropped below -24%, the world's most benchmark equity index displayed a slightly unfavorable outlook over the subsequent few weeks. However, once the dust settled, the large-cap index rallied 65% of the time over the next two months.
The precious metal was likely to face pressure over the first few months, suggesting that traders were less inclined to maintain positions in a safe-haven asset like gold. It's worth noting that since gold's peak in 1980, both returns and win rates have significantly underperformed compared to the period before, when the precious metal was in a bubble.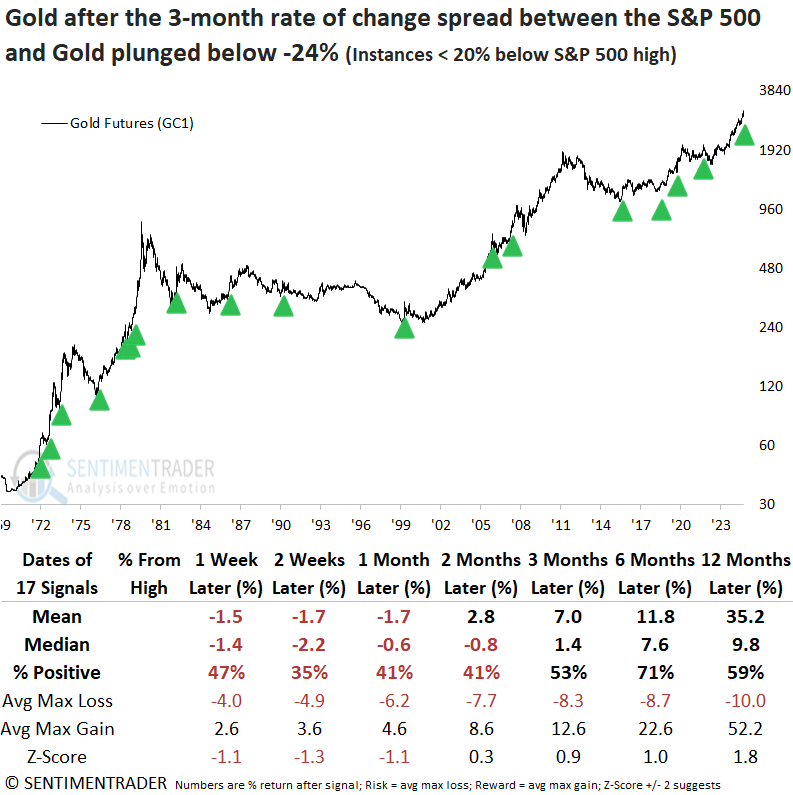
Gold's 4-year cycle
Gold has demonstrated a history of surprising cyclicality in price movement. Jay noted that one cycle suggests that investors should give gold the benefit of the doubt over the next four years.
Many investors are familiar with the stock market's four-year cycle or "Election Cycle." Whereas the stock market tends to exhibit strength or weakness during specific times within each four-year cycle, gold tends to treat each alternating four-year period differently.
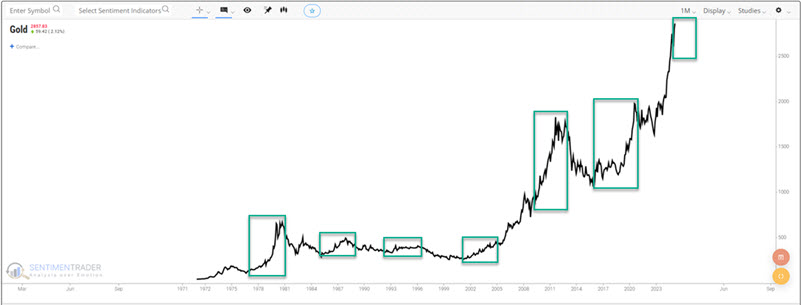
We will designate each successive four-year period as "Favorable" and then "Unfavorable." So 12/31/1976 to 12/31/1980 is deemed "favorable," and 12/31/1980 to 12/31/1984 is considered "unfavorable." And so on. The chart below highlights the "favorable" four-year periods since 1976 in green.
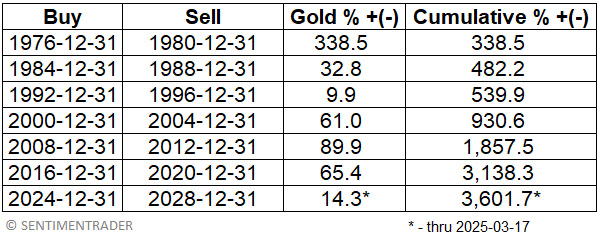
The table below displays the four-year return for gold during each "favorable" 4-year period and the cumulative % +(-) for gold combined during all favorable four-year periods.
The chart below displays the hypothetical cumulative growth of $1 invested in gold bullion only during the 4-year periods listed in the table above.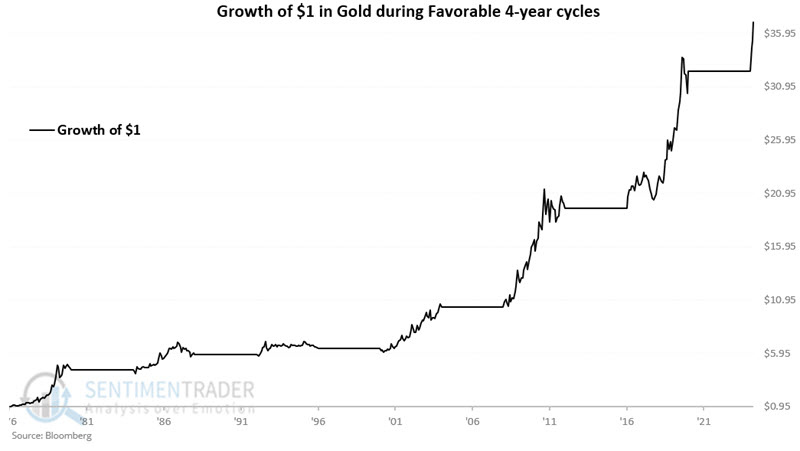
The chart below displays the hypothetical cumulative growth of $1 invested in gold bullion only during the unfavorable 4-year periods. This is not " straight-line bearish," but it is a far cry from the much more consistent gains in previous favorable periods.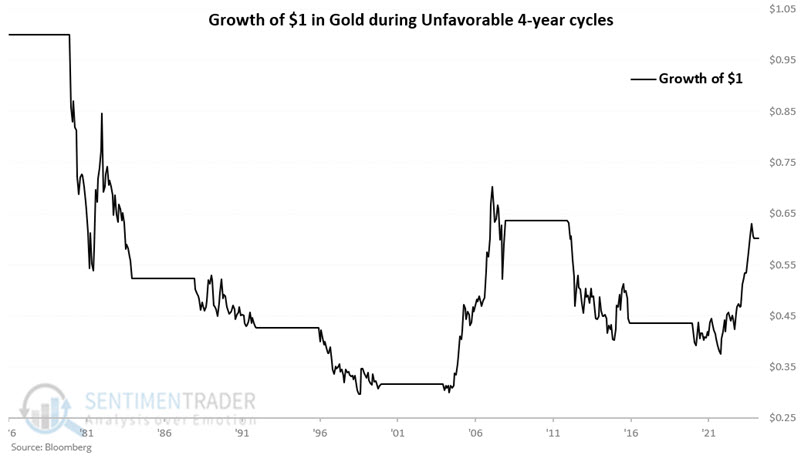
Keeping an eye on gas prices
Unleaded gas futures have traded sideways to higher for months. In the meantime, Jay noted that seasonality, sentiment, and smart money indicators still favor higher prices for unleaded gas futures.
The chart below displays the hypothetical dollar return from holding a long position in Unleaded Gas futures from the end of Trading Day of the Year (TDY) #53 through TDY #102 since 2006.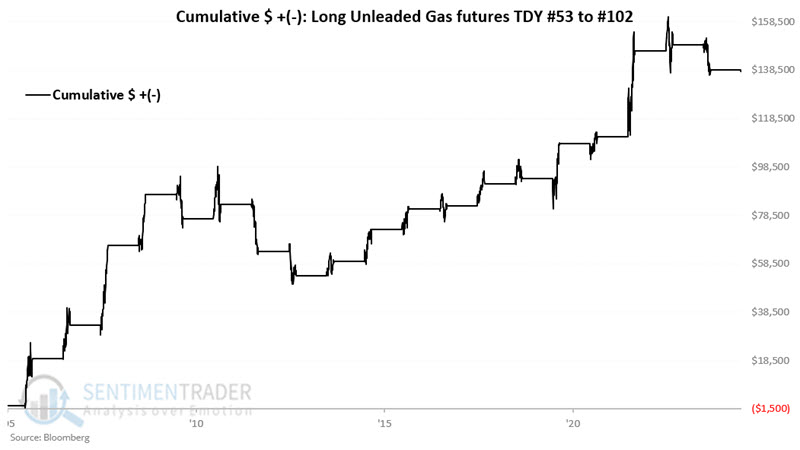
One crucial thing to note is that when unleaded gas falls (instead of rising) during this time of year, it tends to go down hard. Note the median loss over -$10K and a maximum loss over -19K. The bottom line: When this seasonal trend is wrong, it is usually very wrong.
Commercial hedgers are considered the "smart money" in the futures market. Interestingly, since unleaded gas futures started trading in 2005, commercial hedgers have never held a net long position. However, as the chart below shows, their position recently reached one of its highest recorded levels, which is considered favorable for unleaded gas futures.
The chart above highlights all dates when the Unleaded Gas Hedger's Position was at -24,000 or higher.
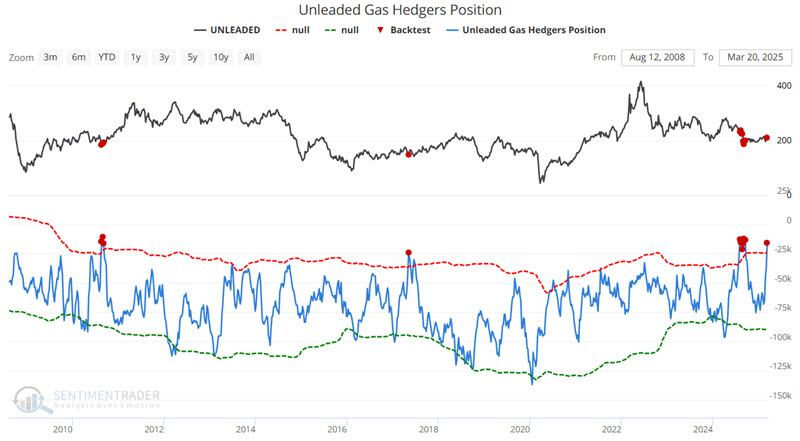
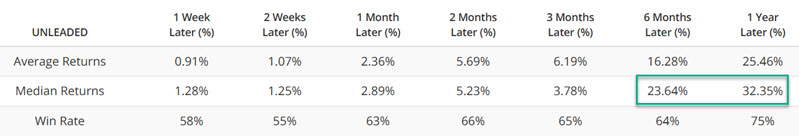
A 66% two-month Win Rate and a 75% 1-Year Win Rate means this is no sure thing. Still, the huge average and median return for six and twelve months suggests giving the bullish case the benefit of the doubt.
About TradingEdge Weekly...
The goal of TradingEdge Weekly is to summarize some of the research published to SentimenTrader over the past week. Sometimes there is a lot to digest, and this summary highlights the highest conviction or most compelling ideas we discussed. This is NOT the published research; rather, it pulls out some of the most relevant parts. It includes links to the published research for convenience, and if you don't subscribe to those products, it will present the options for access.