
TradingEdge Weekly for Mar 20 - S&P 500 base breakdown, credit default risk, sector breadth extremes, commodity seasonality

Key points:
- S&P 500 completes base breakdown pattern with 72% win rate when above 200-day MA
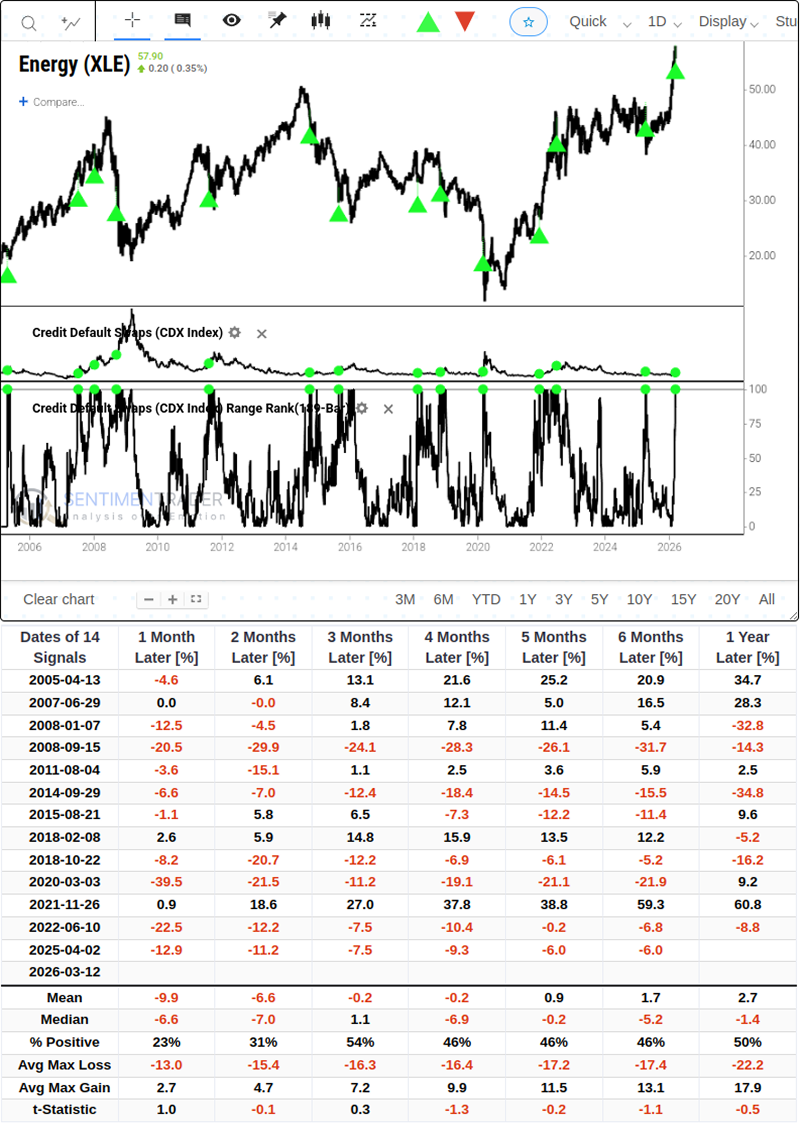
- Credit default swap prices spike to 9-month high, particularly concerning for Energy sector
- Consumer Discretionary sector sees 50% of stocks in bear market-historically bullish setup
- High-yield bonds, Healthcare and Industrial insiders flash favorable accumulation signals
- NYSE breadth negative for 7 straight sessions, suggesting near-term sluggishness
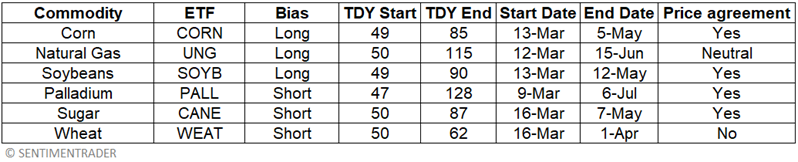
- Commodity seasonality: Corn, Natural Gas, Soybeans entering favorable periods; Palladium, Sugar, Wheat unfavorable
House view:
- Stocks:
- Short-term: Bearish. Currently, nearly all indicators are unfavorable, as detailed in the "Where we're at" section. U.S. equities suffer a historic technical breakdown, with the S&P 500, Dow Jones, and Nasdaq all breaching their 200-day moving averages in a rare "Triple Breach" event. Algorithmic trading triggers cascading stop-losses after the critical long-term bull/bear line is broken, with RSI and MACD confirming full bearish momentum. This time frame covers 1-4 weeks.
- Intermediate-term: Bearish. Market momentum continues to weaken and is now in a risk-off state. The stagflation trade deepens as Middle East supply shocks act as a tax on the global economy. High oil prices and elevated interest rates create a dual squeeze on corporate earnings, with market breadth deteriorating sharply. Short and medium-term moving averages have turned fully bearish across major indices, with downside momentum accelerating as investors flee risk assets. This time frame covers 1-5 months.
- Long-term: Bearish. The long-term uptrend has been invalidated by the decisive break below the 200-day moving average across all three major indices. The market has shifted definitively from buy-the-dip AI euphoria to extreme risk aversion. There is no long-term bullish edge until indices reclaim the 200-day MA with sustained volume and the stagflation risk backdrop abates. This time frame covers 6-12 months.
- Raise cash levels significantly and avoid bottom-fishing in the current technical vacuum
- Energy and inflation-hedge sectors are the only areas with relative outperformance in the stagflation regime
- Long-term opportunities in hard assets will emerge once the liquidity crisis and margin call cycle concludes
- Bonds: Long-term cycles remain bearish. The 10-year U.S. Treasury yield rises sharply despite the "Triple Breach" meltdown in equities, as investor fears of oil-driven inflation overwhelm flight-to-safety demand. The 10Y-2Y spread holds at +46 bps, with the curve pricing in entrenched stagflation risks.
- Commodities: Extreme volatility and forced liquidation dominate the complex amid a global liquidity crunch. WTI crude holds a neutral view as markets tug-of-war between Middle East supply disruption risks and demand destruction from a global recession. Gold and silver are firmly bearish, with gold plunging to $4,650 and silver to $73. Both are hit by indiscriminate selling as institutions liquidate the most liquid assets to meet margin calls on equity positions. Gold prices remain highly volatile at present, and further selling pressure may emerge in the short term. Investors are advised not to rush into the market to buy at the bottom until volatility begins to subside and prices stabilize.
- Notable Moves in Global Markets:
- Europe: The STOXX 600 crashes 2.39% to 583.64, with the DAX down 2.82% and CAC 40 down 2.03%. The ECB and Bank of England both hold rates steady, trapped between resurgent inflation from soaring energy prices and a stagnating economy. The region's total reliance on energy imports leaves it as the global stagflation epicenter, with energy-sensitive sectors leading the broad-based selloff.
- Japan: The Nikkei 225 plummets 3.38% to 53,372.53, shedding over 1800 points in a single session. The island nation's extreme dependence on Middle Eastern energy imports leaves its economy acutely vulnerable to the oil price shock, with the BOJ warning of imported inflation while holding rates steady. Foreign investors dump highly leveraged Japanese equities en masse amid the dual pressure of rising costs and policy paralysis.
Where we're at
Most investors have the most riding on equities. We feel that the most significant determinants of success for investors are whether to adjust their allocation to that asset class based on factors that have historically had a good record of preceding above- or below-random returns in the months ahead.
Those factors include the probability of a looming recession, sentiment, price action, volatility, breadth, and the bond market. The chart below summarizes the main indicators and composite models we watch for those factors, and they're mostly in bullish regimes. Valuations are not part of these factors since the relationship has been too inconsistent on time frames under one year.
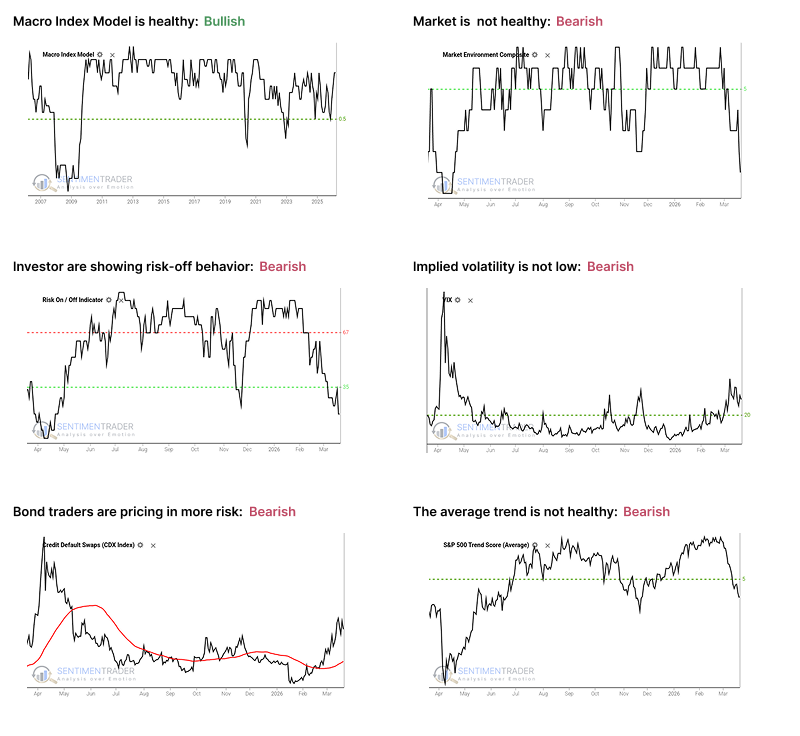
- The Macro Index Model is above the 50% threshold, which has been a vital level as outlined here.
- The Market Environment has been skittish since April, and has slipped into an unhealthy condition. Future returns, especially for higher-beta indices, have historically been notably weaker, with greater risk, when the environment is unhealthy as outlined here.
- The Risk On / Off Indicator shows that investors are now in risk-off mode. This has historically been a warning sign for weak future returns as outlined here.
- Implied volatility is at or above 20, signaling a volatile environment. The S&P 500 has historically performed poorly when this is the case, as outlined here.
- Credit default swap spreads are above their 50-day moving average, which is modestly concerning as outlined here.
- A composite of trend measures in the average S&P 500 stock have dropped below 5, which shows weak trend conditions.
S&P 500 base breakdown signals pullback end, not bear market start
Last week, the S&P 500 Index continued its decline, hitting a 3-month low but falling short of a 4-month low, effectively completing a topping pattern. The question is whether this pattern is a sign of a more profound structural breakdown or just a standard pullback within an ongoing uptrend.
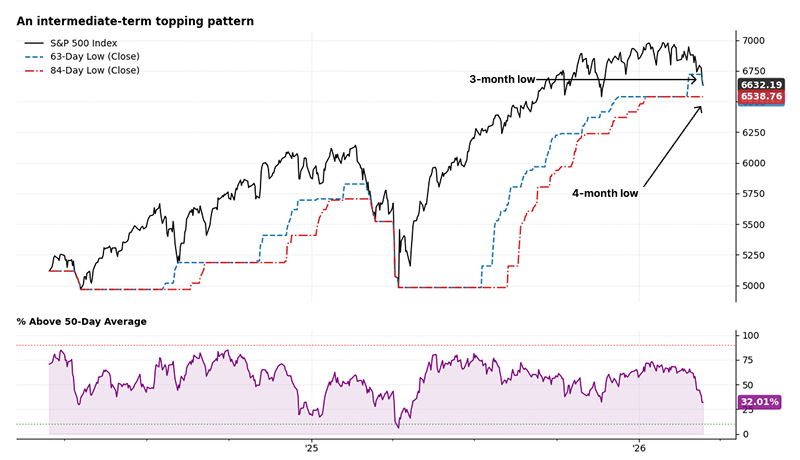
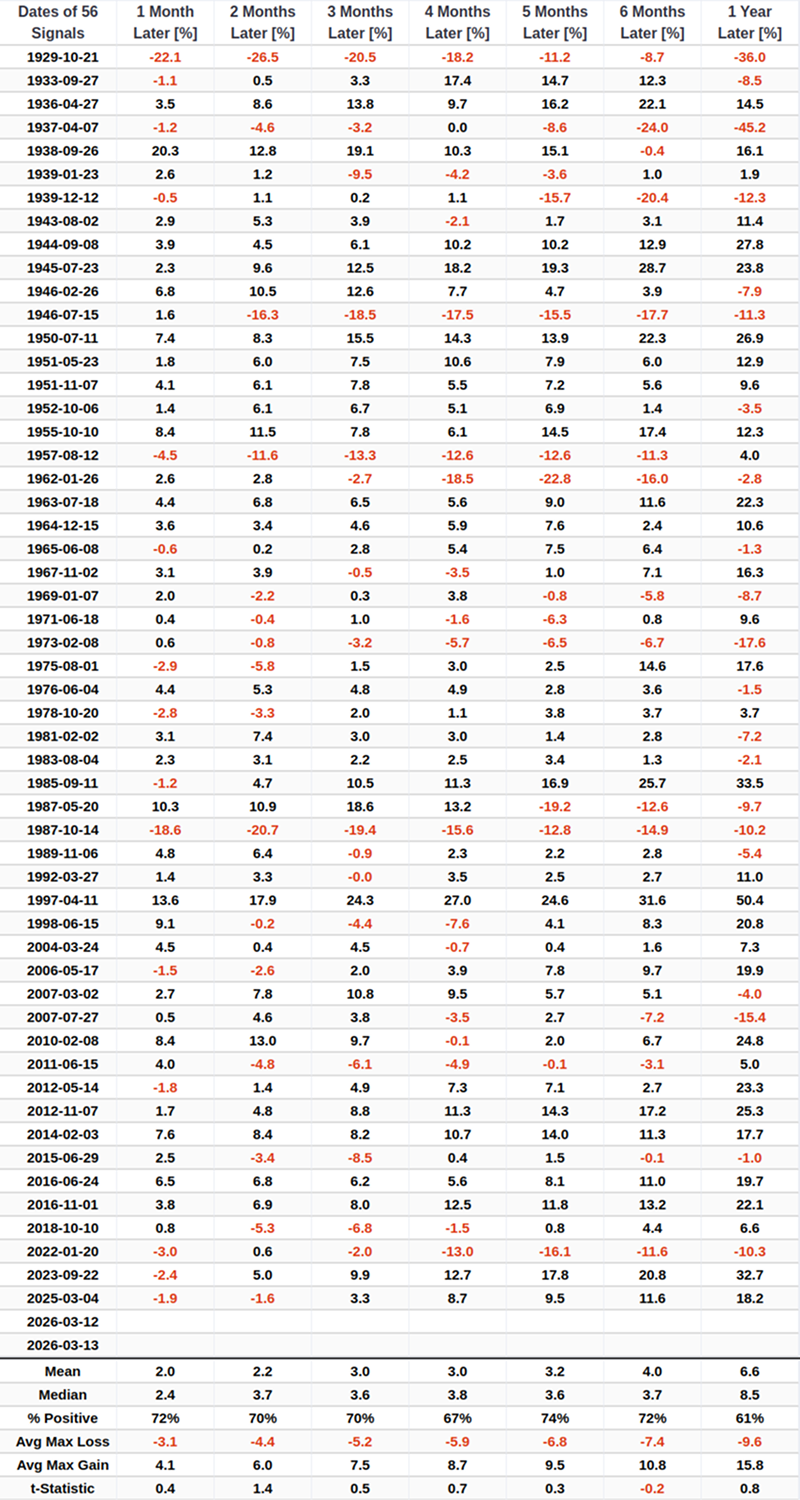
When the S&P 500 closes at a 3-month low (but not a 4-month low) while remaining above its 200-day moving average, this type of decline is often closer to the tail end of a corrective phase rather than the beginning of a new bear market. One month later, the S&P 500 has a 72% probability of rising, with a median gain of 2.4%. For related backtest, click here.
It is worth noting that the long-term uptrend hangs in the balance, with the S&P 500 now within striking distance of its 200-day moving average (~6,604). A decisive break below this level would invalidate the long-term bullish structure, while a hold could offer a floor for a potential rebound.
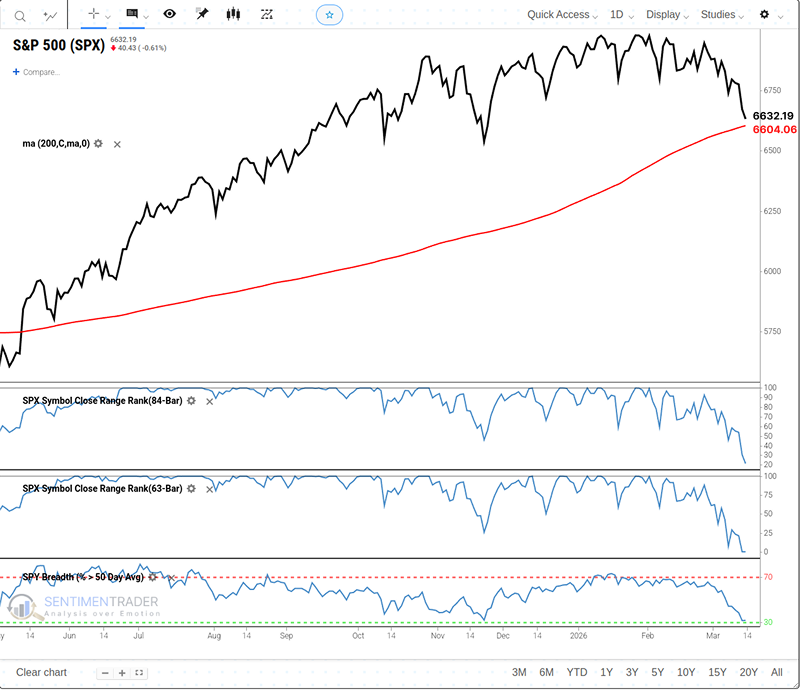
If the S&P 500 closes at a 3-month low (but not a 4-month low) and is below its 200-day moving average, the decline tends to persist. Under these conditions, the forward returns and win rates for the S&P 500 are expected to be relatively weak compared to when the index is trading above its 200-day moving average.
Consumer Discretionary bear market washout creates asymmetric opportunity
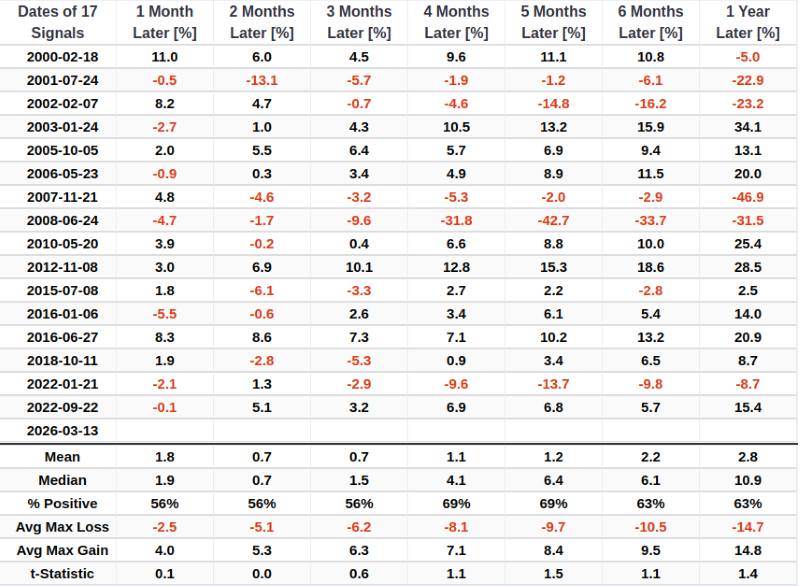
The percentage of Consumer Discretionary stocks within the S&P 500 that have entered a bear market (defined as a 20% decline from a 252-day high) has crossed above 50% for the 30th time in over 20 years. The last time this signal triggered was on Nov 20, 2025, and XLY rallied by more than 10% over the following month.
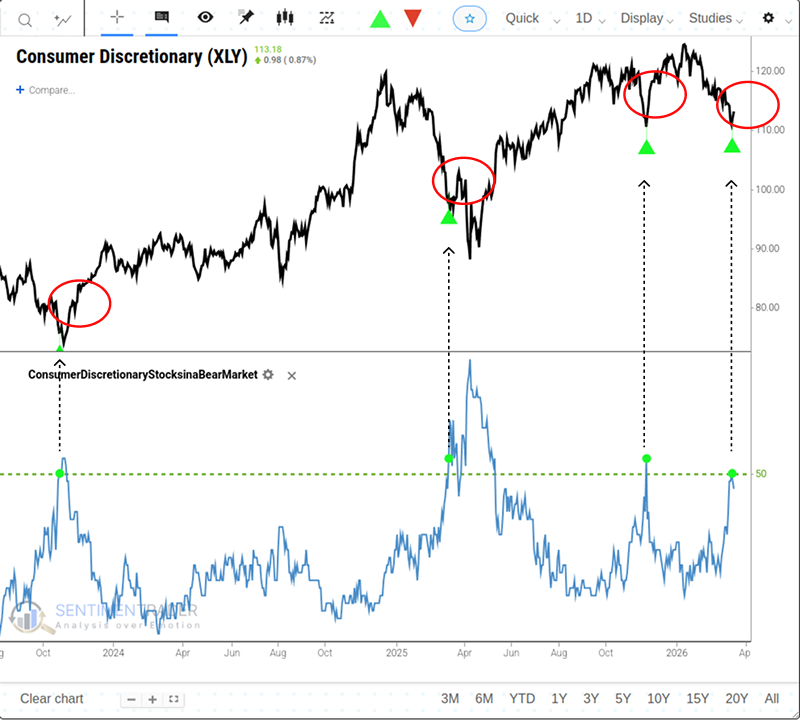
When the proportion of Consumer Discretionary stocks in a bear market cycle rises to 50% or higher, the Consumer Discretionary sector has performed exceptionally well over the next 12 months. For related backtest, click here.
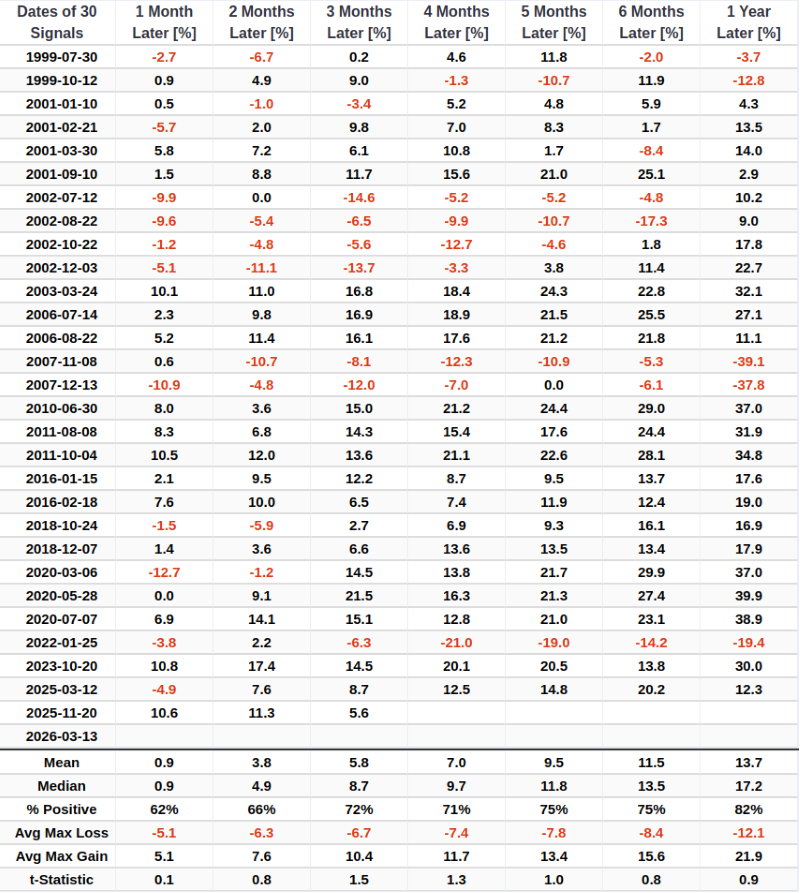
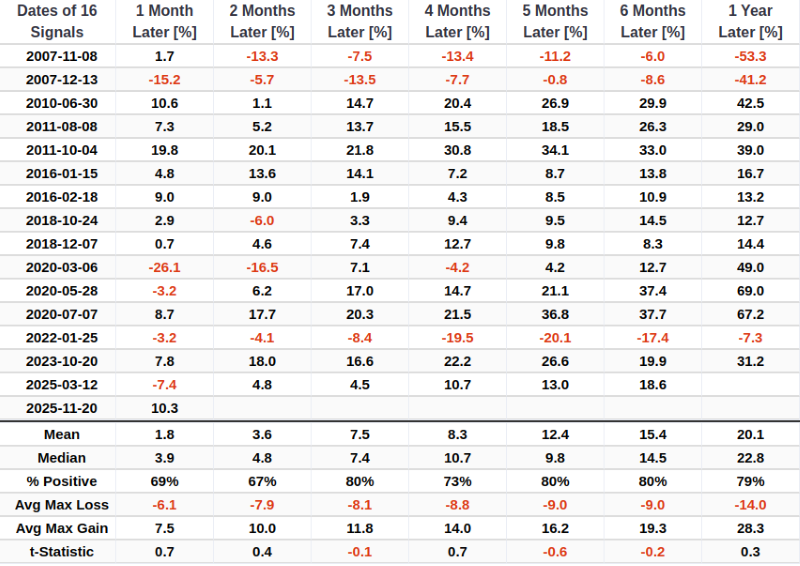
With the advent of ETFs, investing in a basket of stocks to capitalize on historical trends is more convenient and cost-effective than ever. Assuming the pessimism in consumer discretionary stocks signals that the bear market is over, investors might consider investing in the Invesco S&P 500 Equal Weight Consumer Discretionary ETF (RSPD) rather than the cap-weighted discretionary ETF (XLY). As the table illustrates, the equal-weight consumer discretionary sector tends to outperform and generate higher returns than its market-cap-weighted counterpart following these events.
Credit default risk spikes, Energy sector most vulnerable
One of the main drivers of the rise in stock prices this year has been loose financial conditions. As those concerns rose, traders bought protection against bond defaults. Prices rise when traders scramble for protection, which we can see in the spike in credit default swaps. The chart below shows that the price of CDS protection notched a 9-month high last week (100% of its 189-day range).
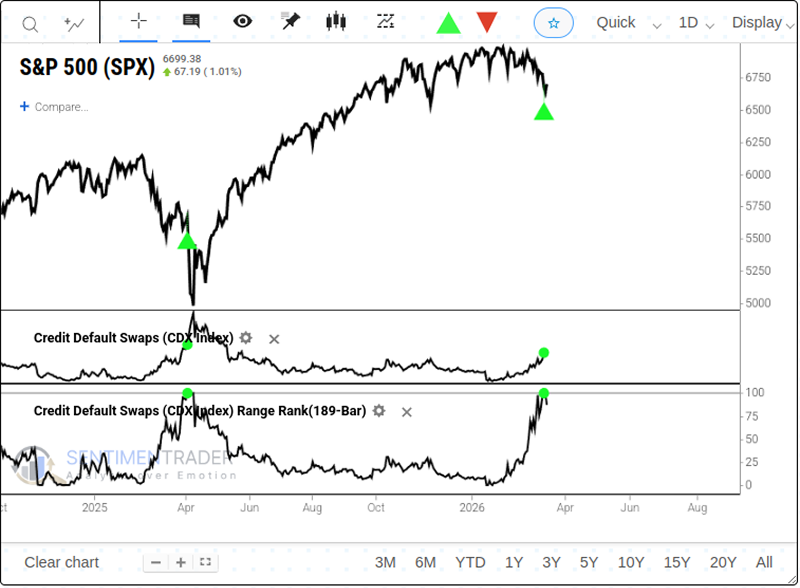
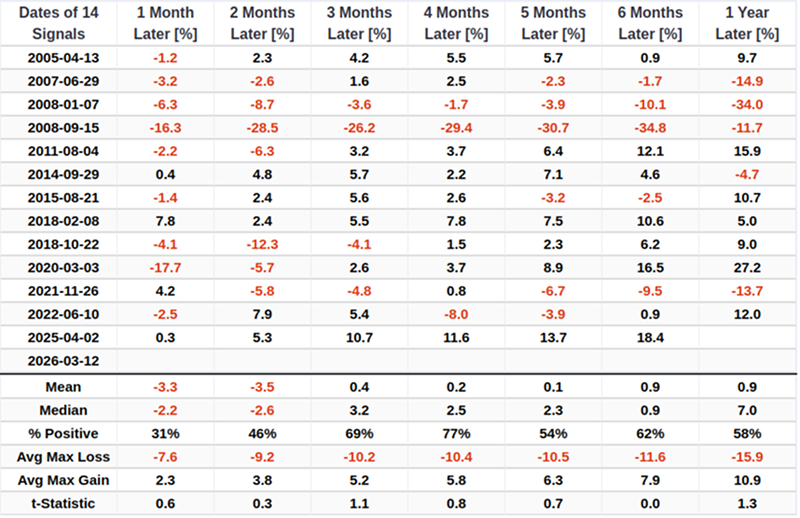
Over the following one month, the S&P 500 was relatively weak, with only a 31% win rate and a negative median return. Even a year later, the average max risk outweighed the average max reward.
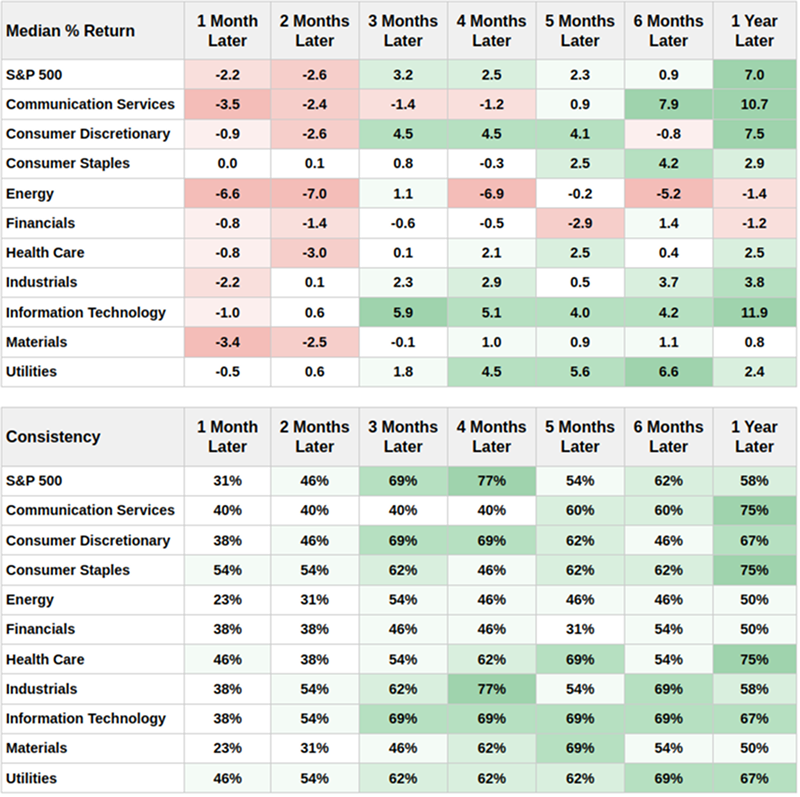
If you use Backtest Engine 2.0 to run this test (click here to load it and then click the Run Backtest button), you can use the Major Sectors tab to see how specific sectors reacted to these jumps in default protection. The next couple of months showed weak returns across the board, except for the defensive utilities sector. Worst of all were the Energy, with negative average returns and poor win rates over the short-to-medium-term.
If we go back to the test and see how the XLE fund performed after these signals, we can get a clearer picture of how investors treated these stocks after they grew concerned about rising defaults. The data shows that XLE struggled after 13 signals. In the 2-3 months test, its win rate was only about 20-30%. Over the next month, the average maximum loss of -13% was more than 4 times the average reward of 2.7%, which is not something we often see.
High-yield bonds and sector insiders flash accumulation signals
High-yield bonds have a much higher correlation to stocks than to treasury bonds. The High-Yield McClellan Oscillator recently bounced off an extremely oversold level. This has historically been a favorable sign for stocks. The chart below shows all dates when the High-Yield McClellan Oscillator crossed above -88 for the first time in a month. The most recent signal occurred on March 16th.
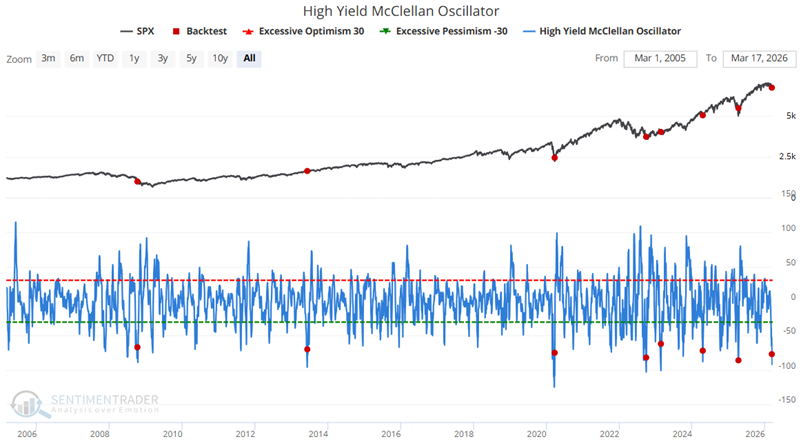
The table below summarizes subsequent performance for the S&P 500 Index.
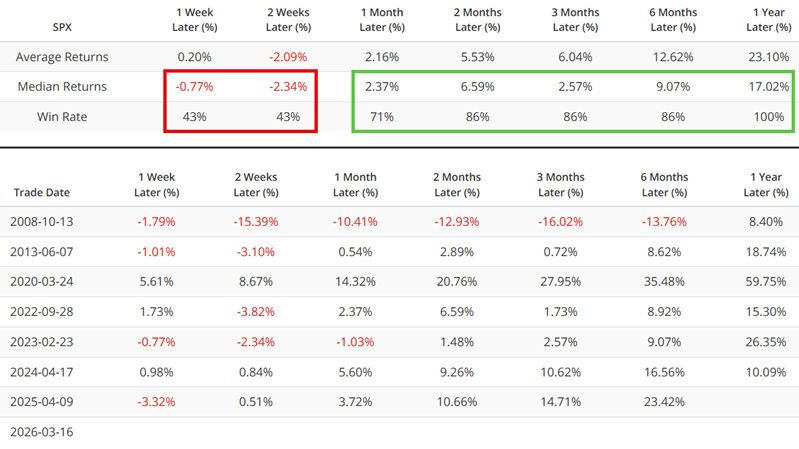
History shows that the S&P tends to show initial weakness. However, the Win Rate for 2 months to 12 months has ranged from 86% to 100%.
The Healthcare sector has been a top performer since bottoming in August of 2025. In the past 13 months, sector insiders have been aggressively 'loading up,' aggressively buying their own shares in the open market with their own money, as reflected in the chart below.
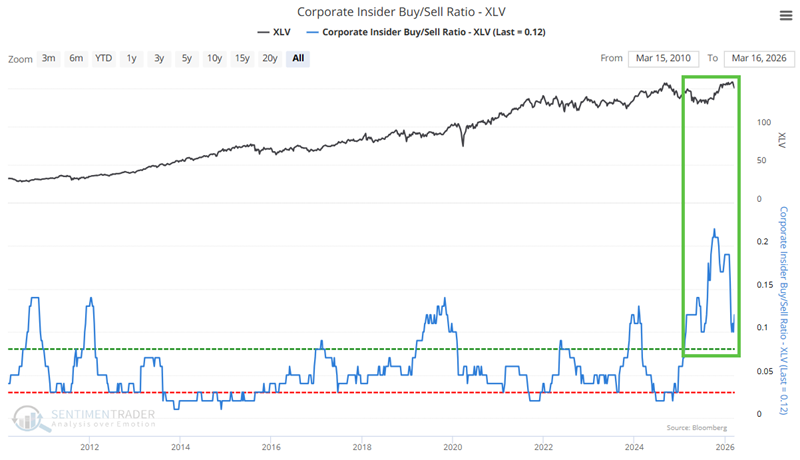
It is important to note that insiders are often early buyers. However, over holding periods of one year or more, they are rarely wrong when they act en masse. The chart below shows all weeks when the 10-week average for the Corporate Insider Buy/Sell Ratio - XLV indicator was above 0.12. What we see is the largest and longest period of insider accumulation in this sector in the last 15 years.
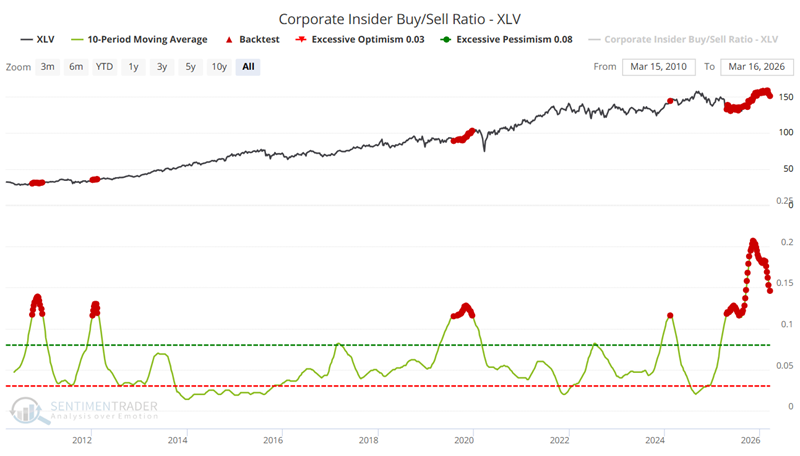
The table below summarizes the results.

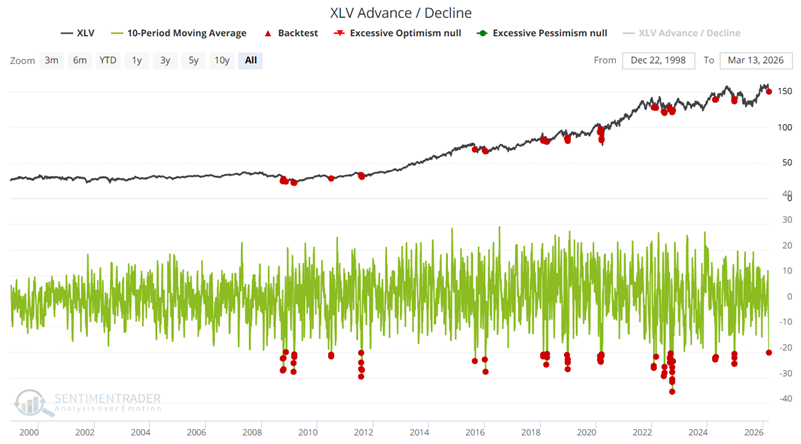
Our XLV Advance/Decline indicator shows the number of stocks in the State Street Health Care Select Sector SPDR ETF (XLV) that advanced minus declined on the day. The chart below shows all dates when the 10-day average of our XLV Advance/Decline indicator was below -20. The most recent signal occurred on March 16th.
The table below summarizes the subsequent performance for ticker XLV.

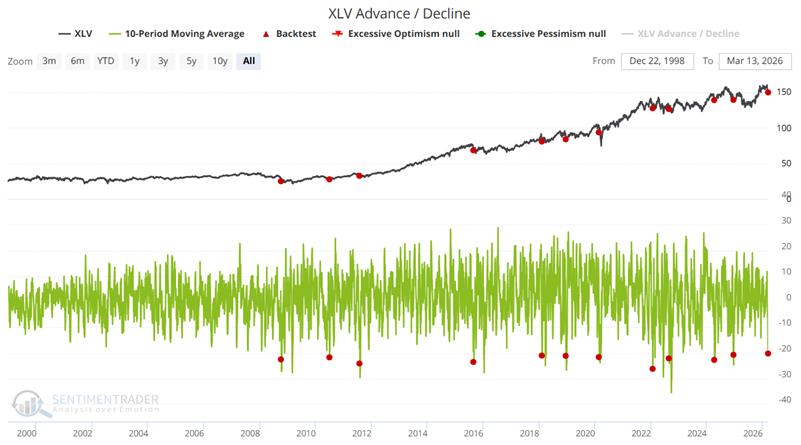
For the next test, we will remove many overlapping signals by considering only those times when the 10-day average fell below -20 for the first time in the last 6 months.
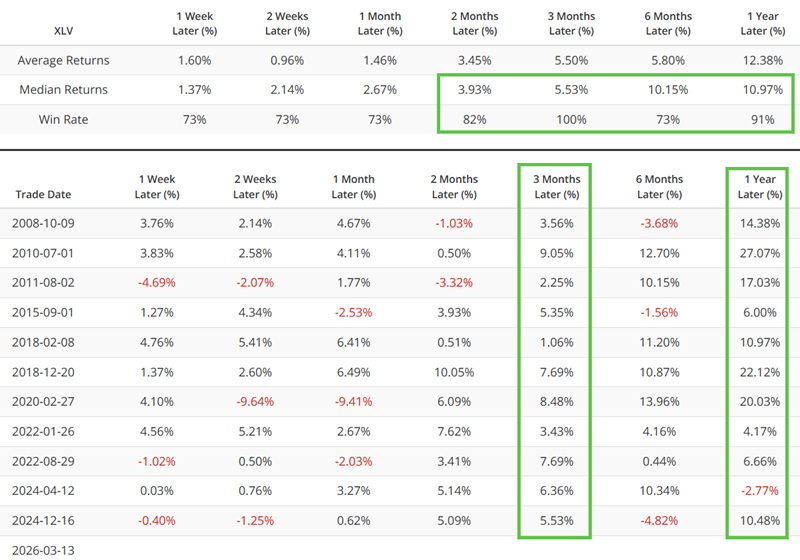
The table below summarizes the subsequent performance for ticker XLV following these signals.
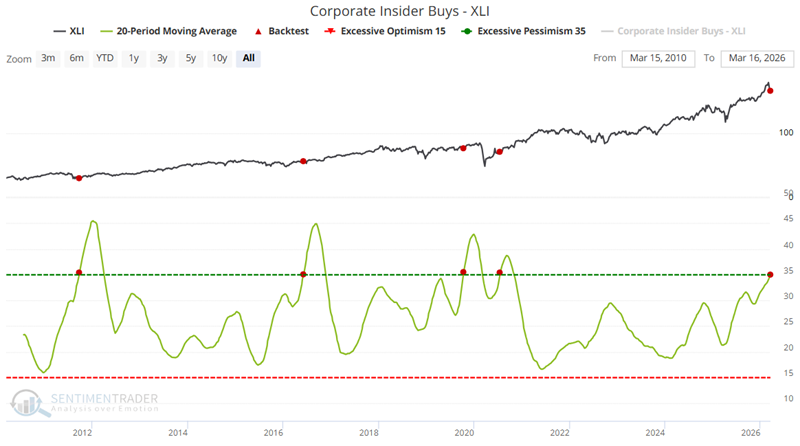
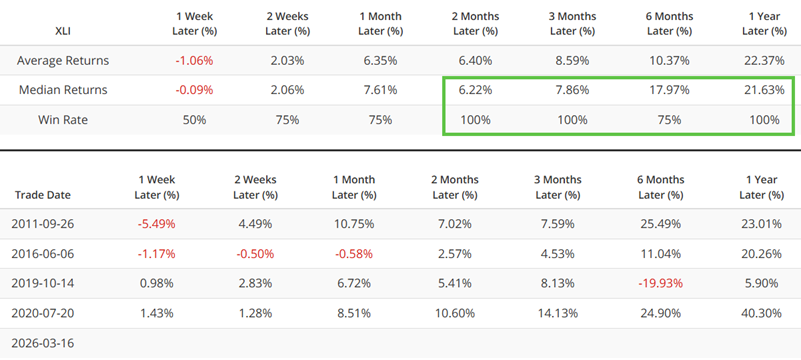
The State Street Industrial Select Sector SPDR ETF (XLI) tracks the S&P 500 Industrials Sector Index. The chart below shows those dates when the 20-week average of the Corporate Insider Buys - XLI indicator crossed above 34.9. This happens very infrequently and indicates that industry insiders have been net accumulating shares for months. The most recent signal just occurred on March 16th.
The table below summarizes subsequent XLI performance following these signals.
NYSE breadth negative streak suggests near-term sluggishness
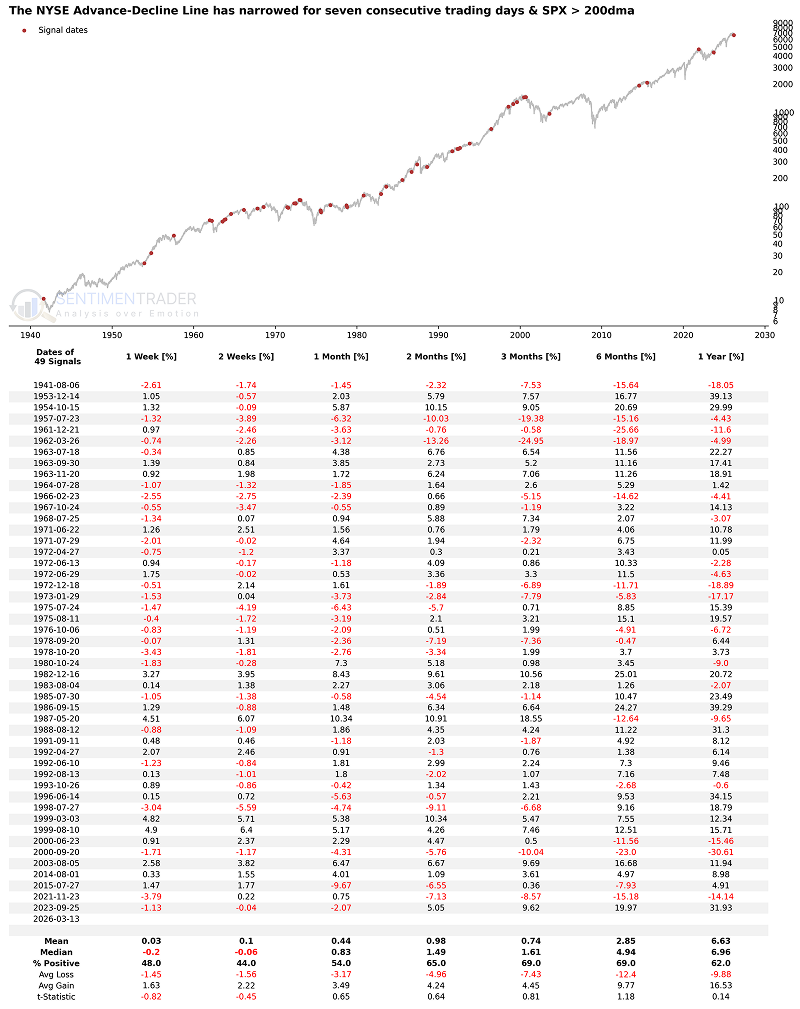
Over the past few trading days, the seven sessions have marked a rare period of sustained downside breadth on the NYSE. This dynamic has only occurred 1% of the time since 1928.
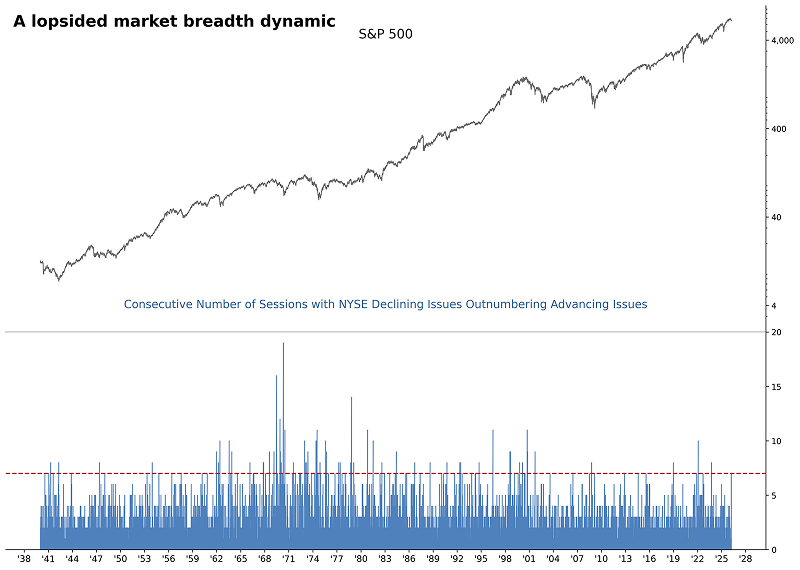
With decliners outpacing advancers for seven straight days-a scenario seen just 1% of the time-history suggests a muted response from the S&P 500 over the following two weeks. Median returns during this period have consistently lagged the broader historical baseline.
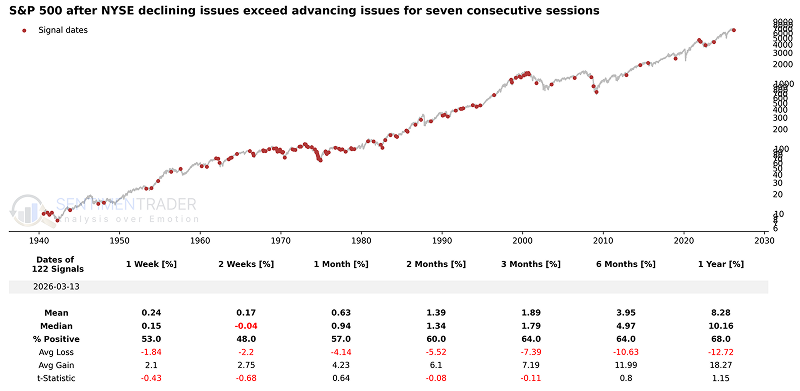
Let's add some context. We will now require the S&P 500 to close above its 200-day average, signifying an uptrend similar to now. As we can see from the recent action, the index has experienced this decline while still maintaining its position above the long-term moving average.
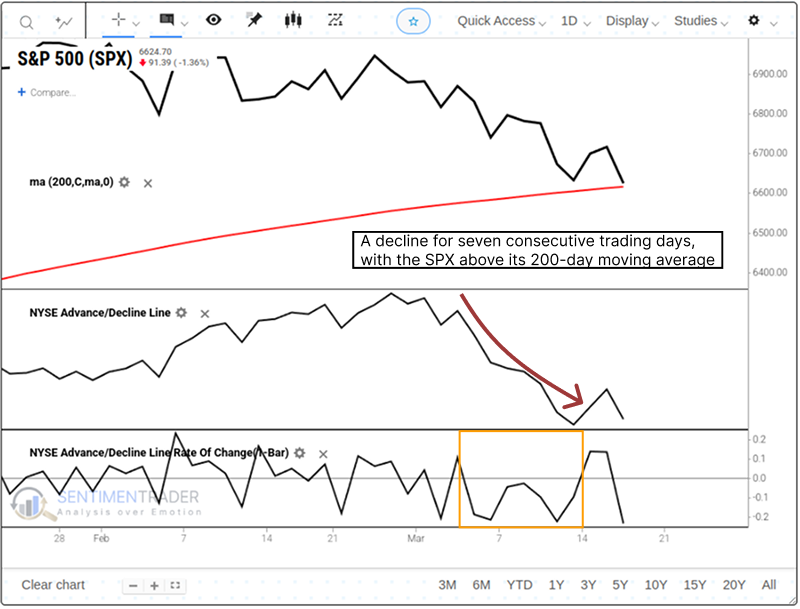
When NYSE breadth is negative for seven consecutive sessions, and the S&P 500 is above its long-term average, returns are still lackluster over the subsequent 2 weeks.
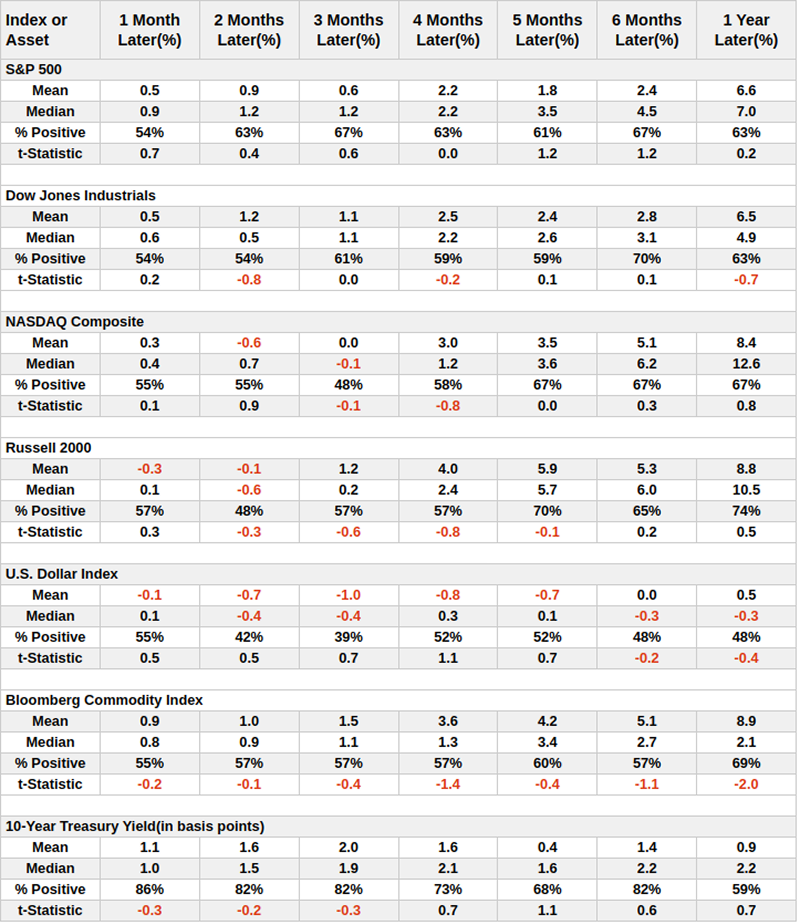
This sluggishness extends beyond just large-cap stocks. When we look at how other major indices and asset classes perform following these breadth signals, the near-term weakness is evident across the board. Conversely, the 10-Year Treasury Yield has an exceptionally high probability of rising in the short term, potentially explaining the continued pressure on stocks.
Commodity seasonality: Corn, Natural Gas, Soybeans favorable; Palladium, Sugar, Wheat unfavorable
The Bloomberg Commodity Spot Price Index (BCOMSP) gained more than 15% in 2025. Precious metals led the way, with the Invesco DB Precious Metals Fund (DBP) leading the way with a 70% gain. Historically, rallies in precious metals have tended to precede rallies in broader commodity indexes.
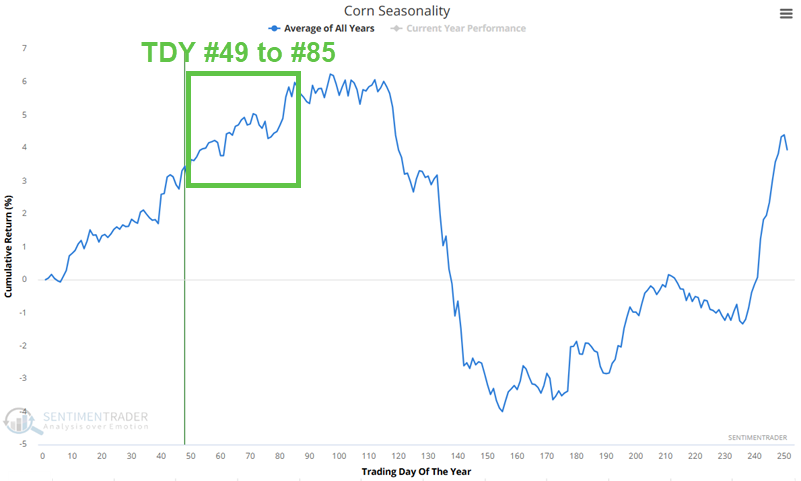
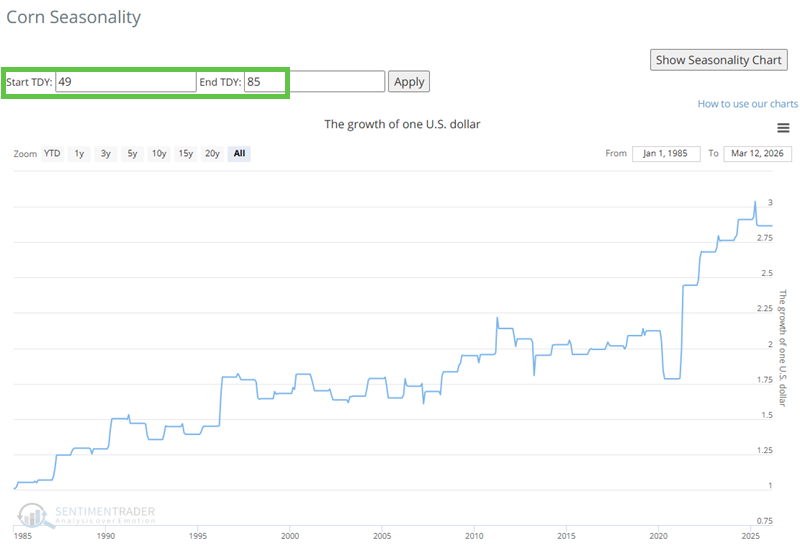
Corn: Corn suffered a 5% sell-off in mid-January but has been rallying, true to seasonal form, ever since. The Annual Seasonal Trend for Corn highlights the Trading Day of the Year (TDY) period from TDY #49 through TDY #85. For 2026, this period extends from March 13th through May 5th.
Non-futures traders can consider the Teucrium Corn Fund ETF (CORN).
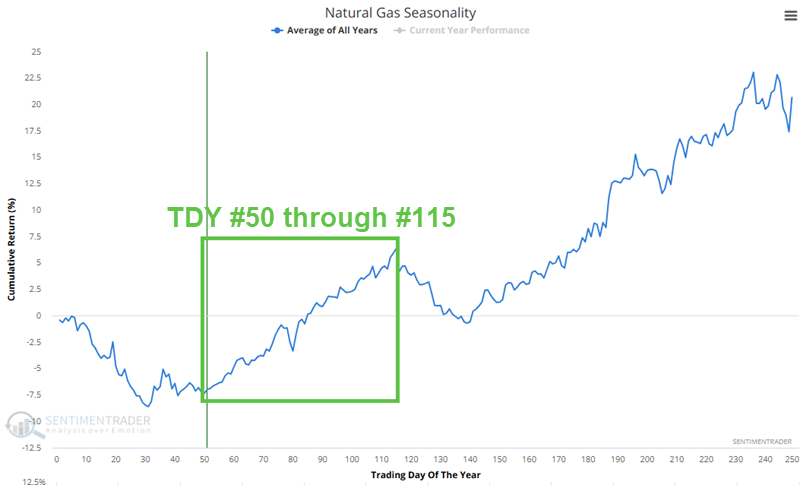
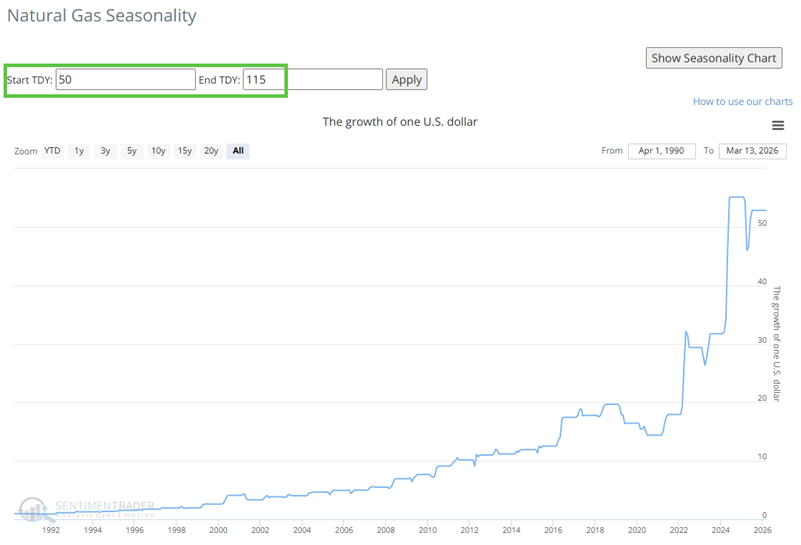
Natural Gas: Natural Gas has had a wild ride so far in 2026, experiencing a -17% decline, a 52% rally, another -31% decline, and has since bounced 12% higher. The Annual Seasonal Trend chart for Natural Gas highlights a favorable period that extends from Trading Day of the Year (TDY) #50 through TDY #115. For 2026, this period extends from March 12th through June 15th.
Non-futures traders can consider the United States Natural Gas Fund, LP (UNG).
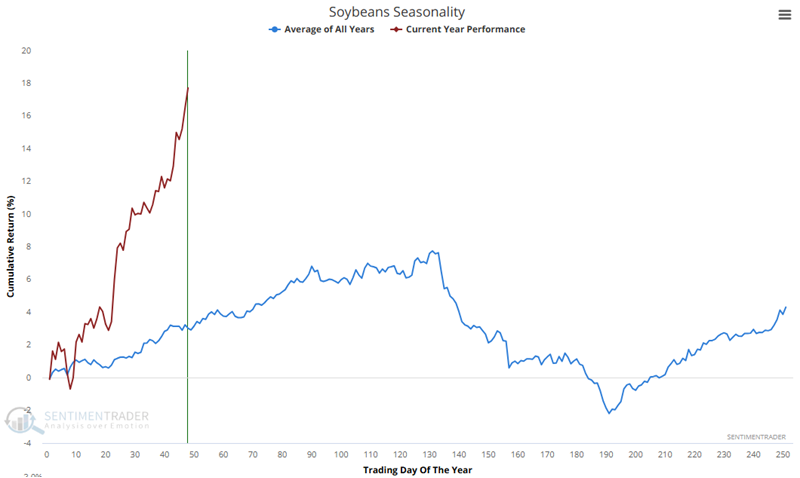
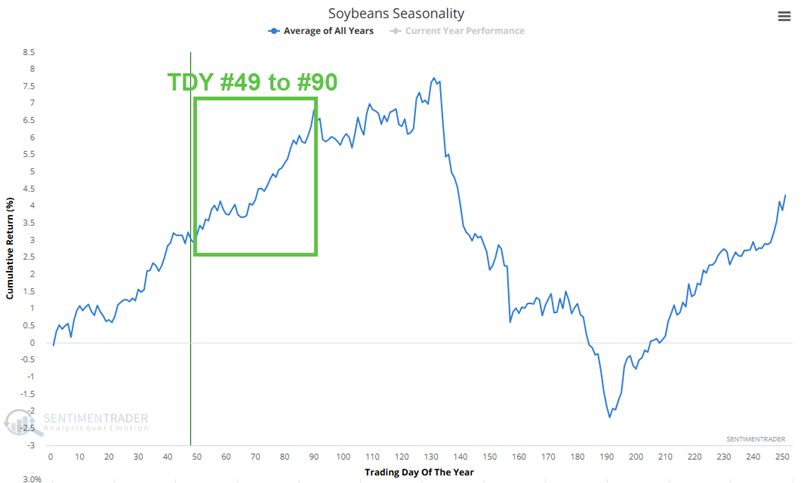
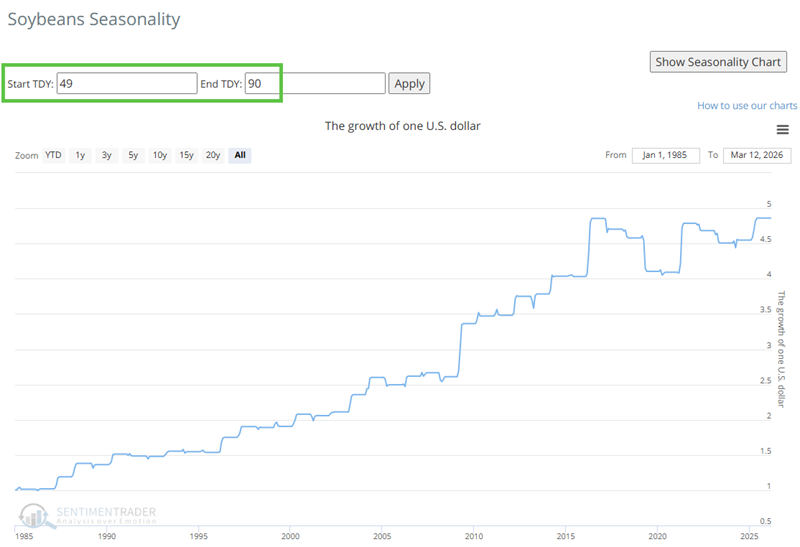
Soybeans: Soybeans have a long historical tendency to show strength during the first half of the calendar year. The Annual Seasonal Trend chart for Soybeans highlights a favorable period that extends from Trading Day of the Year (TDY) #49 through TDY #90. For 2026, this period extends from March 13th through May 12th.
Non-futures traders can consider the Teucrium Soybean Fund ETF (SOYB).
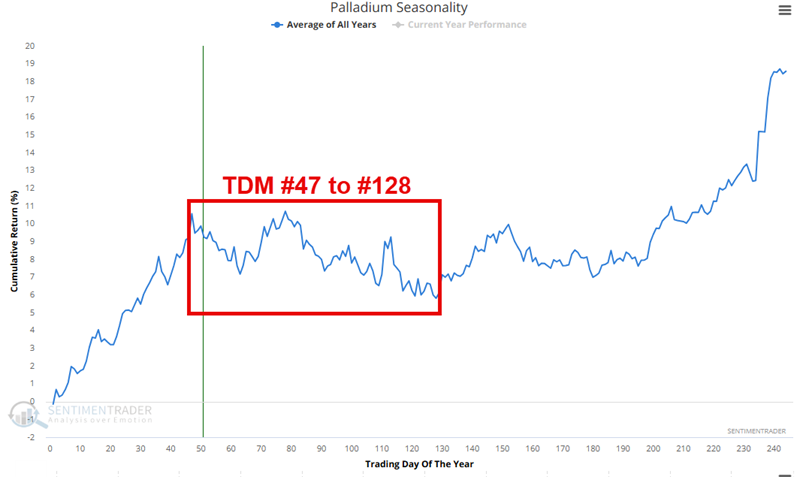
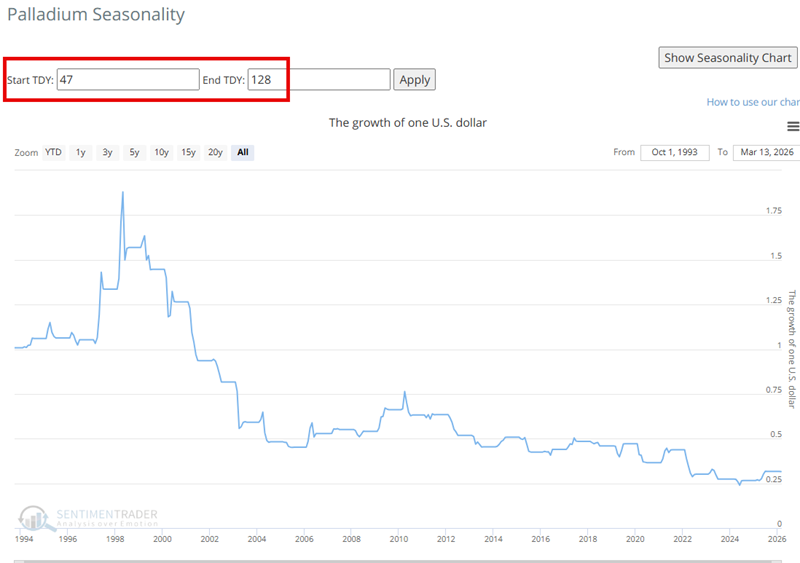
Palladium: Palladium piggy-backed other metals and rallied 32% into late January. Since then, it has plunged almost 30% and is down slightly for the year. The Annual Seasonal Trend chart for Palladium highlights an unfavorable period that extends from Trading Day of the Year (TDY) #47 through TDY #128. For 2026, this period extends from March 9th through July 6th.
Non-futures traders interested in playing the short side might consider selling short shares of the ABRDN Physical Palladium Shares ETF (PALL).
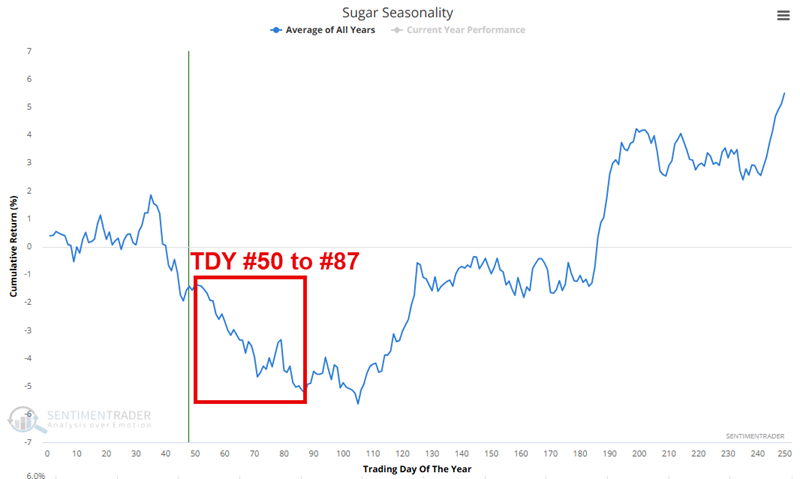
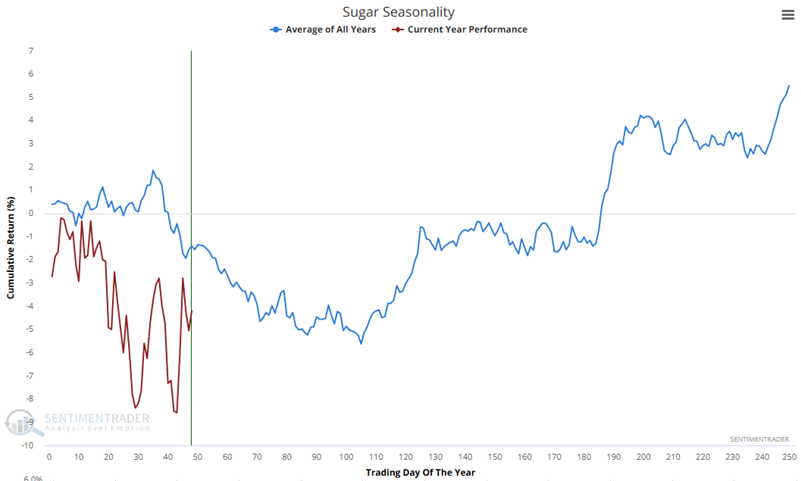
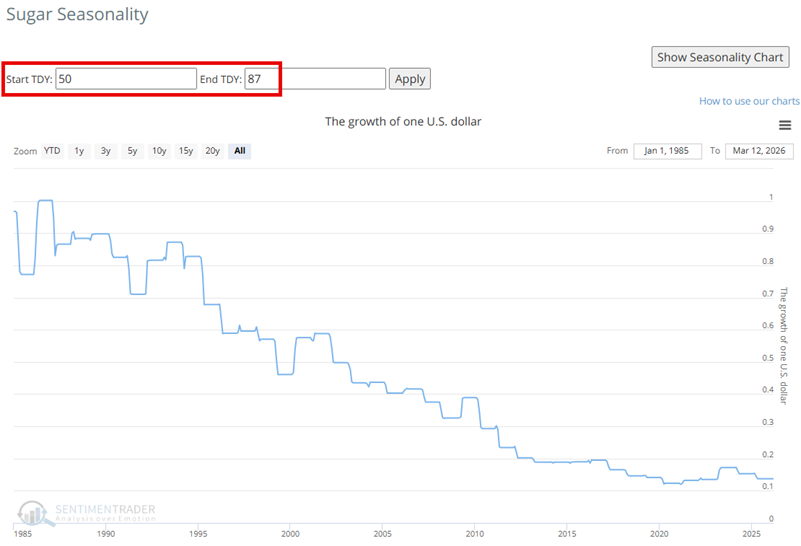
Sugar: The Annual Seasonal Trend chart for Sugar highlights an unfavorable period that extends from Trading Day of the Year (TDY) #50 through TDY #87. For 2026, this period extends from March 16th through May 7th.
Non-futures traders interested in playing the short side might consider selling short shares of Teucrium Sugar Fund (CANE).
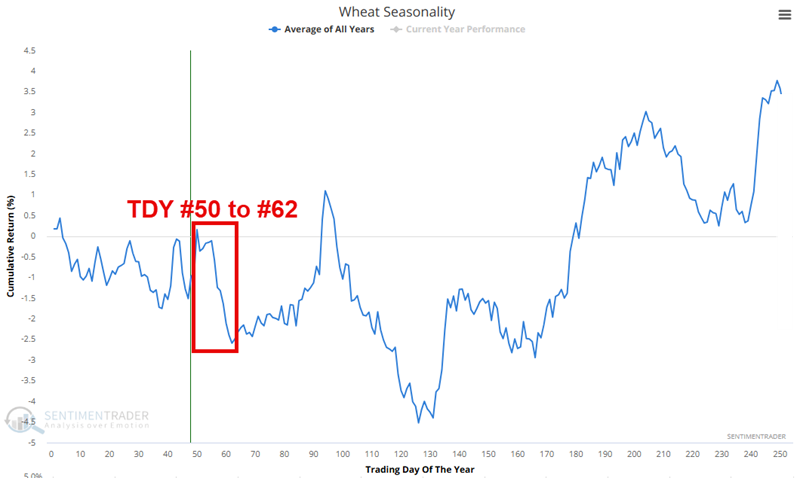
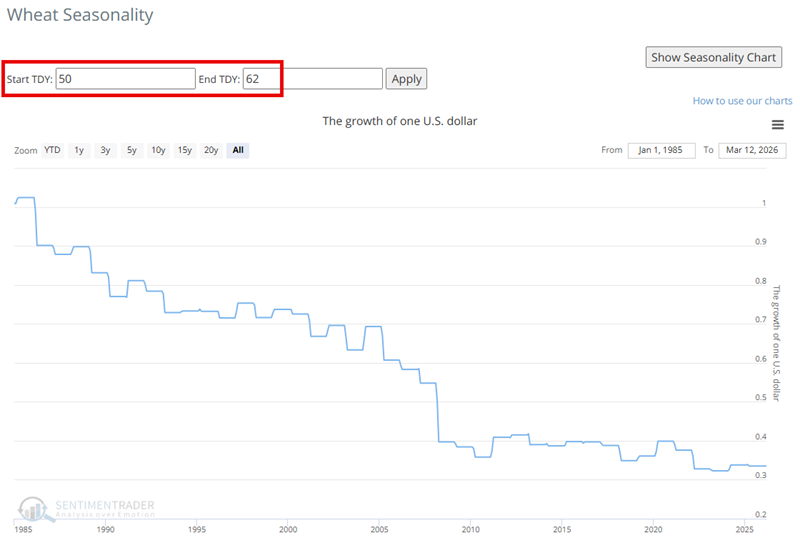
Wheat: The Annual Seasonal Trend chart for Wheat highlights a relatively short, unfavorable period that extends from Trading Day of the Year (TDY) #50 through TDY #62. For 2026, this period extends from March 16th through April 1st.
Non-futures traders interested in playing the short side might consider selling short shares of Teucrium Wheat Fund (WEAT).
About TradingEdge Weekly...
The goal of TradingEdge Weekly is to summarize some of the research published to SentimenTrader over the past week. Sometimes there is a lot to digest, and this summary highlights the highest conviction or most compelling ideas we discussed. This is NOT the published research; rather, it pulls out some of the most relevant parts. It includes links to the published research for convenience, and if you don't subscribe to those products, it will present the options for access.