
TradingEdge Weekly for Mar 13 - Crude oil futures, Risk On/Off Indicator shift, Market breadth signals, Financial sector insiders

Key points:
- Crude oil futures broke sharply higher amid geopolitical tensions, signaling potential reversal
- The Risk On/Off Indicator dropped below 35%, signaling short-term market challenges
- Market breadth signals show deterioration despite S&P 500 hovering near highs
- Financial sector insider buying surged, hinting at potential broader market strength
- VIX volatility spikes and McClellan Oscillator divergence highlight market friction
House view:
- Stocks:
- Short-term: Bearish. Currently, nearly all indicators are unfavorable, as detailed in the "Where we're at" section. U.S. equities suffer a brutal selloff amid a stagflation shock, as negative February nonfarm payrolls (-92k jobs vs. +59k expected) and a spike in oil prices trigger full risk-off mode. The index now tests its critical 200-day moving average, the long-term bull/bear line in the sand. This time frame covers 1-4 weeks.
- Intermediate-term: Bearish. Market momentum continues to weaken and is now in a risk-off state. The market is now pricing in a stagflation regime: economic contraction paired with resurgent inflation from the energy shock. The Fed has lost its room for rate cuts to support the economy, removing the key backstop for equity valuations. Short and medium-term moving averages have turned fully bearish across major indices, with downside momentum accelerating as investors flee risk assets. This time frame covers 1-5 months.
- Long-term: No view. The long-term uptrend hangs in the balance, with the S&P 500 now within striking distance of its 200-day moving average (~6,600). A decisive break below this level would invalidate the long-term bullish structure, while a hold could offer a floor for a potential rebound. There is no clear long-term edge until this critical technical level is resolved and stagflation risks abate. This time frame covers 6-12 months.
- Energy and inflation-hedge sectors are the only areas with relative outperformance in the stagflation regime
- Avoid high-valuation AI tech, energy-sensitive industrials, and financials most exposed to economic contraction
- Long-term direction will be determined by the 200-day MA test and the duration of Middle East supply disruptions
- Bonds: Long-term cycles remain bearish, with the classic safe-haven relationship broken. The 10-year U.S. Treasury yield rises sharply despite the equity meltdown, as markets price in a resurgence of inflation from surging oil prices. Investors are demanding higher risk premiums to hold long-dated debt, with the Fed now trapped and unable to cut rates to support growth. The 2s10s spread holds at +51 bps, with yields rising across the curve in a rare "risk-off, yields up" regime that signals deep market concern about entrenched inflation.
- Commodities: A historic supply shock drives a powerful bullish breakout in energy, with WTI crude surging, briefly touching $100 intraday. The trend model is strongly bullish in the short-term, fueled by Iran's threats to block the Strait of Hormuz. Analysts' reports suggest that crude oil prices may ultimately experience a significant decline. An effective commodity trend model is currently bullish for precious metals. Gold fluctuated near the $5,080 level, holding above the key support level of $5,000.
- Notable Moves in Global Markets:
- Europe: Major European valuations declined as the region's insufficient energy self-sufficiency leaves it highly vulnerable to soaring oil and gas prices, with aviation, logistics, and energy-sensitive industrial sectors leading the losses. Markets are pricing in a high risk that Europe will be the first major economy to fall into stagflation amid the supply shock.
- Japan: Asia shares were mostly lower Friday, tracking Wall Street losses, as the island nation's near-total reliance on Middle Eastern energy imports leaves its economy acutely vulnerable to a Strait of Hormuz blockade. Fiscal stimulus promises are powerless against the physical risk to energy supplies.
Where we're at
Most investors have the most riding on equities. We feel that the most significant determinants of success for investors are whether to adjust their allocation to that asset class based on factors that have historically had a good record of preceding above- or below-random returns in the months ahead.
Those factors include the probability of a looming recession, sentiment, price action, volatility, breadth, and the bond market. The chart below summarizes the main indicators and composite models we watch for those factors, and they're mostly in bullish regimes. Valuations are not part of these factors since the relationship has been too inconsistent on time frames under one year.
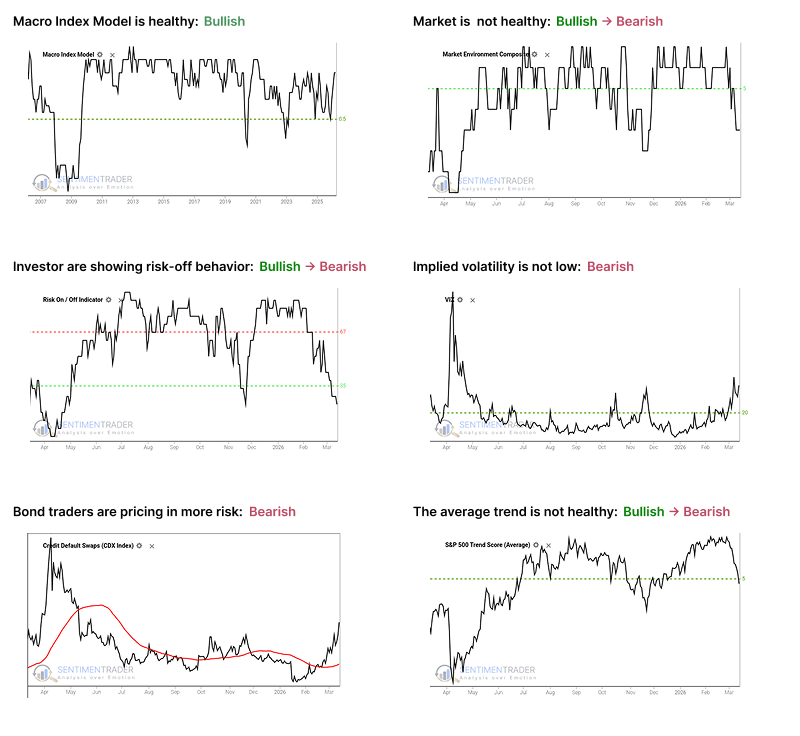
- The Macro Index Model is above the 50% threshold, which has been a vital level as outlined here.
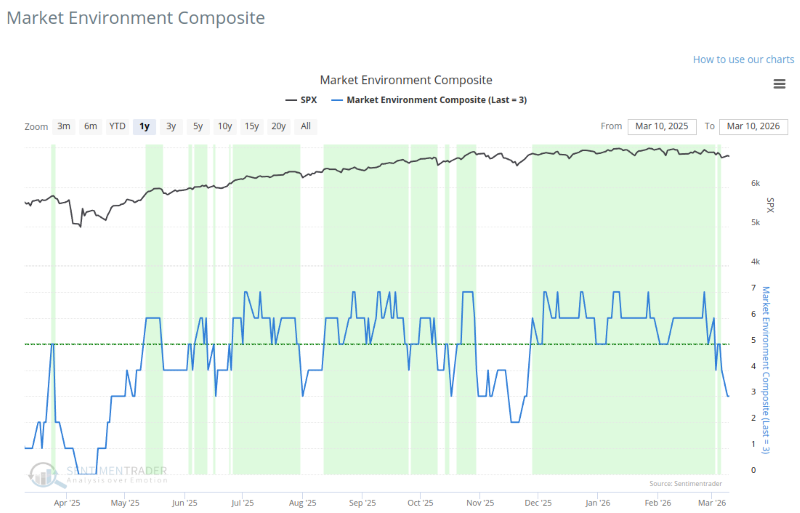
- The Market Environment has been skittish since April, and has slipped into an unhealthy condition. Future returns, especially for higher-beta indices, have historically been notably weaker, with greater risk, when the environment is unhealthy as outlined here.
- The Risk On / Off Indicator shows that investors are now in risk-off mode. This has historically been a warning sign for weak future returns as outlined here.
- Implied volatility is at or above 20, signaling a volatile environment. The S&P 500 has historically performed poorly when this is the case, as outlined here.
- Credit default swap spreads are above their 50-day moving average, which is modestly concerning as outlined here.
- A composite of trend measures in the average S&P 500 stock have dropped below 5, which shows weak trend conditions.
Crude oil futures signal potential reversal
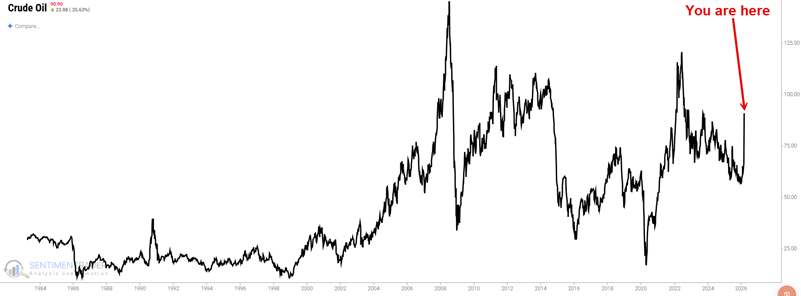
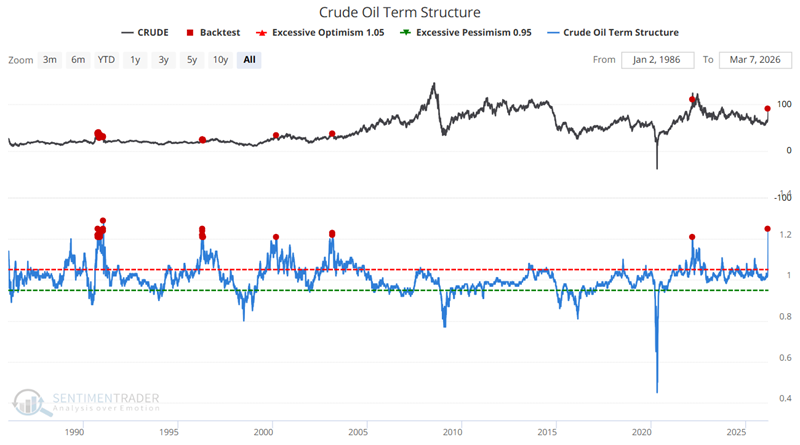
Crude oil futures broke sharply higher last week as fear spiked over the flow of oil tankers through the Straits of Hormuz. At the same time, the price of near-term crude oil futures soared far above that of longer-term contracts, a condition known as severe 'backwardation.' Historical performance for crude oil and several other related markets following previous instances suggests crude oil will ultimately break sharply lower.
The term structure of crude oil futures shows the relationship between a near-term contract and a more distant one. The chart below highlights all dates when the Crude Oil Term Structure was above 1.20, including any 'clusters' of signals.
The table below summarizes subsequent crude oil performance.

Significant downward shift in Risk On/Off Indicator
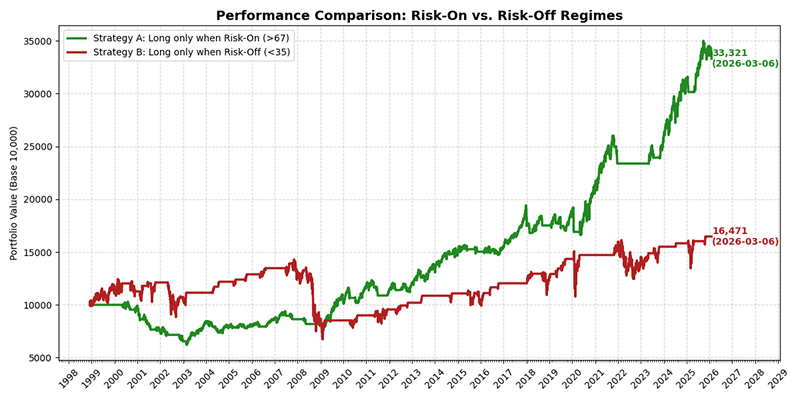
The proprietary SentimenTrader Risk On/Off Indicator has dropped below the critical 35% threshold, officially shifting the market environment to a 'Risk-Off' regime. This shift was sudden and sharp, with the indicator contracting by more than 33% over just three trading sessions.
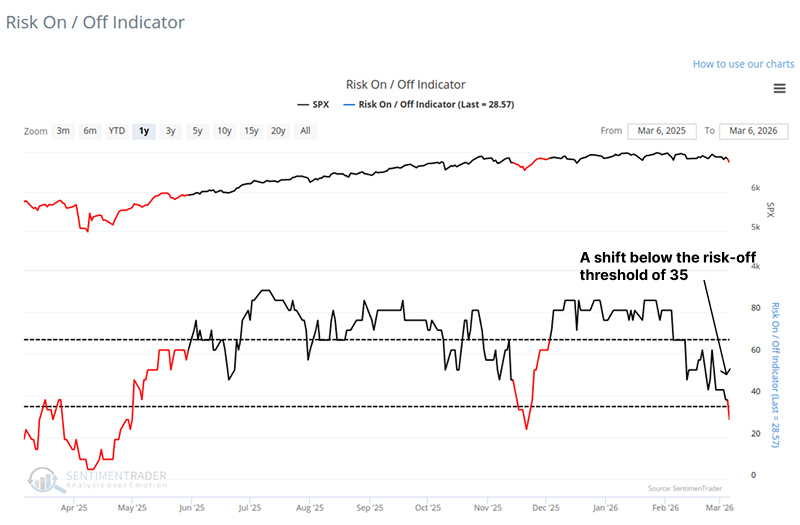
When examining binary overlay models (such as the Risk On/Off Indicator), one way to gauge the strategy's effectiveness is to evaluate the performance of an initial capital investment under the two distinct market regimes (Risk-On vs. Risk-Off). If one invested $10,000 in the S&P 500 only when the Risk On/Off Indicator rose above 67% and remained above 35%, that investment would have grown to $33,321. Conversely, if one invested only when the indicator dropped below 35% and remained below 67%, the investment would have grown to merely $16,471.
Market breadth deteriorates despite S&P highs
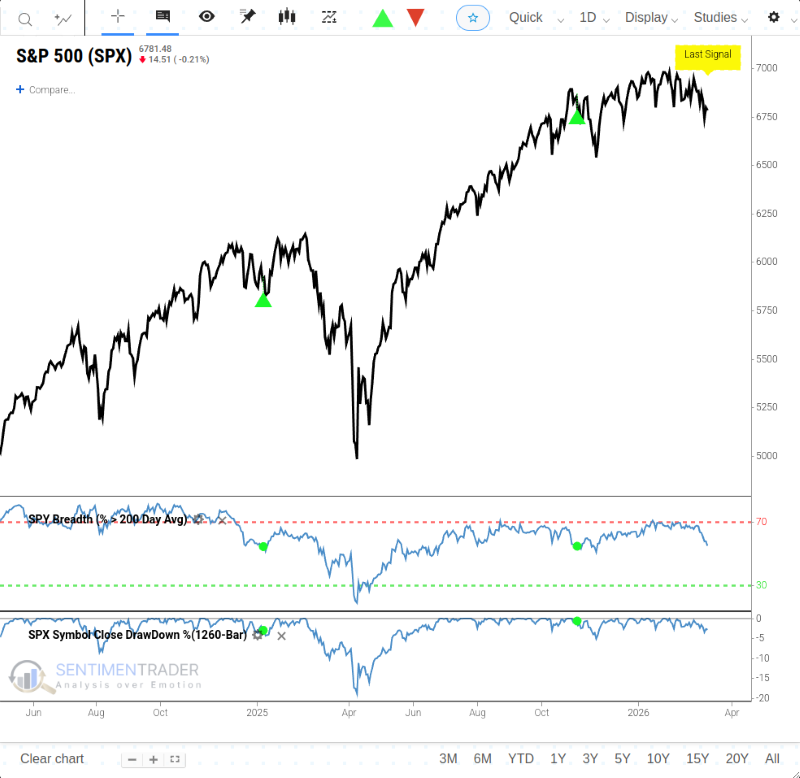
Market breadth is deteriorating significantly, with fewer than 55% of S&P 500 stocks trading above their 200-day moving average despite the index hovering within 3% of a record high. Historically, this specific divergence has preceded negative returns and elevated risk, particularly over the subsequent 2 to 16 weeks.
The Market Environment Composite is currently hovering right at the 'unhealthy' level. In an unhealthy market environment, future returns tend to be weak, and risks are elevated.
Financial sector insider buying picks up
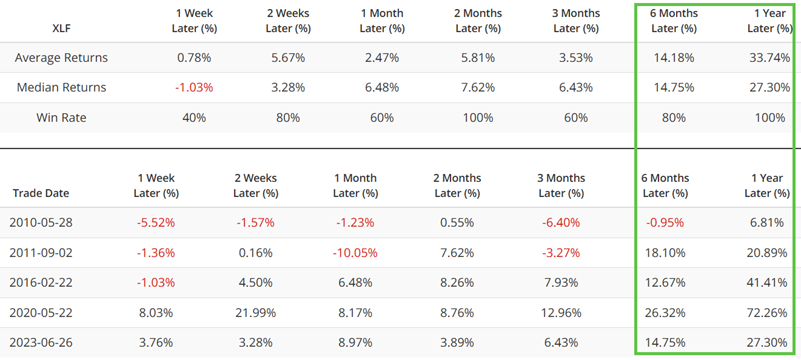
Corporate insider buying in the financial sector is not at a significantly high level, but it picked up noticeably over the past several weeks. Historically, this has had favorable implications for the broader stock market.

The table below summarizes results and shows the performance of ticker XLF following each signal.
VIX volatility spikes amid market friction
The U.S. stock market has recently seemed to enter a zone of heightened friction. The McClellan Oscillator has diverged from the S&P 500 Index at its highs, while the VIX Volatility Index has seen a pulsatile surge.
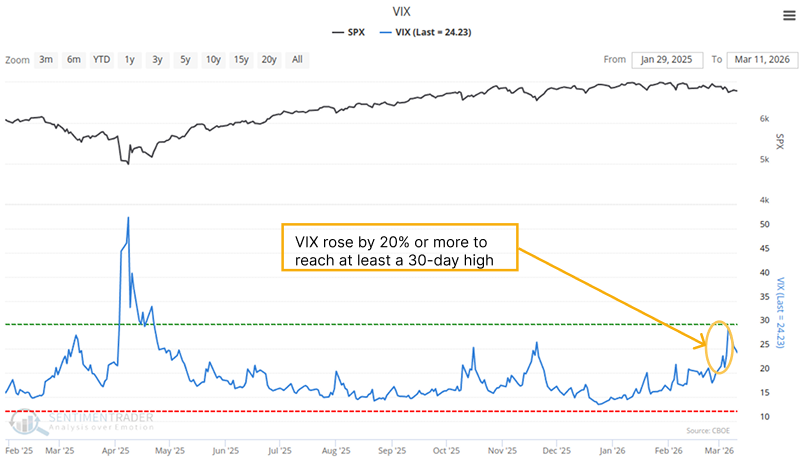
From the perspective of establishing medium-to-long-term left-side buying points, short-term VIX pulses rarely permanently alter the slope of long-term moving averages. The probability of rising 3 months and 6 months after a VIX pulse reached as high as 75% and 72% respectively, with average returns of 2.4% and 6.0%.
About TradingEdge Weekly...
The goal of TradingEdge Weekly is to summarize some of the research published to SentimenTrader over the past week. Sometimes there is a lot to digest, and this summary highlights the highest conviction or most compelling ideas we discussed. This is NOT the published research; rather, it pulls out some of the most relevant parts. It includes links to the published research for convenience, and if you don't subscribe to those products, it will present the options for access.