
TradingEdge Weekly for Mar 1 - New records, sustained momentum, commodity concerns

Key points:
- The Nasdaq joined the record club
- The S&P 500 enjoyed an explosive end to a calm streak
- S&P momentum has carried for a while, with the index higher in 15 out of 17 weeks
- Sustained momentum allowed more and more stocks' medium-term trends to rise above long-term ones
- One potential eventual worry is that cumulative net new highs are diverging strongly from stock indexes
- Oddly, both Smart and Dumb Money Confidence have been rising together
- Outlining a way to use options as a replacement for a position in SPY
- Investors have been saying, "Oui, oui" to French stocks
- Using pattern matching to assess Bitcoin's potential
- Sugar is entering a not-so-sweet period
- Live cattle futures are entering their worst seasonal stretch of the year
Nasdaq joins the record club
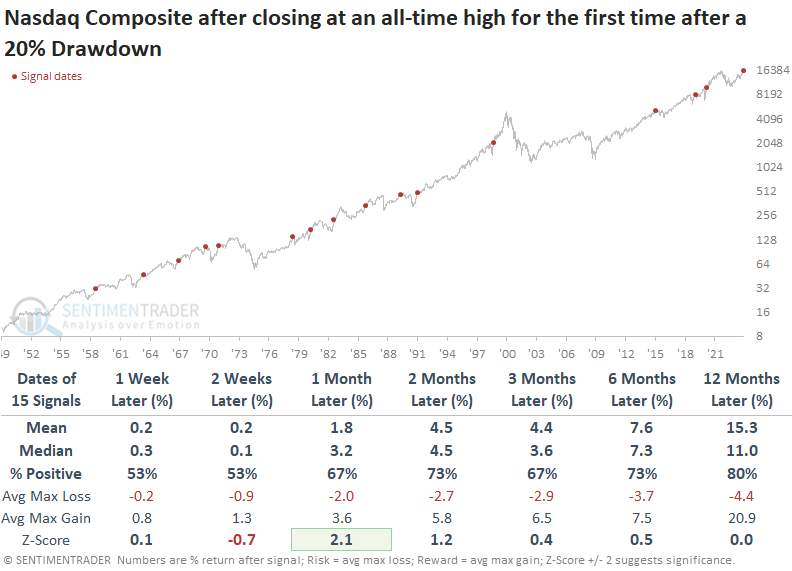
The Nasdaq Composite closed at a new all-time high, marking the first instance after a 20% drawdown. Dean showed that similar record highs for an index that contains a vast number of stocks preceded bullish outcomes.
The NASDAQ Composite contains over 2500 domestic and international common-type stocks listed on The NASDAQ Stock Market, making it one of the most expansive indexes in the United States. Thursday's trading session concluded with the index hitting a new all-time high, ending a 546-day drought without such a record and marking the first instance following a 20% drawdown.
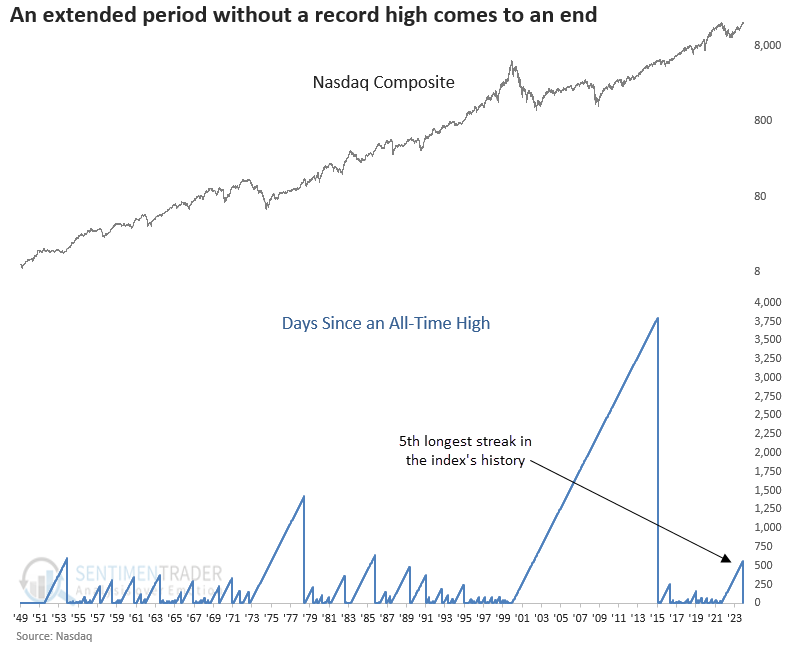
Once the Nasdaq Composite achieves an all-time high after a bear market, the broad-based index tended to sustain the positive momentum, showcasing an 80% win rate over the subsequent year. Over the subsequent two months, drawdowns were limited, with only 3 out of 15 displaying a max loss greater than -5%.
While sector weightings may vary over time, the Nasdaq Composite today equates to a bet on Technology, with the industry accounting for 57% of the index.
The timing model Dean uses to assess relative strength between the Nasdaq Composite and the S&P 500 continues to favor the Nasdaq. Our developers are currently programming this model along with several others, enabling subscribers to track relevant trends on the website's strategies page.
An explosive end to a calm streak
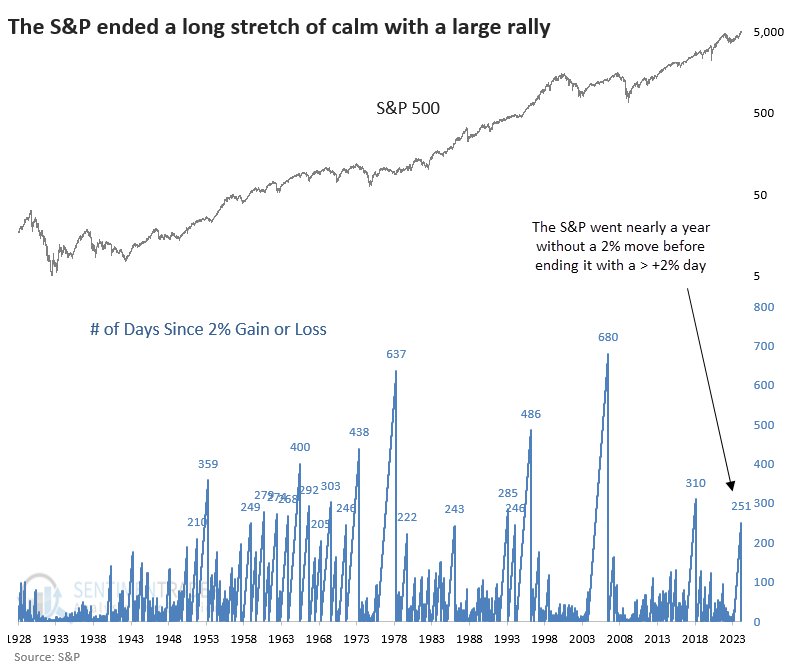
The S&P 500 finally ended a long period of calm, but not in the usual way.
Instead of volatility rising by stocks dropping, it did the opposite. The S&P ended one of its longest-ever stretches without a +/- 2% daily change by rallying strongly on the back of NVDA's earnings report.
When the S&P ended a long streak of six months or more without a 2% move by exploding higher, it tended to do okay. Follow-though over the short-term was good, while relaxing somewhat over the medium term.
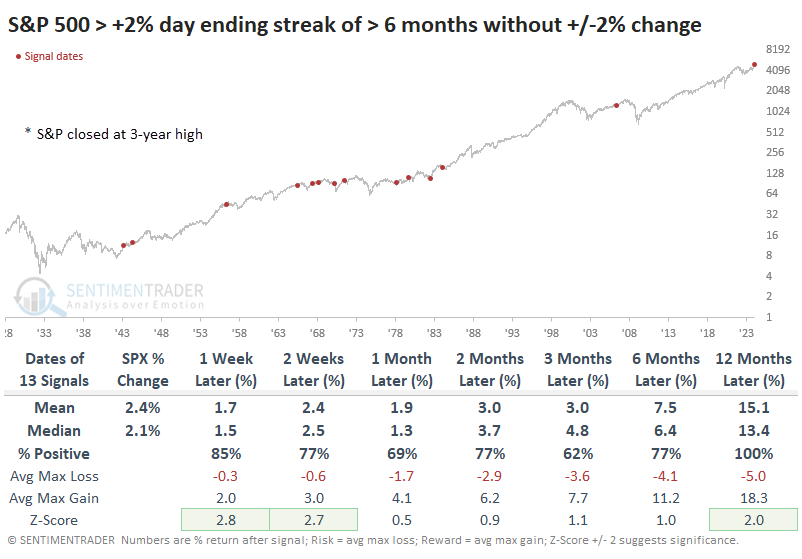
One thing to note is the asterisks. Those highlight the only times the S&P ended a streak like this by exploding higher and recording a multi-year high. Our current instance is the only one besides September 1979. That one happened to mark a multi-month exhaustion point.
Among sectors and factors, technology stocks tended to do quite well after these explosive outbreaks in the S&P. Ironically, so did small cap stocks. Over the next year, small caps sported a healthy median return of +39.0%, with a ridiculously skewed reward-to-risk ratio.
The most weekly momentum in 35 years
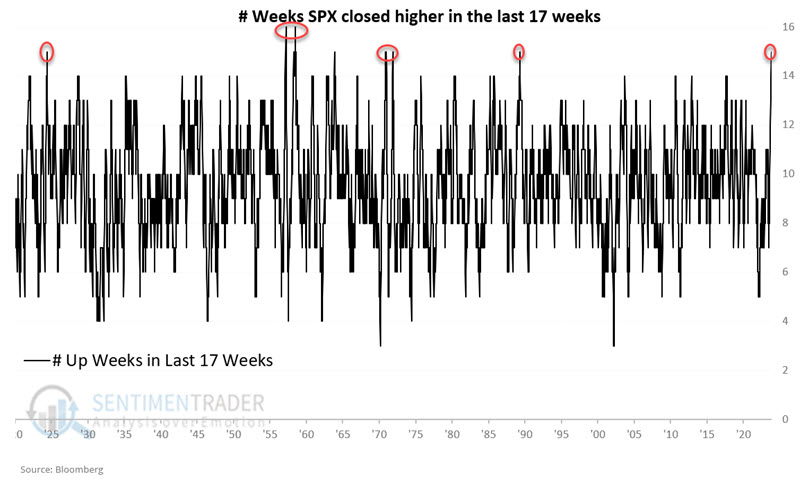
The S&P 500 closed higher in 15 of the last 17 weeks, a fact celebrated in the media. Jay suggested that the relevant question is, "Does it matter?"
This is an infrequent occasion - as seen in the chart below. This has not happened since 1989.
The table below summarizes S&P 500 performance for 1, 2, 3, 4, 8, 13, 26, 39, and 52 weeks considering all weeks starting on 1920-04-30. Let's look only at weeks that met the "15 of 17 Up Weeks" criteria. The table below displays all dates and S&P 500 performance when these criteria were met.
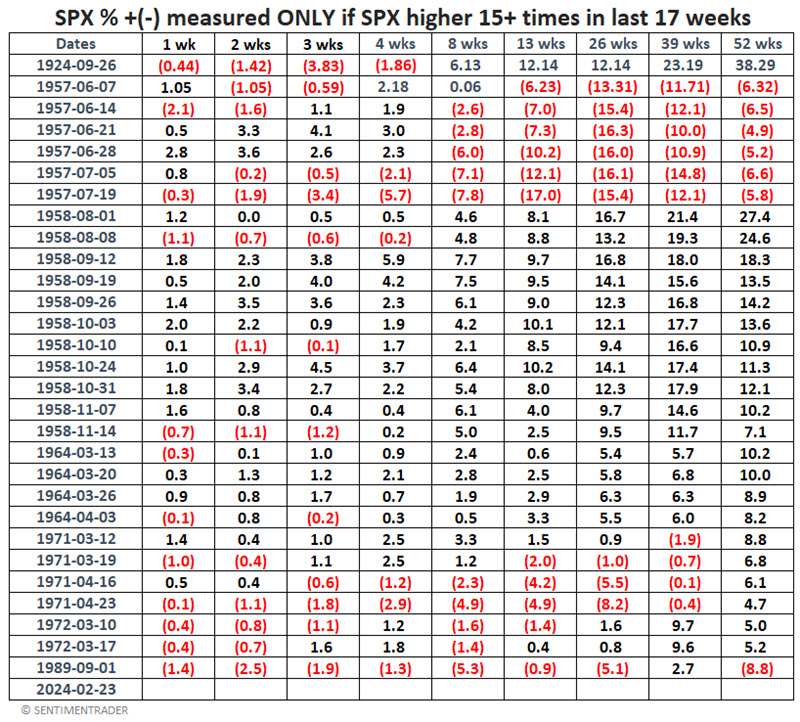
Some periods have shown better performance and higher Win Rates than All Weeks; others have shown worse. Before writing off 15 of 17 Weeks as not terribly significant, let's take one more pass at using this event.
The method below uses the following rules:
- If SPX has closed higher for at least 15 of the last 17 weeks, buy and hold the S&P 500 Index for 39 weeks
- If during this initial 39 weeks, another "15 of 17 Up Week" occurs, extend the holding period for another 39 week
The equity curve displays the growth of $1 invested using this approach.
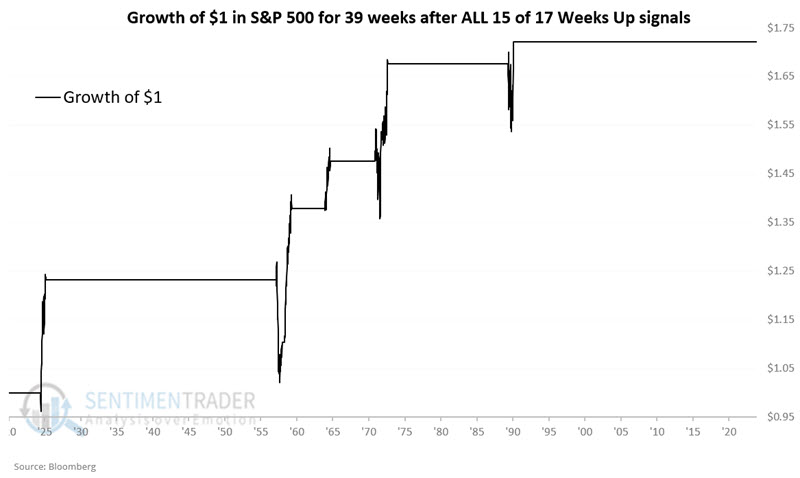
The win rate was 86%, with an average return of +8.7%. Not too shabby, but not earth-shattering, either.
The momentum has improved many stocks' trends
The percentage of S&P 500 stocks with a medium-term average above a long-term average rose above 80%. Dean showed that similar moving average trend conditions suggest a sustainable long-term uptrend for the S&P 500.
The latest indicator to flash an all-clear signal is the percentage of S&P 500 stocks with a 50-day average above their 150-day average. This long-term indication of stock participation cycled from below 20% to above 80% for the first time in over three years. Readings exceeding 80% are associated with an annual return of 13.3% since 1928, twice the return observed when the indicator is below that threshold.
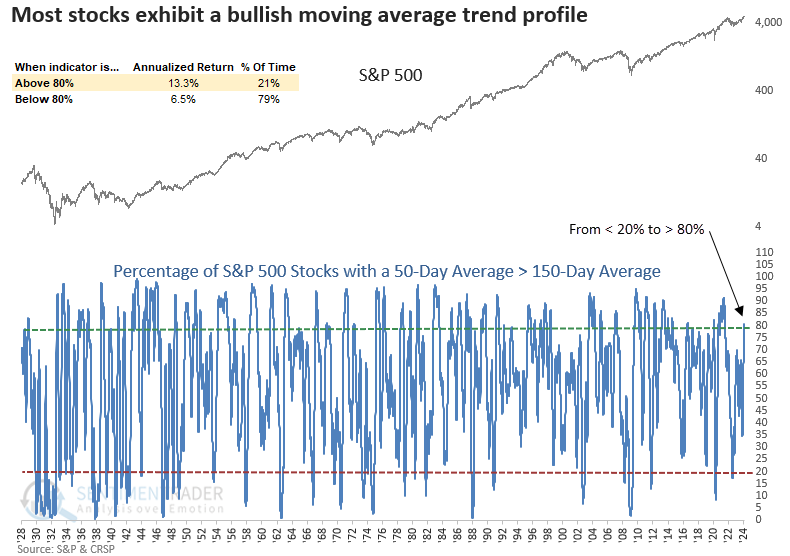
The S&P 500 has historically demonstrated exceptional performance when the percentage of stocks with a 50-day average above their 150-day average shifted from below 20% to above 80%. Consistency has been remarkable since 1942, with only one loss over the subsequent six and twelve-month periods.
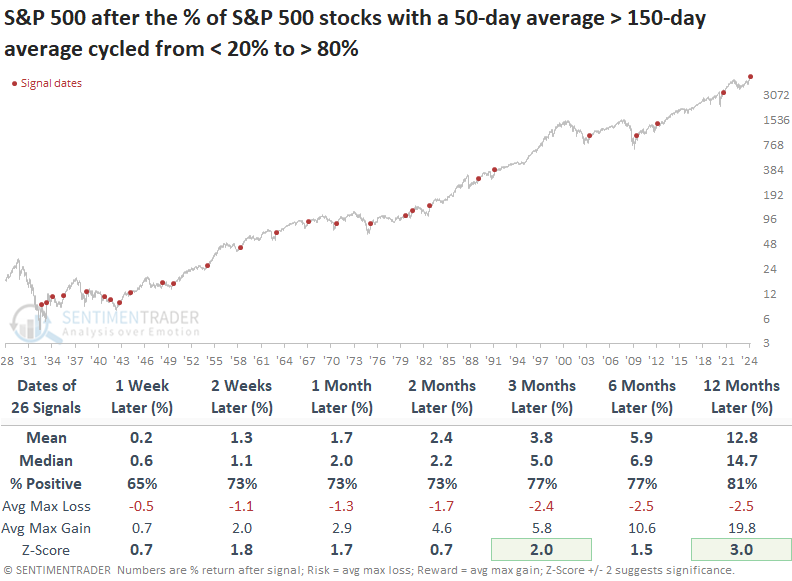
From 1938 onward, the S&P 500 has consistently avoided experiencing a maximum loss exceeding -10% in the subsequent three months.
The improvement in uptrends has largely been driven by defensive sectors, which have been hindered by the FOMC interest rate hiking cycle. Healthcare led the expansion in uptrends over the last month.
One (potential, eventual) worry is the destruction of new highs vs new lows
One of the hallmarks of a sustainable bull market is that more component stocks, bonds, or whatever, consistently reach 52-week highs than fall to 52-week lows.
That's the case now and has been for a few months. It's also a stark change from 2022 and even most of 2023.
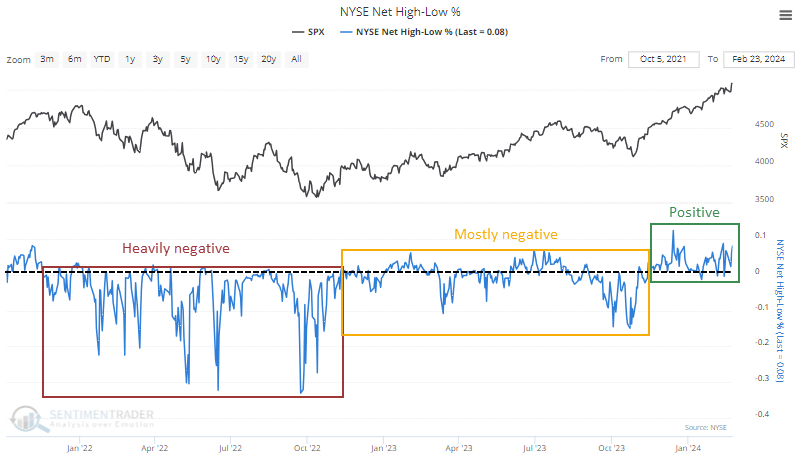
Here's the wrinkle, though. So many issues fell to 52-week lows in 2022, and 2023 didn't help matters much, that the past few months haven't made much of a difference in the Cumulative New High/New Low Line. It has started to curl up but remains about 7% below its high even as the S&P soared.
If we zoom out and take a long-term look at the cumulative new high/new low line, we can see that the only time in 25 years when we witnessed something similar was during the internet bubble years.
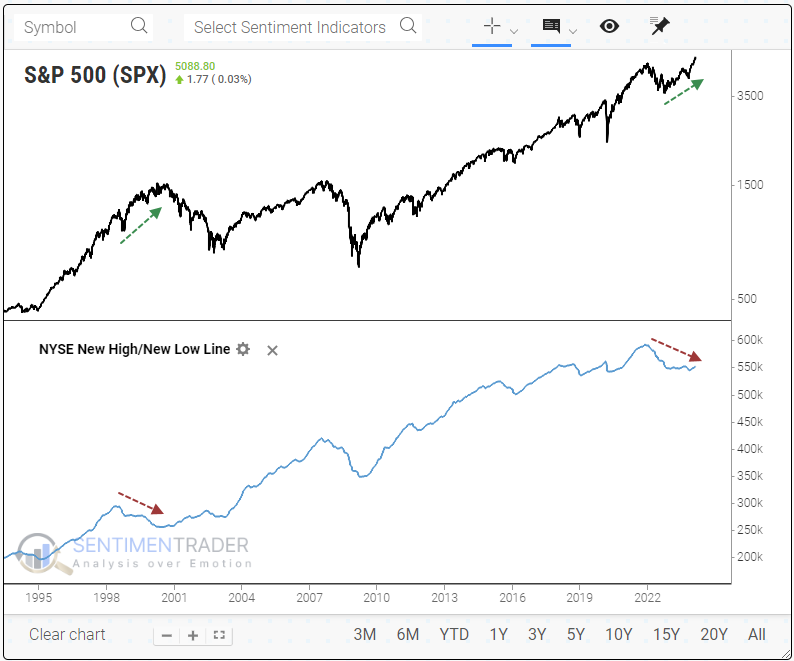
Based on that example, it's not quite time to sell everything and go to cash.
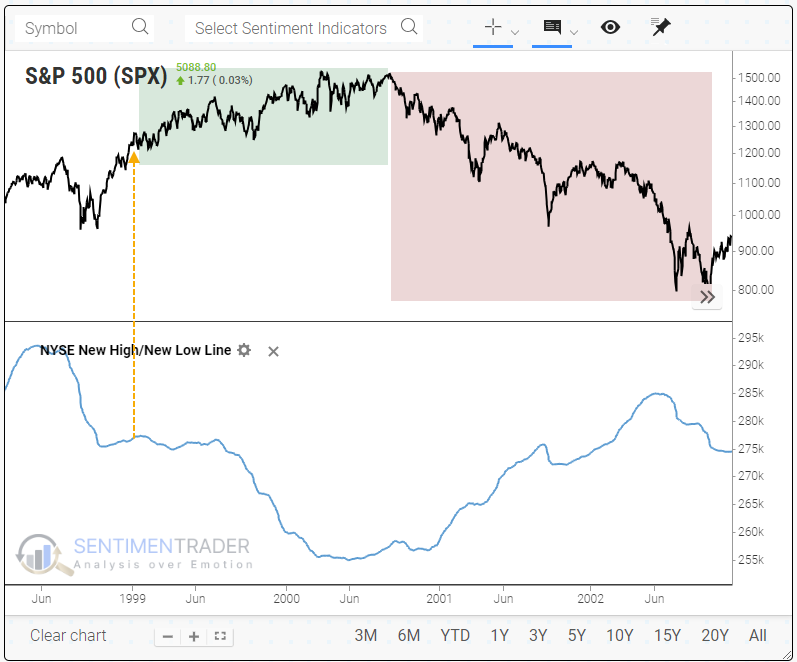
When we zoom in and look at that time frame, we can see that the divergence occurred in early 1999, and many indexes, including the S&P 500, continued to rally strongly for months or even over a year before peaking as the divergence widened.
The divergence before that was in 1995. Anyone around then or who has studied history would immediately understand that it was not bearish at all; it preceded one of the great creeper uptrends of all time.
When we scroll backward, we can see that the next divergence occurred in 1991. This one didn't precede a collapse like post-2000 or a phenomenal run-up like 1995-instead, the S&P just kind of chopped higher for months on end. Returns were mostly positive, but frustratingly so, and it was not a good time for trend-followers.
Continuing our scrolling through history, the next divergence was a decade earlier, in 1980. Like the internet bubble years, the S&P rallied for months after this divergence in the new high/new low line, but it resulted in a significant peak that erased all the gains and then some.
Before that instance, 1972 also recorded a negative divergence. This one saw the S&P chop around for a few months and then explode to new highs, which marked a major peak and significant pain for investors.
Something similar happened after the first divergence in 1967. The S&P swung around in a wide range and then spurted to a new high, which was the bull market peak that wiped out years' worth of gains.
Most of these saw weakness over the very long-term, but not before most of them witnessed further gains and often a blow-off type peak.
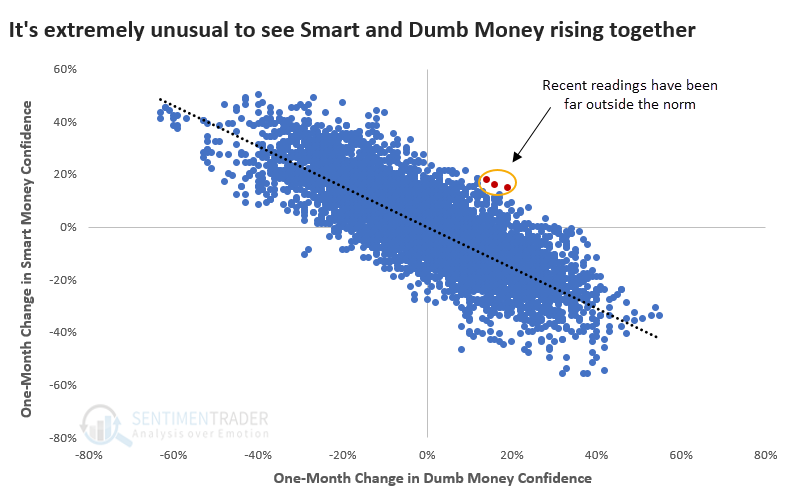
Smart and Dumb Money Confidence is rising together
There has been an unusual situation in effect since mid-January. The major stock indexes have tacked on good gains, and Dumb Money Confidence has risen. That's totally normal. What's not normal is that Smart Money Confidence increased as well.
There has never been a time in 26 years when both Dumb Money and Smart Money increased more than 15% over a month. Whenever Dumb Money has increased by 15% or more, the average change in Smart Money is -18%.
There are two major questions to ask after seeing something like this:
- Has anything changed in the models?
- Has similar behavior meant anything consistent?
The answer to #1 is no. There isn't anything in the inputs that would make us question the validity of the readings.
To help answer #2, we looked at every time both Smart and Dumb Money rose 10% or more over at least several weeks. Shorter-term returns were relatively dour, though the S&P 500 did shrug off the oddity of both models rising several times with no ill effects. Over the next three months, 11 out of 13 signals sported a positive return.
Even more unusual is that both Smart and Dumb Money were above 50%. The small sample size shrinks even further if we look at similar model readings. Only a handful of times did they both rise this much while also being above 50%.
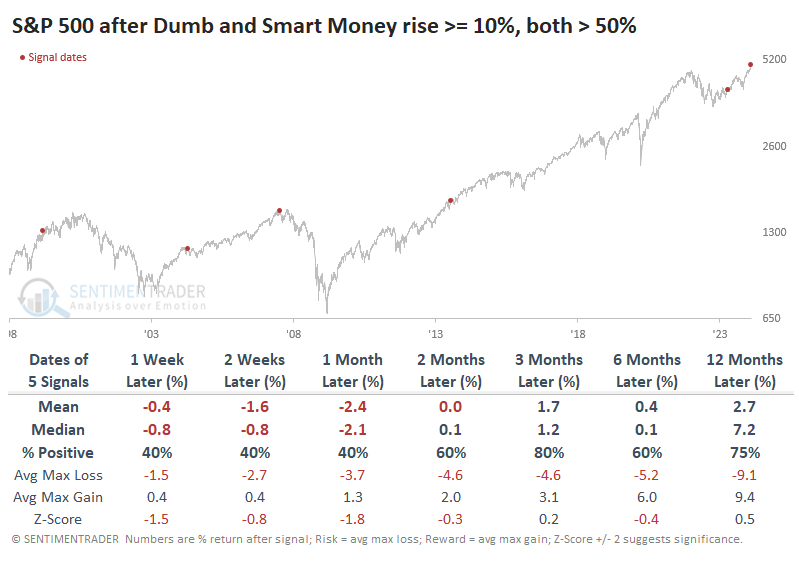
After these signals, the S&P struggled with either negative or just-barely-positive returns over the next couple of months. The sole exception was the one from April last year, which was also the only signal that triggered when the S&P was far off a 52-week high, which is not the case now.
Using options as a stock proxy
Jay suggested that using options can allow an investor to hold a stock equivalent position at a fraction of the cost. The key is understanding the tradeoffs involved.
The S&P 500 has advanced in 15 of the last 17 weeks, something it hasn't done since 1989. Consider an investor without much investment capital who now wants to climb aboard. But they face two problems:
- A lack of money to invest
- There is a concern that the market could suffer a sharp interim decline
So, what's an investor to do?
Buying 100 shares of SPY at $505.99 would cost $50,599. From there, for every dollar SPY shares rise, the position gains $100 and vice versa. But for some, a $50K+ commitment might not make sense. Let's look at one example alternative using SPY options.
The "Delta" of an option approximates the stock equivalent position for that option at a given point in time. For example, the immediate risk/reward prospects for a call option with a Delta of 50 is roughly the same as holding 50 shares of the underlying stock. Buying two call options with a Delta of 50 would be approximately the equivalent of buying 100 shares of the underlying stock.
Now, let's get just slightly more creative. The example position below involves the following:
- Buying 2 SPY Apr19 2024 500 strike price calls @ $14.16
- Selling 1 SPY Apr19 2024 520 strike price call @ $4.01
The particulars for this position appear below.
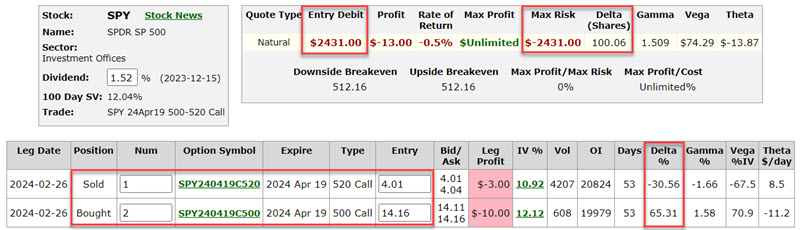
Things to note:
- This position has a Delta of 100.06 (two long calls with a Delta of 65.31 and one short call with a Delta of -30.56)
- However, the cost to enter this position is $2,431 versus $50,599 to buy 100 shares of SPY (i.e., 4.8% of the cost)
So, is this position a bargain? Not necessarily.
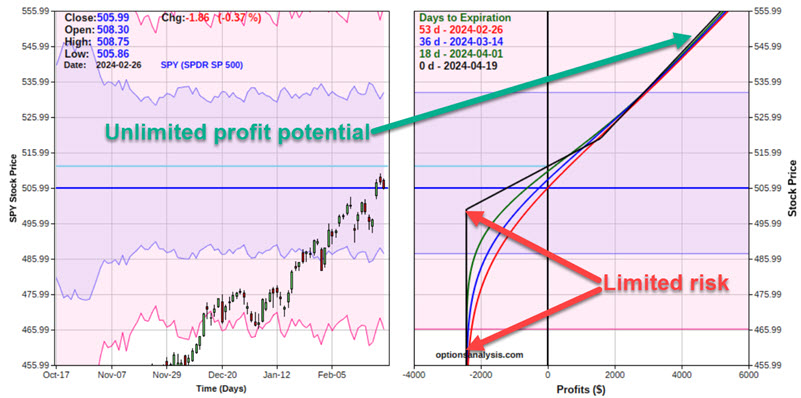
The critical difference between the two is that the option trader pays a certain amount of time premium to enter the trade. This is an amount that an option buyer pays to an option seller to induce the option seller to take on the risk of selling the options in the first place. As you can see in the figure above, the option position loses -$13.17 a day in time decay (Theta). The share position has no time decay (i.e., a $1 change in the share equals a $100 change in the position's value, regardless of how long the position is held).
Jay further outlined the potential benefits vs. costs of using an options strategy like this versus holding the ETF directly as SPY rallies or declines in the weeks ahead.
Investors say, "Oui, oui!" to French stocks
Dean noted that France triggered a bearish-to-bullish reversal in price momentum buy signal. Similar price momentum alerts led to a short-term pullback before the uptrend resumed.
A system that measures price momentum for individual securities by comparing a short-term moving average relative to a long-term moving average triggered a buy signal for France. An alert occurs when the ratio between the 4- and 40-week average cycles from below 0.93 to above 1.4.
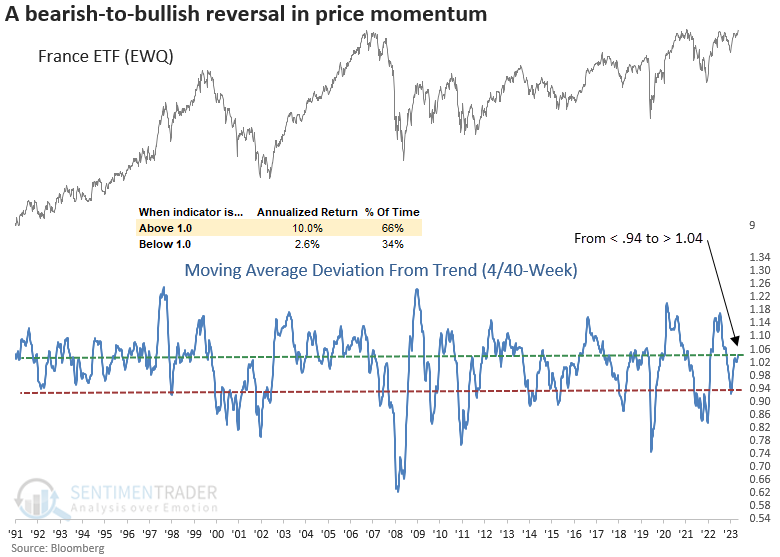
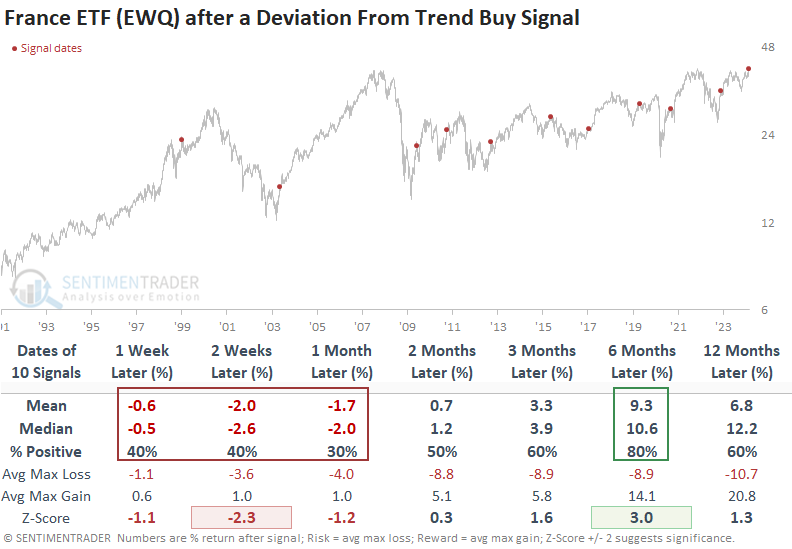
When a deviation from the trend signal occurs, the EWQ ETF tends to give back some of the previous gains over the subsequent month. However, the uptrend will likely resume, with the ETF showing an 80% win rate six months later. The optimal holding period is 34 weeks, resulting in a 90% win rate over that time horizon.
France, along with nearly every other country, ranks poorly on a relative basis when compared to the S&P 500. It's crucial to recognize that these ETFs favor value-oriented stocks.
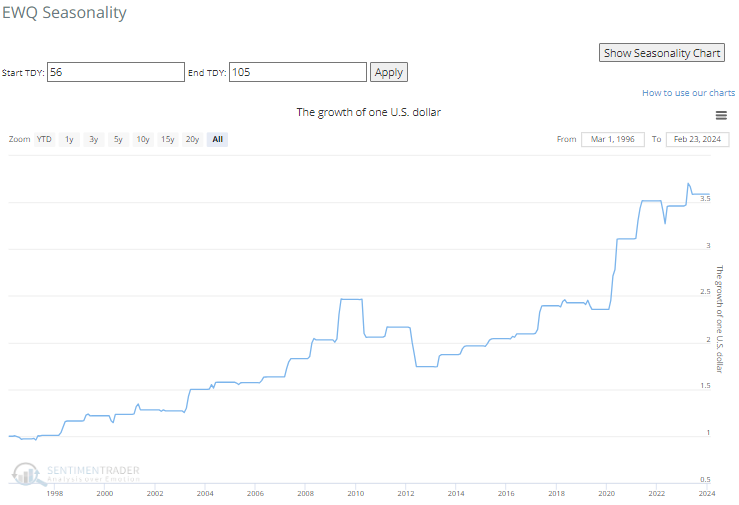
March will see a shift in seasonality favoring the EWQ ETF, with April producing the best return of any month. One of our new features for seasonality charts is the growth of a $1 calculation based on a user-defined start and end date. Purchasing the EWQ ETF at its March seasonal low and maintaining the investment until the peak in May could result in a three-and-a-halffold increase, turning $1 into $3.5.
Bitcoin has gone bonkers again
After a brief dip following the introduction of spot Bitcoin ETFs, the digital asset has exploded to the upside. Dean showed that similar price behavior for Bitcoin suggests the upward trajectory will persist over the subsequent year.
The introduction of spot Bitcoin Exchange-Traded Funds marked a significant milestone in the evolution of the cryptocurrency market. After a brief dip, which was most likely a buy-the-rumor, sell-the-event scenario, Bitcoin has exploded higher since bottoming on 2024-01-23.
Using the new Correlation Pattern Match tool, let's identify periods in history resembling the price behavior around this pivotal event to see if the current upside momentum will persist.
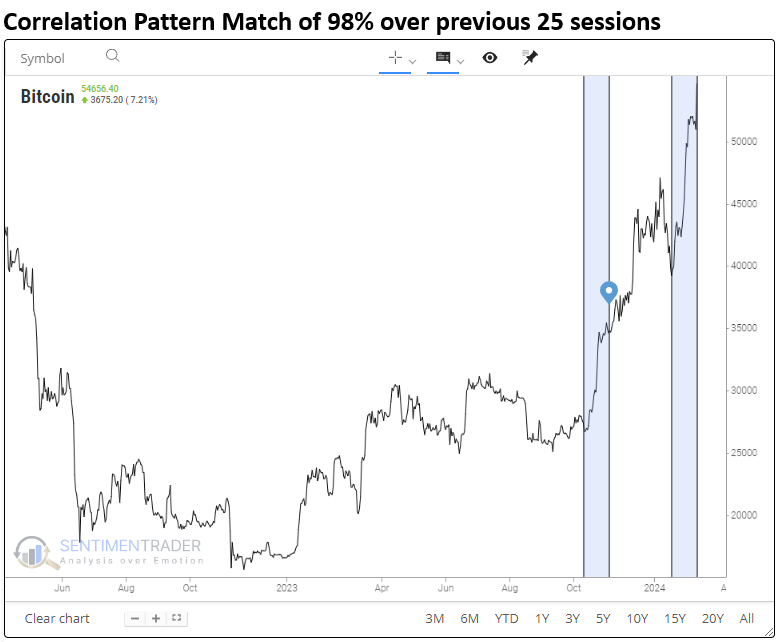
After similar short-term price analogs, like now, Bitcoin displayed excellent returns and win rates across all time horizons. More importantly, signals occurred within the context of uptrends, not downtrends. However, a few signals, like 2015 and 2021, triggered near medium-term peaks.
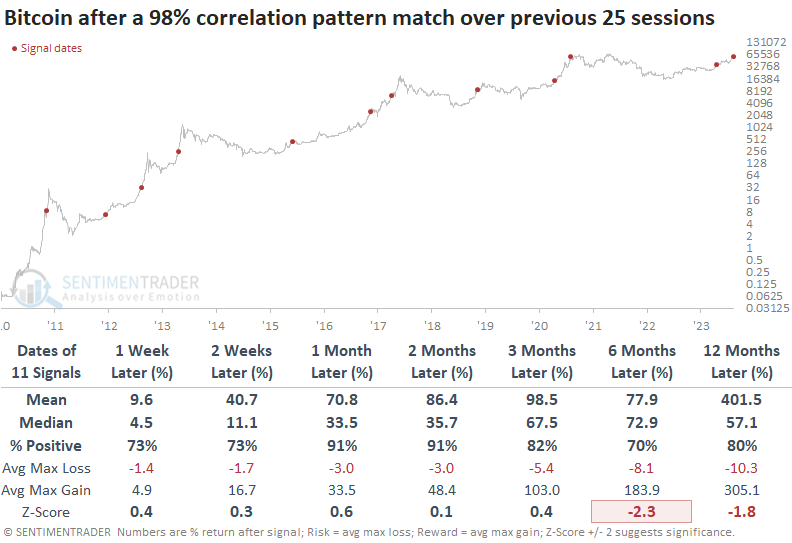
Utilizing the CPM to detect price patterns resembling the prior 126 sessions with a correlation percentage of 95%, the tool identified eight other periods. While results were somewhat mixed depending on the horizon, Bitcoin was higher at some point over the following three months in all but one case, 2019.
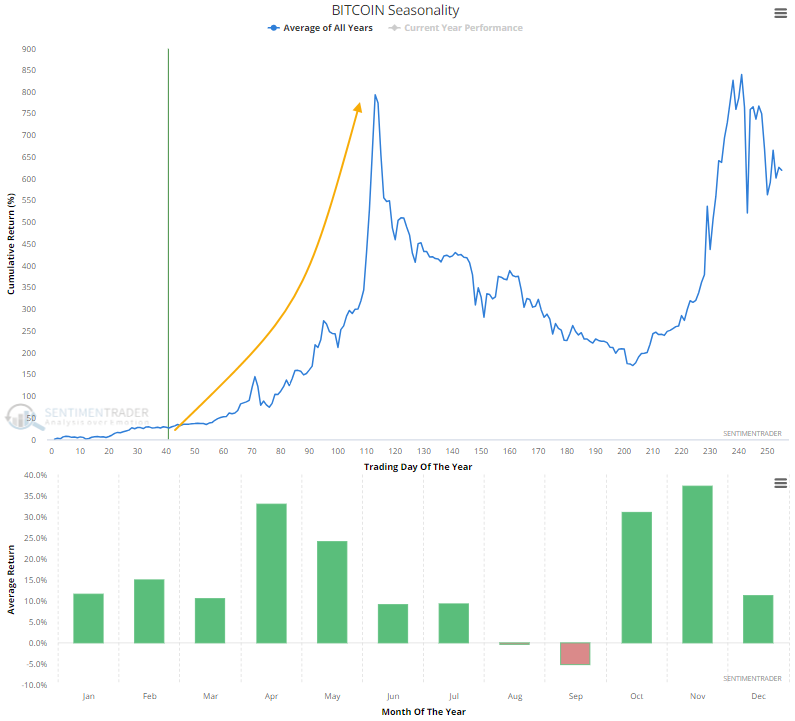
Bitcoin exhibits an extremely bullish seasonal bias in the first 113 trading days of the year, a pattern that looks fairly similar to other risk assets like stocks.
Sugar may not be so sweet
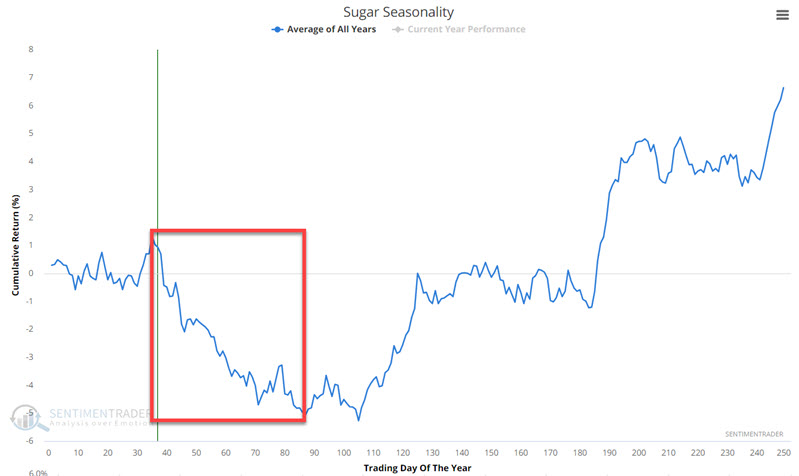
Sugar has a long-term tendency to show weakness in the first half of the year. Jay noted that this market recently entered a typically unfavorable seasonal period while already in an established price downtrend.
The seasonally unfavorable period extends from the close of TDY #35 through the close of TDY #87. For 2024, this period extends from the close on 2024-02-21 through 2024-05-06.
The chart below displays the cumulative hypothetical gain from holding long one Sugar futures contract only during TDY #35 through TDY #87, every year since 1971.
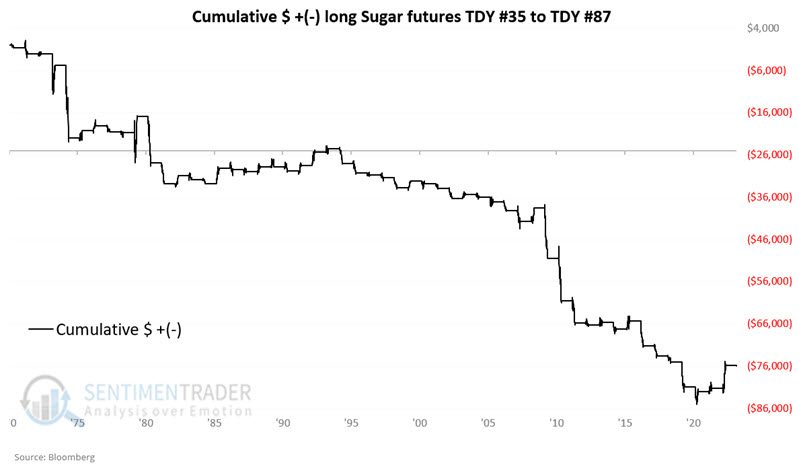
Two important things to note:
- The chart above highlights the clear long-term tendency for sugar price weakness during this period
- Note the upward spike at the far right - in 2023, sugar experienced its most significant gain during the TDY #35 through TDY #87 period - a massive gain of almost over $5,300
The good news is that the tendency for weakness is pretty unmistakable. The bad news is that there is no guarantee from year to year. The massive rally in 2023 reminds us of the need for a stop-loss order to limit risk to a manageable amount.
A seasonal soft spot for an offbeat market
Live Cattle futures are not a market most traders consider. However, Jay noted that at times, it is rife with opportunity. This market has just entered its most unfavorable seasonal period of the year.
A cursory glance at the weekly chart for Live Cattle futures reveals the extremely choppy nature of price movements. While there appears to be little rhyme or reason for the movements, several tendencies are abundantly clear when we break down price action intra-year.
The chart below displays the annual seasonal trend for Live Cattle futures.
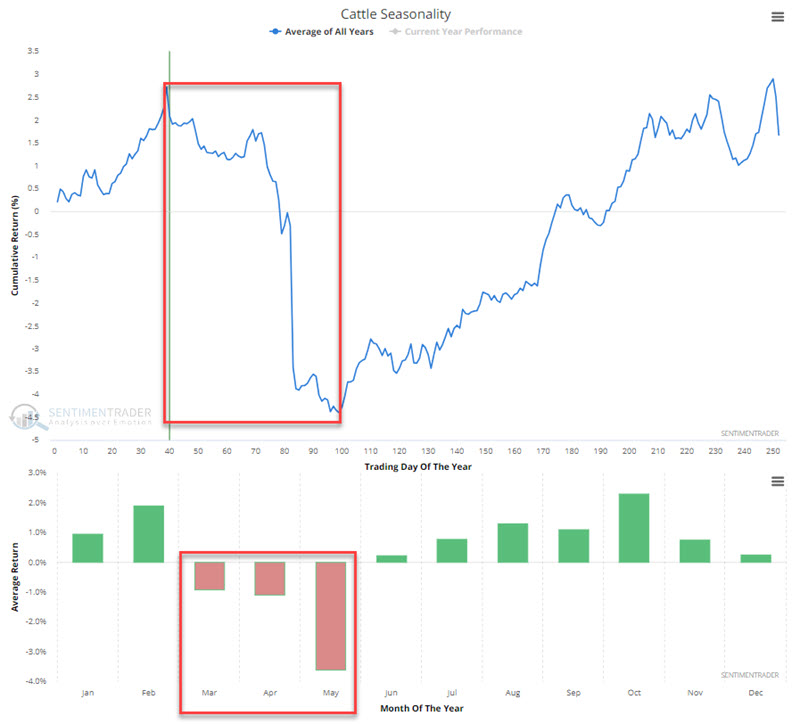
The critical period to note is the one highlighted in the red boxes. This period extends from the close of Trading Day of the Year (TDY) #39 through TDY #99 and encompasses most of March, April, and May. For 2024, this period extends from the close on 2024-02-27 through the close on 2024-05-22.
Using our new "Growth of $1" feature in our seasonality charts, we see the hypothetical Growth of $1 invested in Live Cattle only during this seasonal period each year starting in 1985. The results speak for themselves.
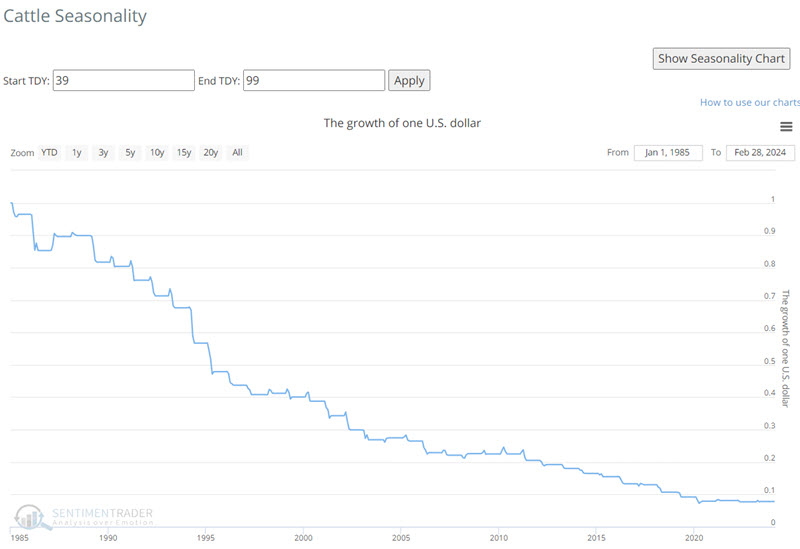
Note that for the sake of perspective and treating all markets and ETFs similarly, the Growth of $1 feature is based on percentage price changes. For futures markets, the actual dollar value gained or lost from holding a long (or short) position depends upon the contract size and the dollar value per point.
During these seasonal windows, live cattle rallied only 15% of the time, the average loss was about 5 times larger than the average gain, and the contract declined more than -$3,000 during 14 years while never rallying more than +$3,000.
About TradingEdge Weekly...
The goal of TradingEdge Weekly is to summarize some of the research published to SentimenTrader over the past week. Sometimes there is a lot to digest, and this summary highlights the highest conviction or most compelling ideas we discussed. This is NOT the published research; rather, it pulls out some of the most relevant parts. It includes links to the published research for convenience, and if you don't subscribe to those products, it will present the options for access.