
TradingEdge Weekly for Jun 9 - Lower volatility, more optimism, surging small caps, Nasdaq sell signals

Key points:
- The VIX "fear gauge" seems to be entering a new, lower, zone
- Risk-on behavior is becoming more common
- Sentiment surveys are showing renewed optimism
- This week, more than half of our core indicators showed optimism, the first time in more than a year
- Despite the S&P 500's new (almost) bull market, many stocks are still stuck in bear market mode
- There has been a historic plunge - then rebound - in small-caps relative to large-caps
- A couple of technical sell signals have triggered on the Nasdaq exchange
- Economic surprises in the U.S. have been much, much better than in the eurozone
- There are conflicting signals in the bond market
- Energy stocks show surprising cyclicality
- Platinum is entering a seasonal weak zone with uncomfortably high optimism
Volatility expectations continue to head lower
The Volatility Index (VIX) closed at a new 2-year low last Friday, and Dean showed that similar behavior preceded a consistent upward bias in the S&P 500. The 2-year low in the VIX coincided with a 9-month high in the S&P 500, which is also bullish.
The multi-year low in the VIX suggests the market could be transitioning from a higher volatility regime to a lower one, which is critical for traders to understand. In a reduced volatility environment, day-to-day swings are smaller, so traders must adjust their expectations.
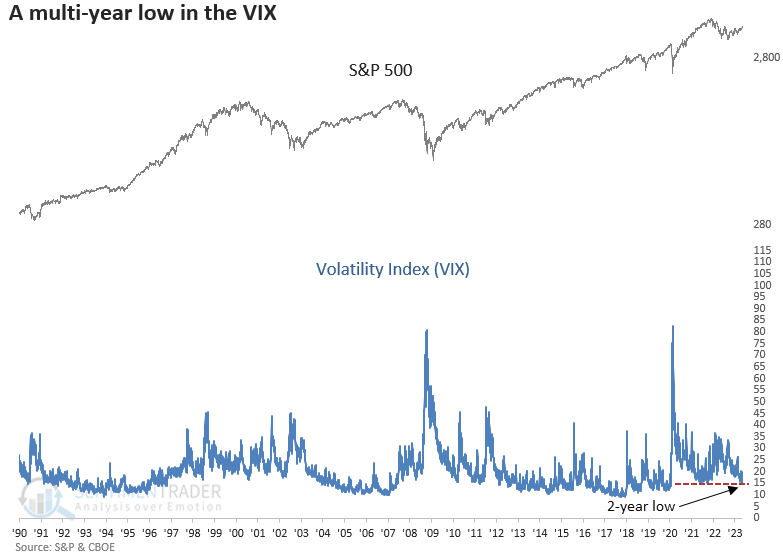
Multi-year lows in the VIX tend to occur in bull markets, not bear markets. Except for August 2000, every 2-year low in the VIX occurred in a bull phase, leading to an upward bias in stocks. The S&P hasn't had a loss over the next two weeks since 2006.
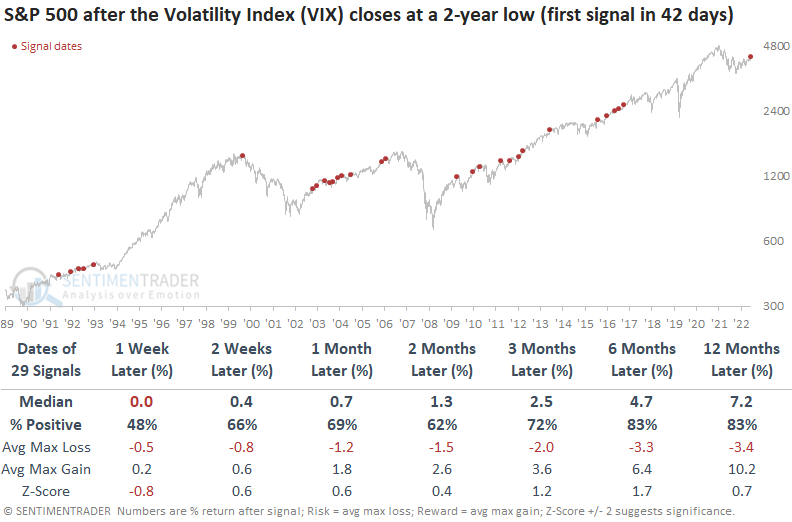
Over the first two months, the max loss exceeded -5% only three times. So, once the VIX falls to a multi-year low, the S&P 500 tends to avoid significant drawdowns in the next couple of months.
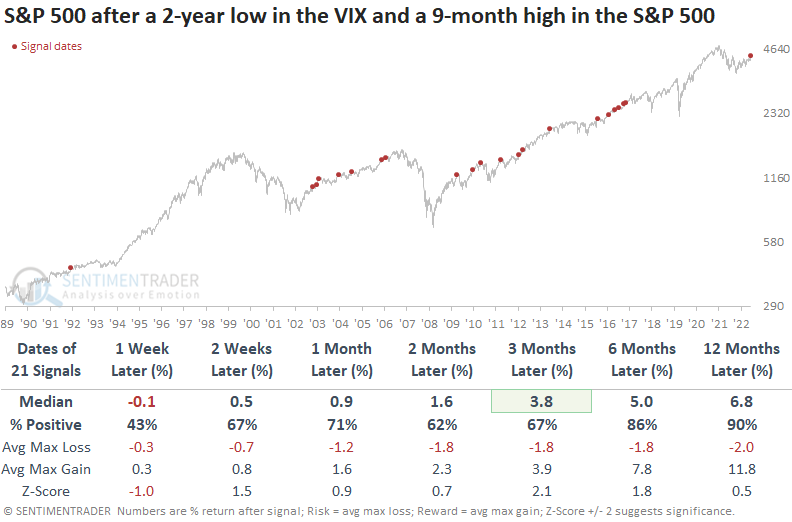
The 2-year low in the VIX coincided with a 9-month closing high for the S&P 500. Not a single instance occurred in a bear market. Once again, a max loss of greater than -5% was rare, with only three precedents over the next two months.
Risk-on behavior is becoming more common
Jay showed that investors are moving back to a risk-on position, which typically begets more aggressive buying.
The chart below displays the S&P High Beta / S&P High-Quality Relative Ratio Rank indicator over the past 10 years. This indicator compares the performance of statistically volatile stocks to that of more stable "quality" names. Ostensibly, when investors become aggressive buyers, this ratio will rise to a high level.
One way to use this information is to wait for a period of "risk off" behavior to run its course and then reverse back to the upside. The hope is that the upside reversal off of a low level will signal a reversal in the overall market. The chart below displays those times when the 20-day average for the S&P High Beta / S&P High-Quality Relative Ratio Rank indicator first fell to a very low level and then reversed back above it.
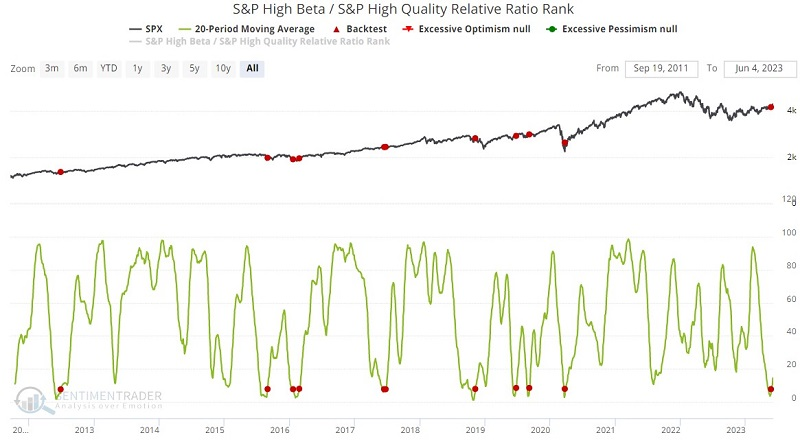
The most notable item is the relatively high Win Rates for two to 12 months after a signal. The most recent signal occurred on 2023-05-25. One caveat is that the indicator has a relatively short history.
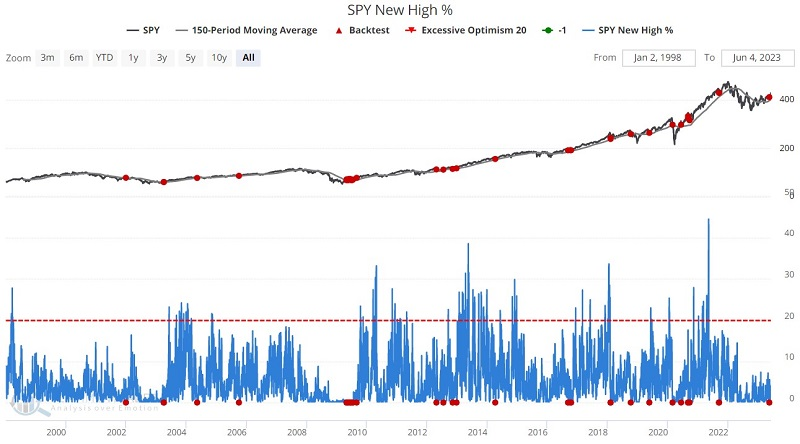
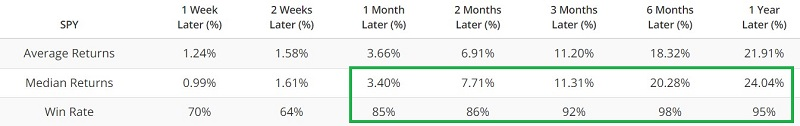
The SPY New High % Indicator shows the percentage of stocks in the SPDR S&P 500 ETF Trust ETF (ticker SPY) trading at a new 52-week high. This test will examine SPY performance after this indicator hits 0% while SPY is already in an objectively defined uptrend. This combination often highlights a short-term oversold condition in an uptrend. The chart below highlights those days with a red dot, and the table summarizes subsequent SPY performance.
Sentiment surveys are showing a renewed sense of optimism
Dean showed that the retail investor sentiment survey from AAII increased by over 15% week-over-week. Also, an equity market exposure index that measures active investment managers increased by over 36%,
The easy conclusion would be to assume that when optimism surges, like now, it's bearish for equity markets. However, more often than not, the initial push higher in optimism after an extended period of pessimism is bullish, not bearish.
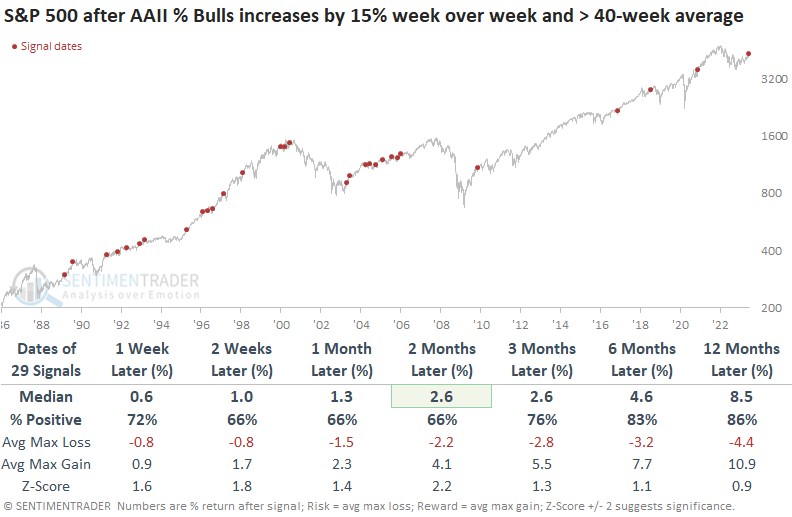
The AAII % bulls survey increased by 15% week-over-week to the highest level since November 2020. Let's assess the outlook for the S&P 500 after similar surges.
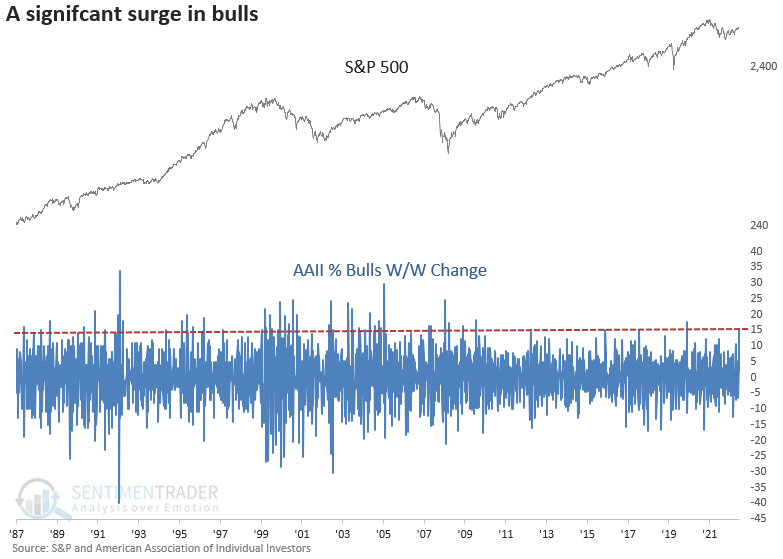
When the AAII % bulls survey increases by 15% or more, the S&P 500 showed a consistent upward bias across all time frames. Significant surges like now have become less frequent since 2006.
Suppose we add a trend filter to isolate signals when the S&P 500 trades above its 40-week moving average, like now. In that case, returns and win rates were slightly better. More importantly, significant drawdowns were less likely. Only two precedents showed a max loss of more than -5% over the next two months when the S&P 500 traded above its 40-week average.
In other surveys, The NAAIM exposure index surged by over 36%, the largest week-over-week gain since April 2021 and the 5th most significant in history. When the NAAIM Exposure Index surges like now, the S&P 500 tends to rally, with excellent results across all horizons. The survey started in 2006, so it's less battle-tested in bear markets.
The results look even better over the next six months when we add the trend filter condition to the NAAIM signals. Eventually, bullish sentiment in an uptrend impacts the S&P 500, with an uninspiring outlook a year later.
More evidence that investors are becoming more optimistic
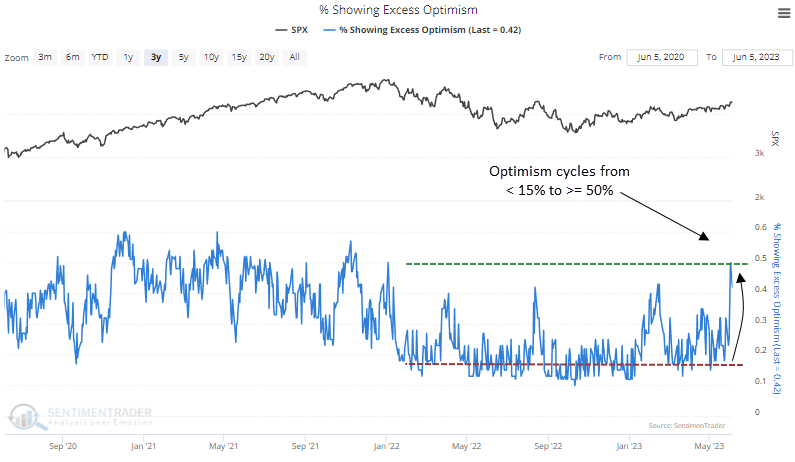
It's not just sentiment surveys that are showing renewed bullishness. Dean noted that the percentage of indicators showing excess optimism cycled from less than 15% to 50%. Similar reversals in optimism preceded an upward bias in the S&P 500 over the next year.
A decent rule of thumb is to never sell the first overbought or optimistic sentiment reading after a market transitions from a downtrend to an uptrend. While excessive optimism can lead to short-term consolidations, when investor behavior shifts upward for the first time in a new uptrend, it's typically more bullish than bearish from a big-picture perspective.
With the percentage of Sentimentrader indicators showing excess optimism surging to 50%, we have our first overbought/optimistic reading in a new uptrend.
When the percentage of indicators showing excess optimism cycles from less than 15% to 50% or greater, the S&P 500 tends to pause over the next few weeks, with 6 out of 7 precedents showing a negative return at some point. After the lull, the index trended upward over the next year with fairly consistent results.
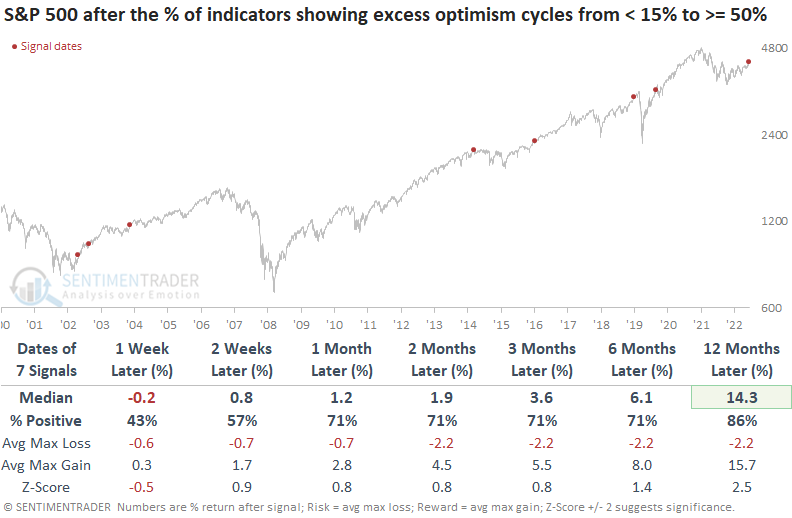
The model typically ranges from 10% to 40% in bear markets. August 2000 is the only time the indicator exceeded 50% in a significant drawdown period. The surge in optimism to 50% and a 1-year high suggests the S&P 500 could consolidate its recent gains in the next few weeks. Similar to the first study, short-term pauses tend to refresh a bullish backdrop.
The S&P moved into a new bull market, but many stocks are still in bear mode
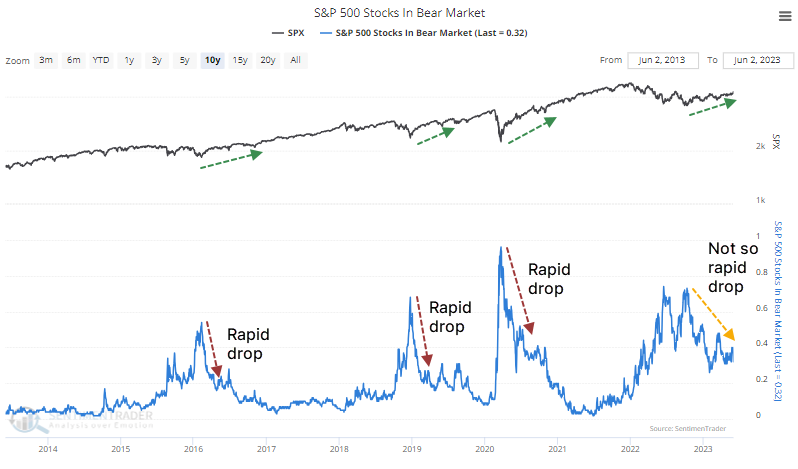
The most benchmarked index in the world has embarked on a new bull market, but nearly a third of its stocks are still mired in bear market territory.
A few qualifiers:
- We're rounding up a 19.5% or more rally from a 52-week low in the S&P 500 to call it a bull market
- It had to have gone at least 6 months without a 20% rally from a low
- A bear market is considered at least a 20% decline from a 52-week high
- These are accepted definitions regardless of their logic, so semantic police need not complain
Earlier this week, the S&P was on the cusp of rallying 20% from its most recent 52-week low, which was more than six months ago. Yet there has only been a slow, steady drip of stocks within the index that have recovered to within 20% of their latest 52-week high. This is a striking change in behavior from other rallies over the past decade.
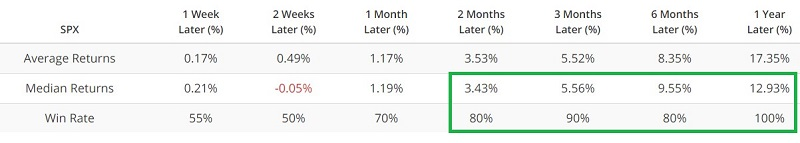
The table below shows similar environments since 1928. These are times when the S&P rallied 20% (okay, 19.5% or more, rounded) from a low, but at least a quarter of its stocks were still in bear markets.
Over the short term, the index declined almost every time. But over the next three months, the S&P was higher 7 of the 10 times, and six to twelve months later, 8 times, and with excellent median returns. The biggest sustained losses occurred in 1968 when this triggered as the S&P was at a new high (not the case now), and in 2001, which was just a purely failed signal.
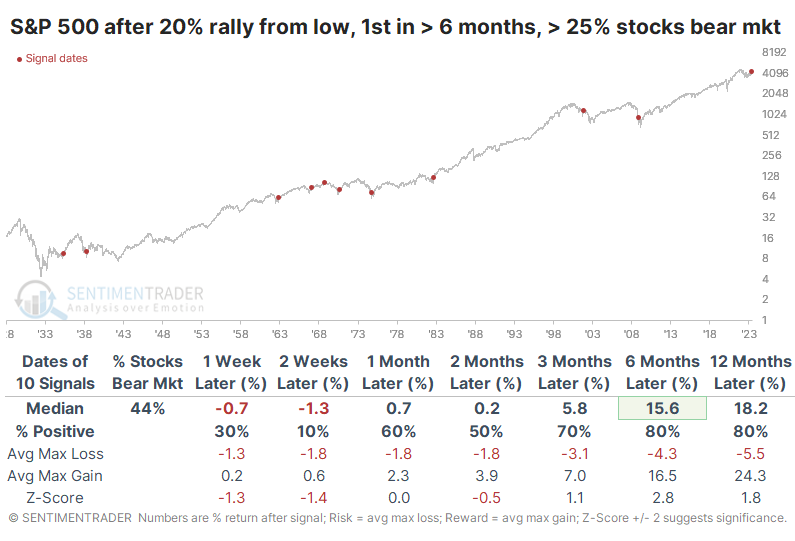
We like to look at counter-examples if possible. So, we also looked at returns when the S&P rallied 20% from a low and fewer than 25% of stocks were in a bear market. These instances were much better for forward returns, at least shorter-term. Over the next month, the S&P continued higher after 9 of the 10 signals, and the sole loser was small.
There are times when a lack of participation means that there are more stocks for value-seeking investors to buy instead of chasing all of them trading well off their lows. According to this study, the potential new bull market is being led by a handful of powerful large stocks, which seems to be a concern for the short-term at most.
A historic relative plunge - then rebound - for small-caps
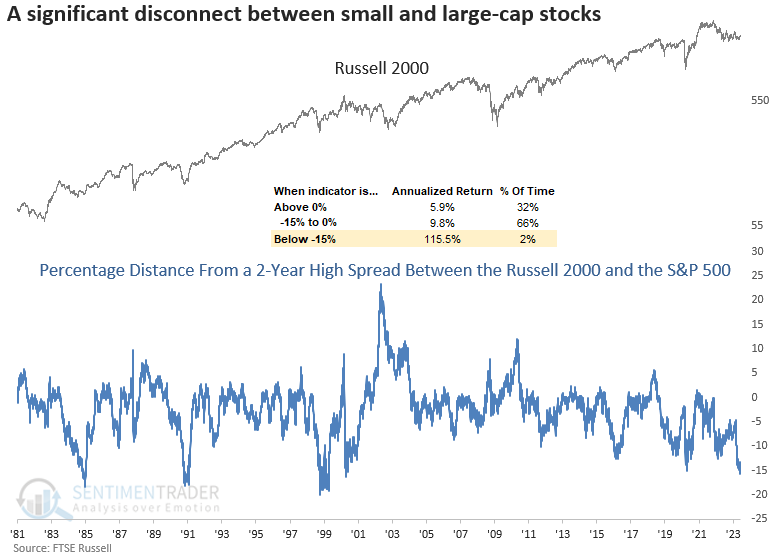
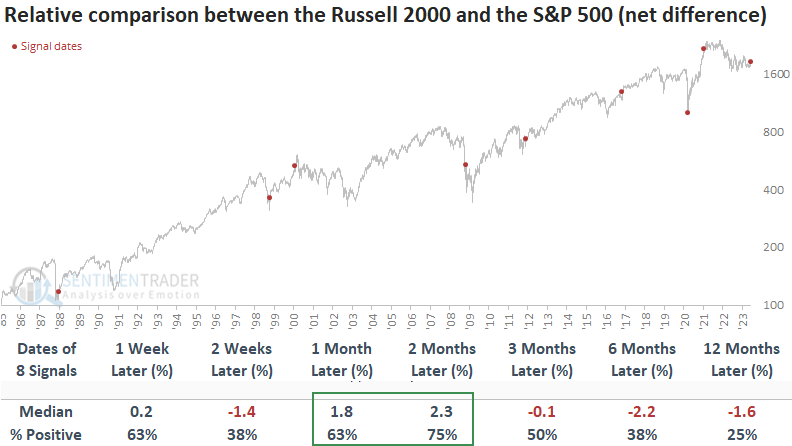
Dean showed that the distance from a 2-year high spread between small and large-cap indexes widened to a historic level and after similar disconnects, the Russell 2000 was higher from three to twelve months later every time. Several price momentum and breakout signals also triggered with bullish implications for the Russell 2000.
The distance from a 2-year high spread reached its maximum on 2023-06-01 when the Russell 2000 closed 27.62% below its 2-year high, while the S&P 500 closed 12% below its respective high. This disconnect between small and large-cap indexes is one of the most significant in history.
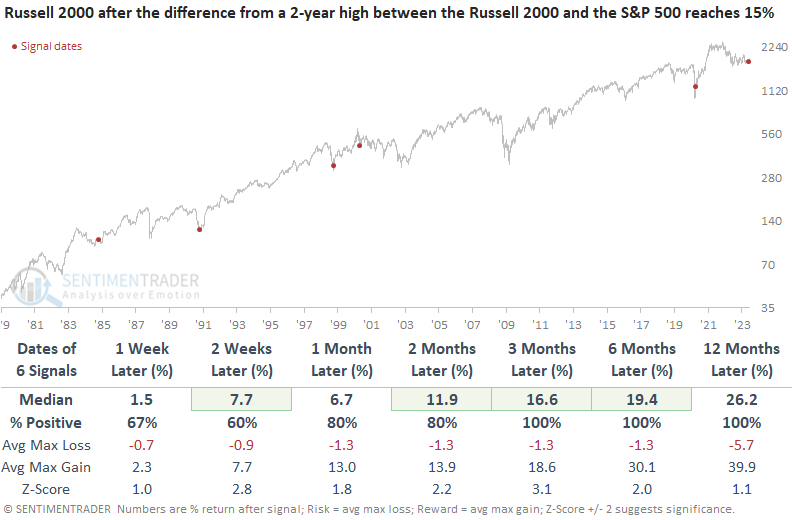
While rare, small-cap stocks ripped higher when the distance from a 2-year high spread between the Russell 2000 and the S&P 500 widened to 15%. Except for April 2000, the disconnect marked a significant inflection point for stocks near market lows.
The Russell 2000 outperformed the S&P 500 by over 2% on 2023-06-02 and 2023-06-06. Similar behavior was so rare that Dean lowered the threshold to 1.5% to increase the sample size.
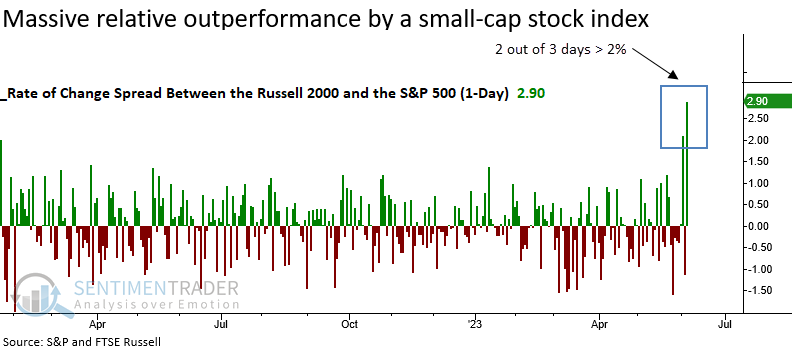
When the Russell 2000 outperformed the S&P 500 by 1.5% in two out of three days, with the pause in the middle, the small-cap index was higher two and three months later in all but one case. When comparing the Russell 2000 to the S&P 500, the window of opportunity for relative outperformance by small-caps falls in the one to two-month horizon.
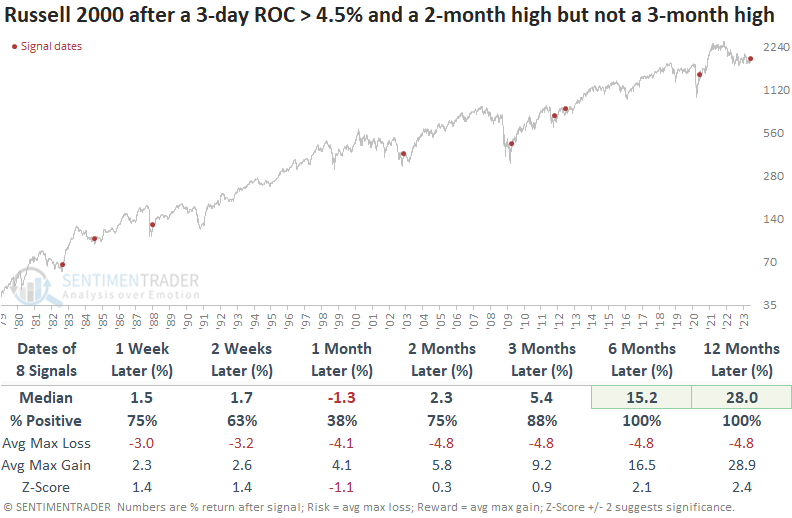
In addition, the Russell 2000 surged by more than 4.5% over three days and closed at a 2-month high but not a 3-month high. A surge in price momentum accompanied by a base breakout tends to occur near significant long-term inflection points for small-cap stocks. Six and twelve months later, the Russell 2000 was higher every time.
Nasdaq triggers some technical sell signals
Some technical sell signals have been triggered for the first time since stocks peaked a year and a half ago. We last discussed these in November 2021, and it's been a tough slog ever since.
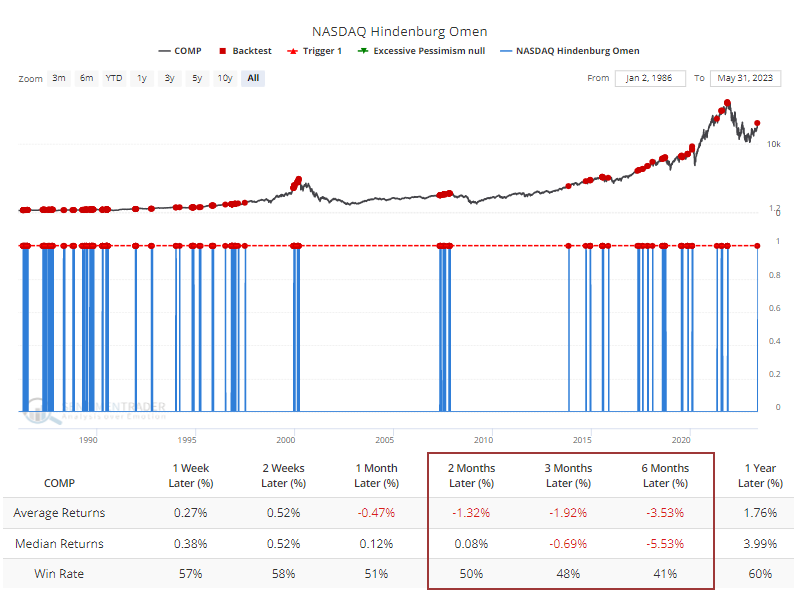
Specifically, we're referring to the Hindenburg Omen. Over the past couple of decades, we've seen the value in paying attention to clusters of these signals, even if others ignore them simply because of hyperbolic naming.
The signals have been triggered only on the Nasdaq exchange so far. Data for the NYSE haven't met the requirements for the signal. Even so, the Backtest Engine shows that when the Nasdaq triggered an Omen, returns for the Composite going forward weren't especially pleasant. Over the next six months, the Composite rallied only 41% of the time, averaging a return of a miserly -5.5%.
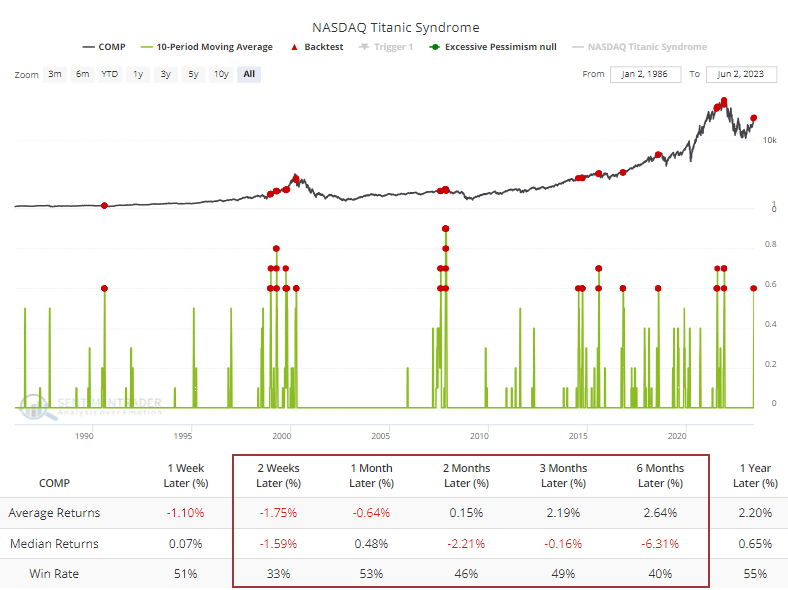
While lesser known, the Titanic Syndrome for the Nasdaq exchange has also been triggered on a handful of days over the past week or so. Clusters of days with these conditions have been the most reliable warning. The Backtest Engine shows that when at least half of the sessions over a 10-day period suffered from this technical condition, forward returns in the Composite were poor.
The chart below shows the number of combined Hindenburg and Titanic signals for the Nasdaq over five days. We just reached five signals, the first time in nearly 400 sessions that these conditions have been present to this degree.
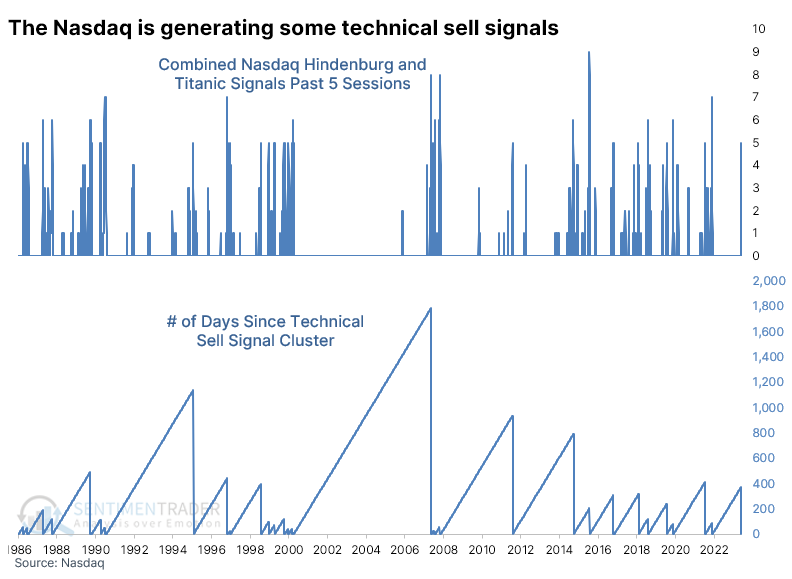
When these conditions were first triggered, the Composite tended to keep rising. Most of the time, though, the pressure was building, and much of those gains were reversed over longer time frames.
For the Nasdaq 100, it was even less of a warning. This index of big-cap Technology stocks performed quite well in the months ahead, with a gain 9 out of 10 times six months later, averaging double-digits. For the broader market, reflected in the S&P 500, these technical sell signal clusters also weren't much use as an imminent warning sign.
We pay attention whenever we see the conditions that trigger technical sell signals like the Hindenburg Omen and Titanic Syndrome. Not as an immediate reason to lighten exposure but rather to highlight the type of market environment where further gains are less likely to be sustainable.
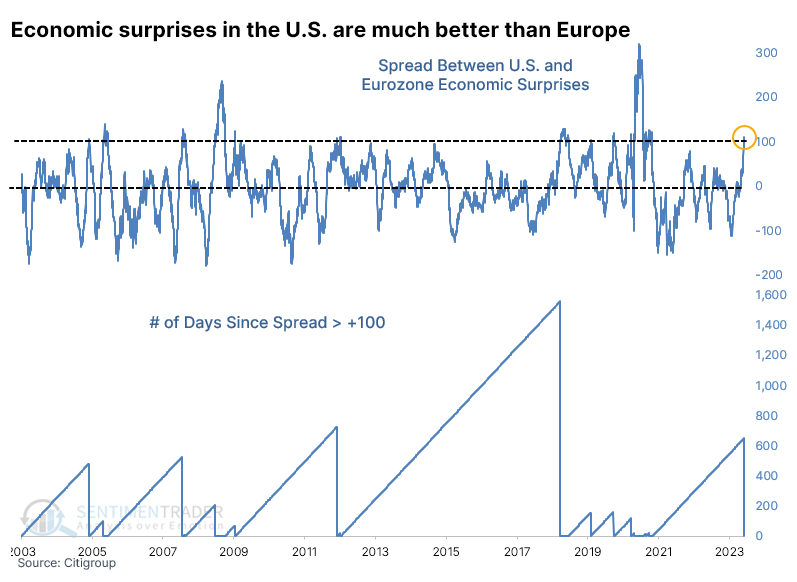
Econ surprises have been much better in the U.S. than the eurozone
After a wretched 2022, stocks in the eurozone enjoyed a ripping rally off the fall lows, which continued into April of this year. It has only been in recent weeks that the U.S.-based S&P 500 has retaken its leadership position.
We wouldn't know this by studying the flurries of economic reports. Based on those, the U.S. has massively outperformed the eurozone for months, and the spread is getting wider. Recently, the Citi Economic Suprise Index for the U.S. was more than 100 points higher than the same index for the eurozone. That's the widest spread favoring U.S. economic conditions in nearly three years.
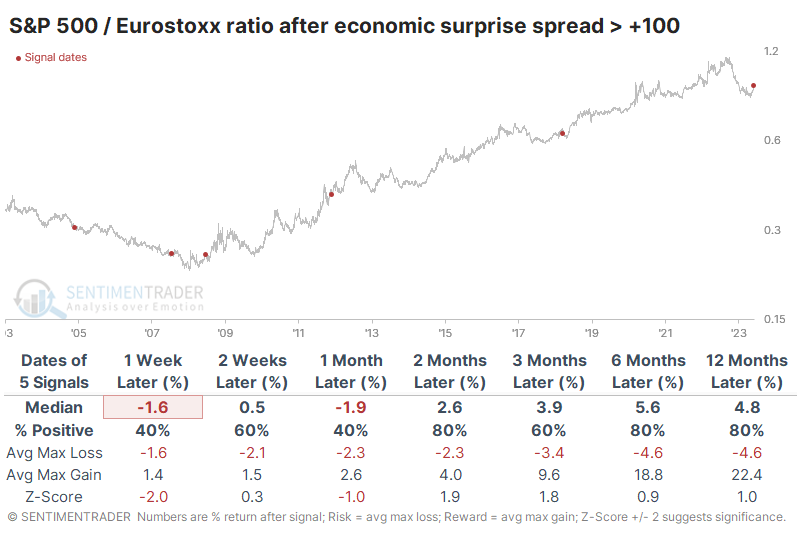
For the S&P, it preceded medium-term rallies a few times and significant declines a couple of times, thanks to the 2008 financial crisis. The Euro Stoxx 50 (priced in U.S. dollars) showed poor returns over the next six months. Only a single signal sported a positive return, and that was just barely.
When we look at the ratio of the S&P 500 to Euro Stoxx 50 (in dollars), then we can see that - as much as we can conclude from a sample size of five - similar spreads in economic performance also favored gains in the S&P relative to the Euro Stoxx. Over the next two to twelve months, the S&P consistently tended to give investors better returns.
An outperformance of U.S. assets over eurozone assets was also evident with the currencies. If we look specifically at the U.S. dollar / euro cross, it pretty much matches the U.S. Dollar Index but was a bit better depending on which metric one prefers.
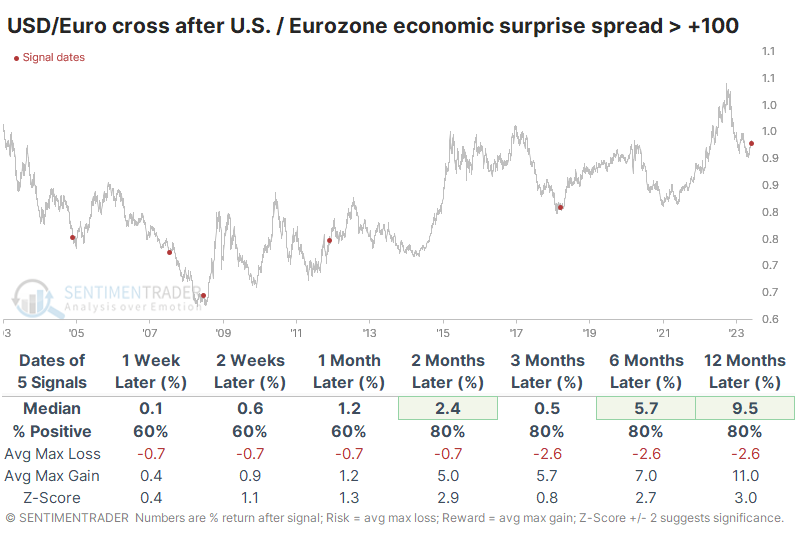
We've learned time and again over the years that the economy is not the market, no matter which market we're talking about but usually stocks. This is one of the relatively rare examples when there is a more linear relationship between economics and markets. While it's hard to rely too much on a tiny sample size, when economic surprises in the U.S. far outpaced those in the eurozone, it showed a consistent tendency to lead to better returns in U.S. stocks and the dollar than eurozone stocks and the euro.
Conflicting signals for bonds
Jay noted that Treasury bonds have been in a bear market since peaking during the Covid panic. Long-term prospects for bonds remain murky, but a decent trading opportunity may be in the offing.
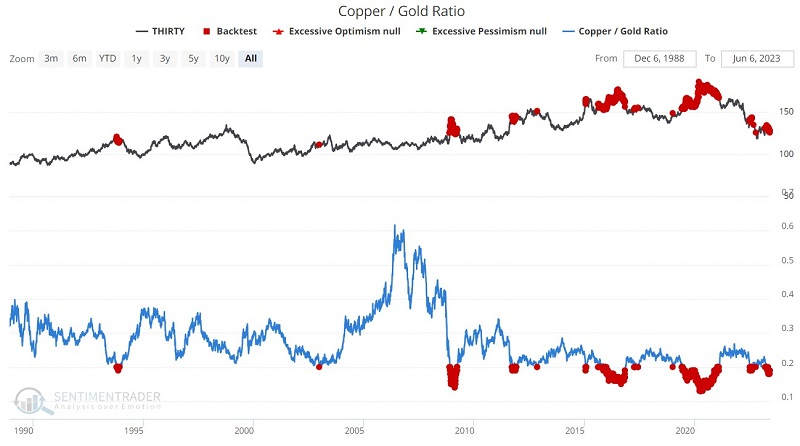
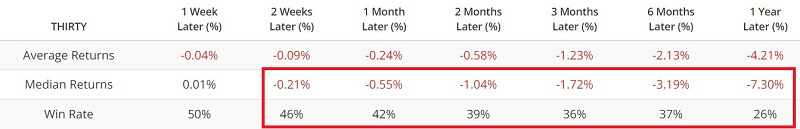
The copper/gold ratio has a long history of being somewhat inversely correlated to interest rates. A lower and/or declining ratio suggests higher rates (lower bond prices) and vice versa. The chart below highlights when the Copper/Gold Ratio was below 0.20, showing that future returns on long bonds were poor.
Another measure that can impact the bond market is consumer confidence. When the University of Michigan Consumer Confidence was below 60 as it is now, 30-year bond futures showed a positive return six months later only 18% of the time.
But...
The chart below displays the annual seasonal trend for 30-year treasury bond futures. Note the favorable seasonal period that extends from Trading Day of Year (TDY) #111 through TDY #168. For 2023 that period extends from the close on 2023-06-06 Through 2023-08-24.
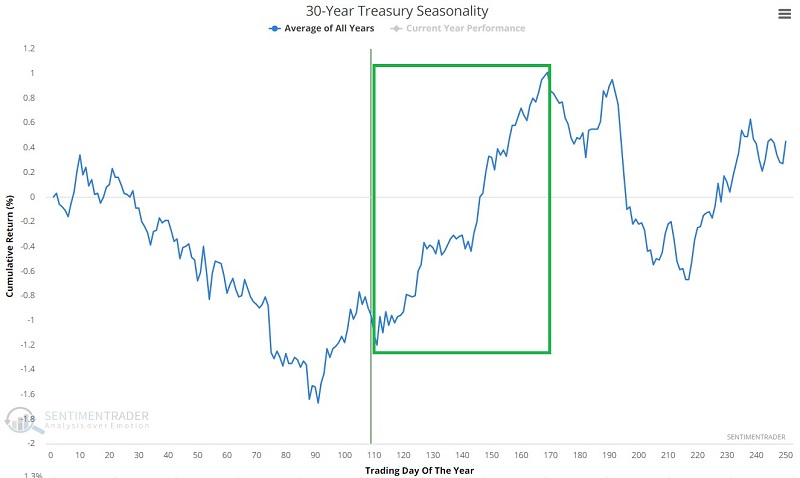
These seasonal windows showed a gain 71% of the time, and bonds were three times more likely to show a large gain than a large loss.
Bond prices are often favorable when trader sentiment plunges to a washed-out level and then reverses. The chart and table below highlight TLT performance after the 10-day average for 10-Year Optix crossed above 7.5.
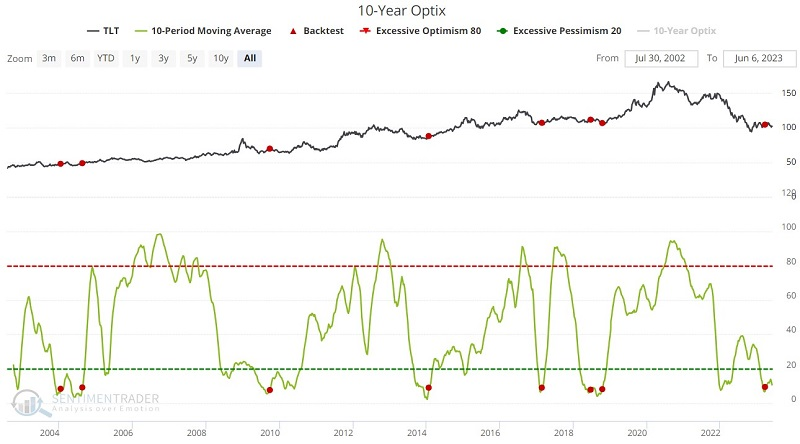
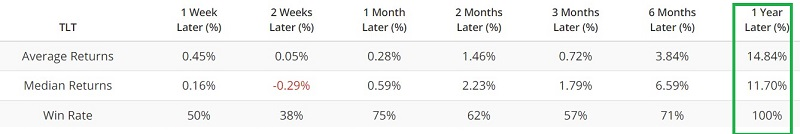
The most recent signal on 2023-03-28 has seen TLT decline slightly over 2%. When paired with a more favorable seasonal period, there is reason for hope among bullish bond traders.
Also, the TLT Open Interest Ratio indicator shows the number of outstanding put options divided by the number of outstanding call options. When there were few puts relative to calls (like now), TLT tended to rise.
Based on the very long-term nature of interest rate movements, it is easy to be pessimistic regarding the multi-year outlook for treasury bonds. Nevertheless, enough evidence (Seasonality, bond trader sentiment, options trader sentiment, and price action that has not seen a new low since October 2022) is piling up on the favorable side of the ledger to alert shorter-term traders of a potential bullish opportunity.
Energy stock cycles
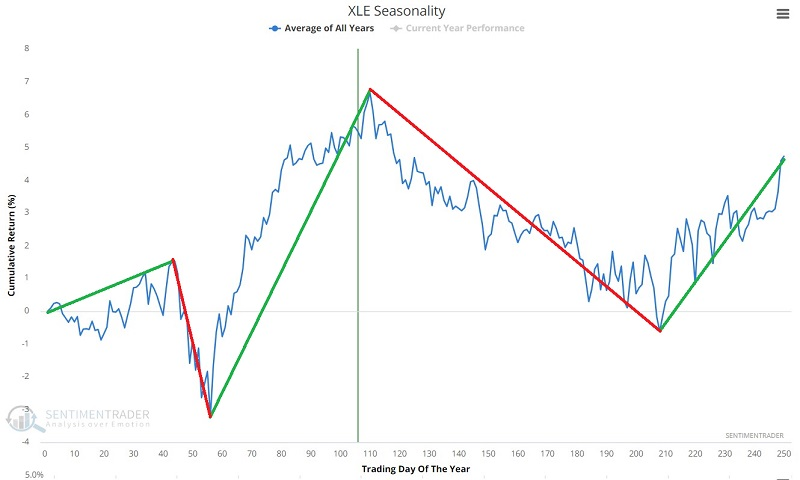
The energy sector has shown consistent cyclicality in the past 25 years. Jay noted that seasonality is usually best not used as a standalone trading model but an important change in seasonal bias is approaching.
The chart below displays the annual seasonal trend for the Energy Select SPDR ETF (ticker XLE).
Let's focus solely on the two favorable periods. The chart below assumes a trader held XLE during TDY #208 through #44 and from TDY #56 through TDY #110 every year. The cumulative gain was +3,680%. It uses a log chart to more accurately reflect the returns.
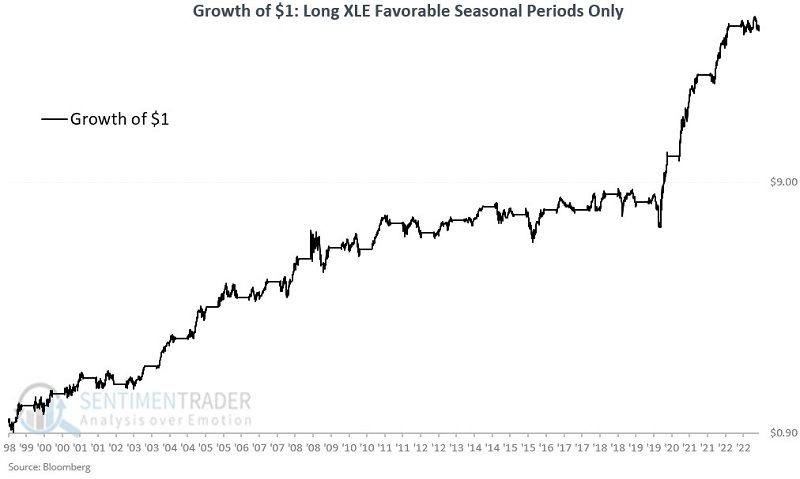
To highlight the potential dangers in relying on seasonality as a standalone trading method, note that holding XLE only during the favorable periods would have required a trader to sit through three separate drawdowns of -30%.
Now, let's focus solely on the two unfavorable periods. The chart below assumes a trader held XLE during TDY #44 through #56 and from TDY #110 through TDY #208 every year. The cumulative return was -88%.
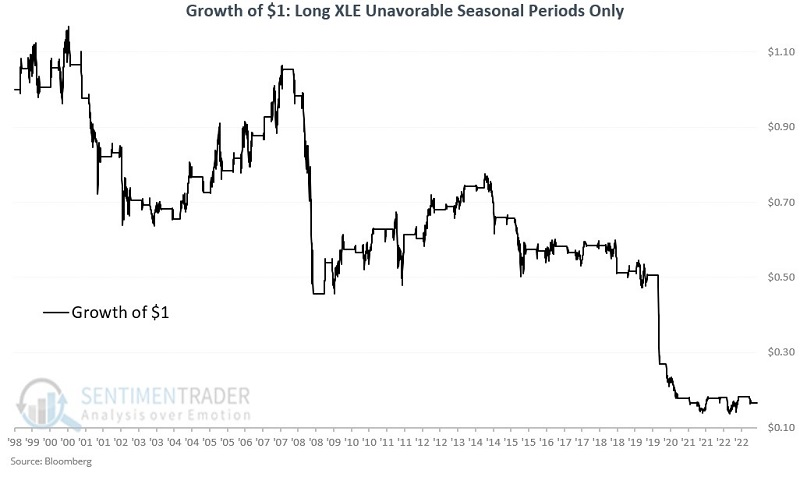
There is a right way and a wrong way to use seasonality. As compelling as the results above may be, we rarely advocate holding (or not holding) something solely because of the date on the calendar. Seasonality is best used to tell a trader or investor where to look and which way to lean.
A pretty poor period for platinum
Platinum is entering a very unfavorable seasonal period. Jay noted that there are no guarantees that platinum will decline during this period in 2023, but sentiment has also recently flashed a potential warning sign.
An unfavorable period for platinum extends from the close of Trading Day of Year (TDY) #113 through TDY #128. For 2023, this period extends from the close on 2023-06-08 through 2023-06-29. The chart below displays the hypothetical cumulative $ +(-) from holding a long position in platinum futures only from the close of TDY #113 through TDY #128 every year since 1987.
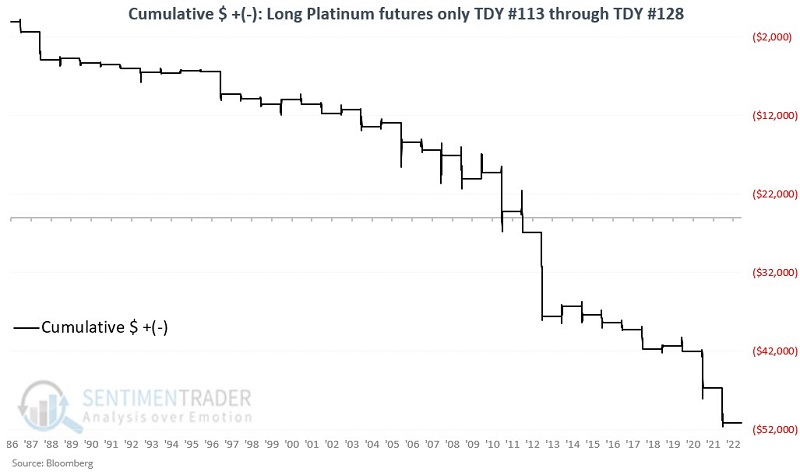
During these windows, platinum rallied during only 22% of the years, with an average loss that was almost four times larger than the average gain. There was a single year that showed a gain of more than $1,000, compared to fifteen years that suffered a loss larger than -$1,000.
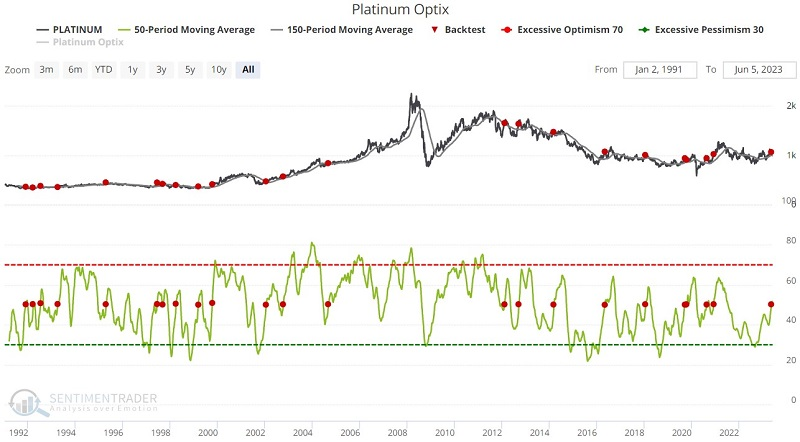
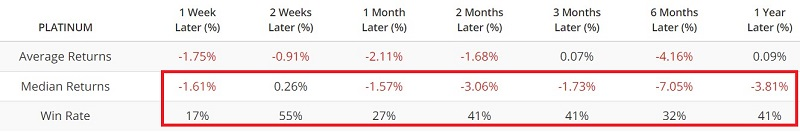
In addition, the chart below highlights each date when the 50-day moving average of our Platinum Optimism Index (Optix) crossed above 50% while platinum futures were above their 150-day moving average. While the results are not uniformly bearish, on many occasions, a nascent rally in platinum often ran out of steam shortly after a signal.
About TradingEdge Weekly...
The goal of TradingEdge Weekly is to summarize some of the research published to SentimenTrader over the past week. Sometimes there is a lot to digest, and this summary highlights the highest conviction or most compelling ideas we discussed. This is NOT the published research; rather, it pulls out some of the most relevant parts. It includes links to the published research for convenience, and if you don't subscribe to those products, it will present the options for access.