
TradingEdge Weekly for Jun 6 - Risk on, healthy environment, bond timing

Key points:
- Consumer confidence is rebounding quickly
- Consumers are also suddenly more interested in stocks
- May's momentum is notable after three down months
- Risk Appetite is back in risk-on mode
- The Market Environment has flipped to healthy
- Financial conditions are easing
- More indicators are suggesting a favorable background for stocks
- Stocks in offensive sectors are triggering trend score buy signals
- Use a credit default index to time the bond market
Consumers are coming around fast
Consumer Confidence jumped in May, with one of the largest monthly increases in nearly 60 years.
This matters for investors. When Confidence rises, meaning that it's higher this month than last, the S&P 500's next-month return tends to vastly outperform the alternative. Since 1967, when Confidence rose, $10,000 turned into $153,536. When Confidence declined, $10,000 turned into only $43,840.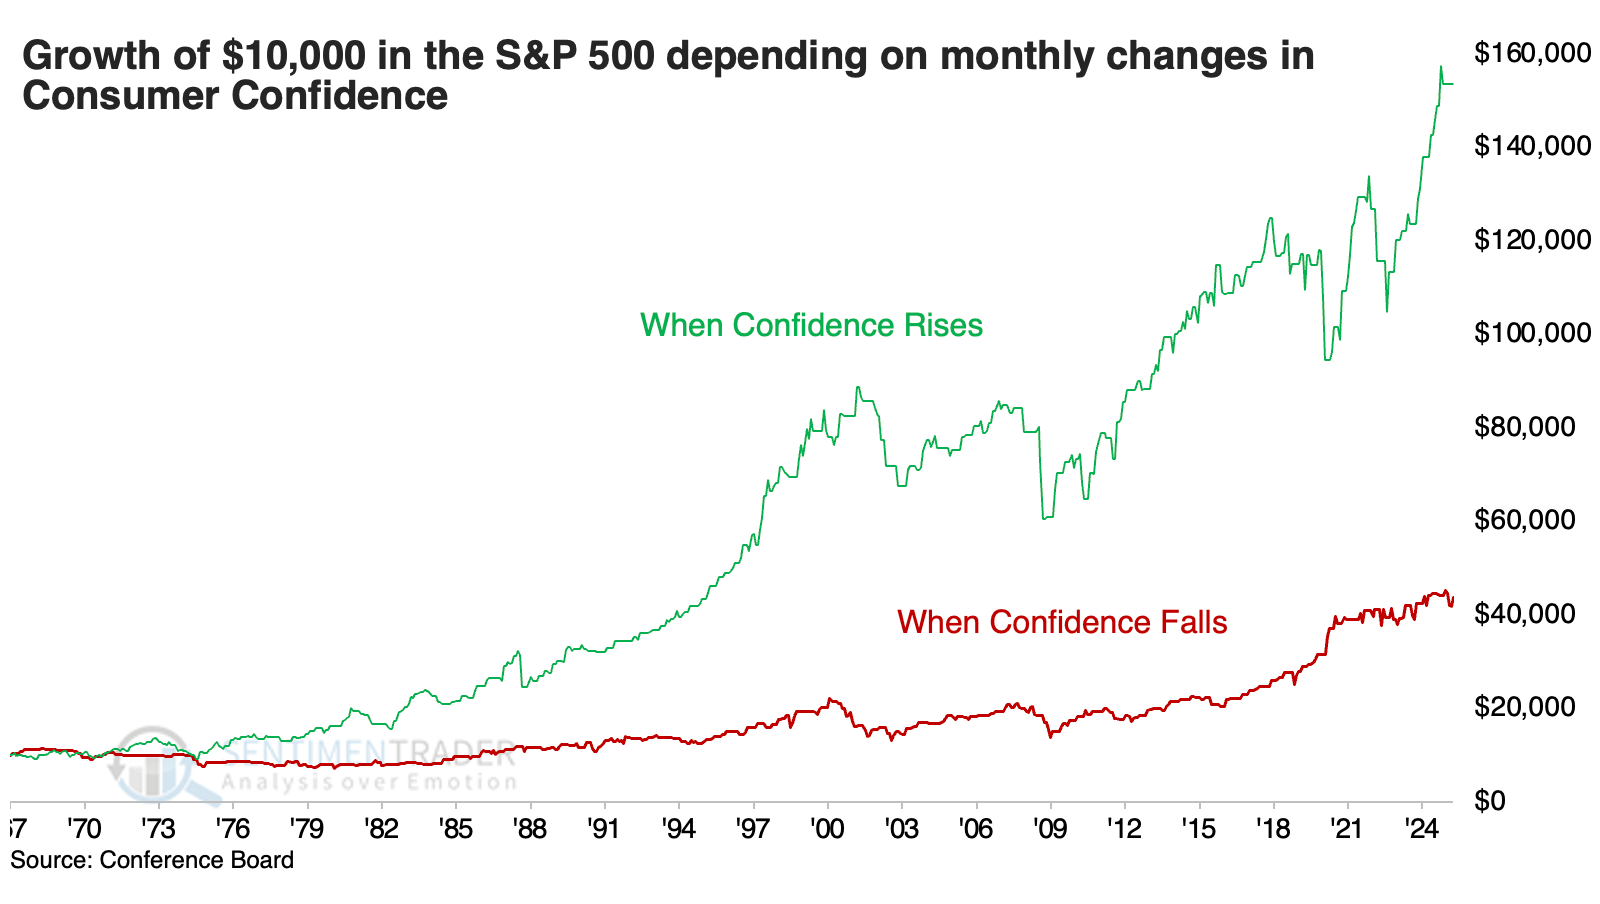
That should be a good sign, since the latest reading showed a significant jump in Confidence. The current month's rise ranks in the top 2% of all monthly changes over the past 58 years.
The table below shows that when Confidence rises more than ten points in a month and remained below 100, the S&P 500's returns in the months ahead were excellent. It suffered only two losses over the following two months, and the reward was significantly larger than the risk.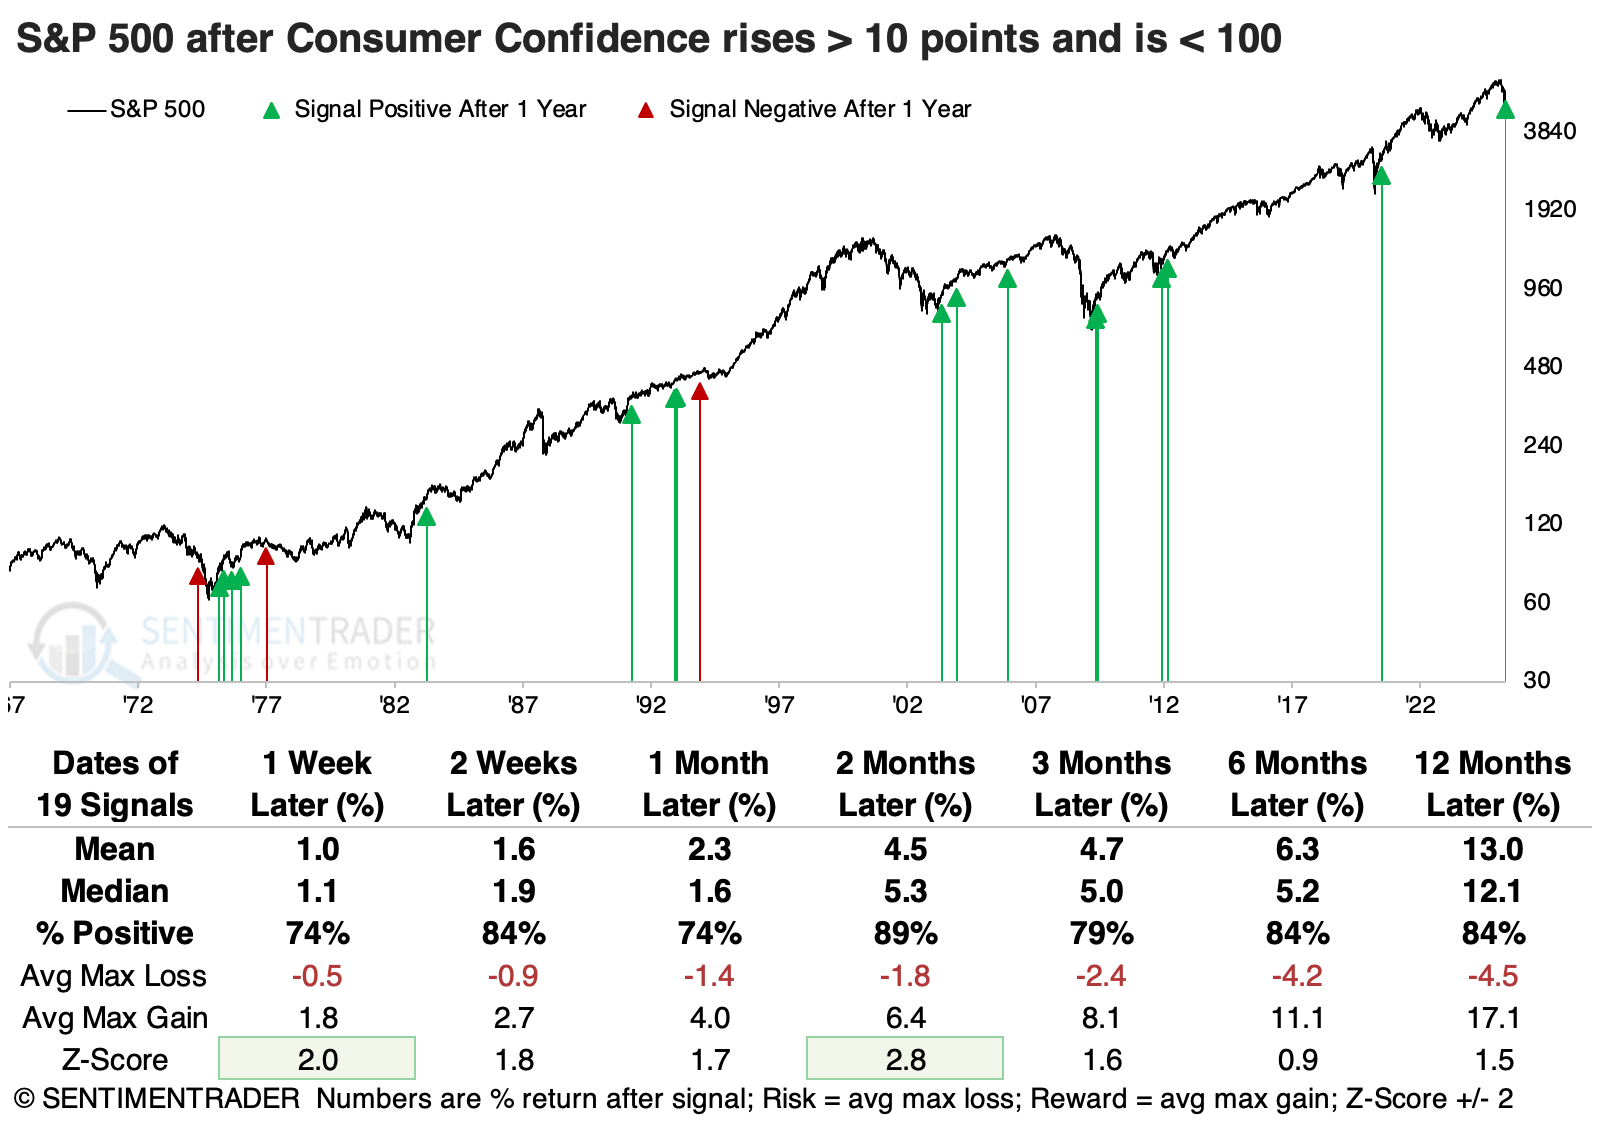
The fact that Confidence jumped when it was still somewhat depressed is a positive sign. When there was a big monthly jump and the reading was over 100, future returns were significantly less favorable.
Consumers also quickly adjusted their expectations for the stock market, with one of the biggest jumps in the percentage of people expecting prices to rise rather than fall.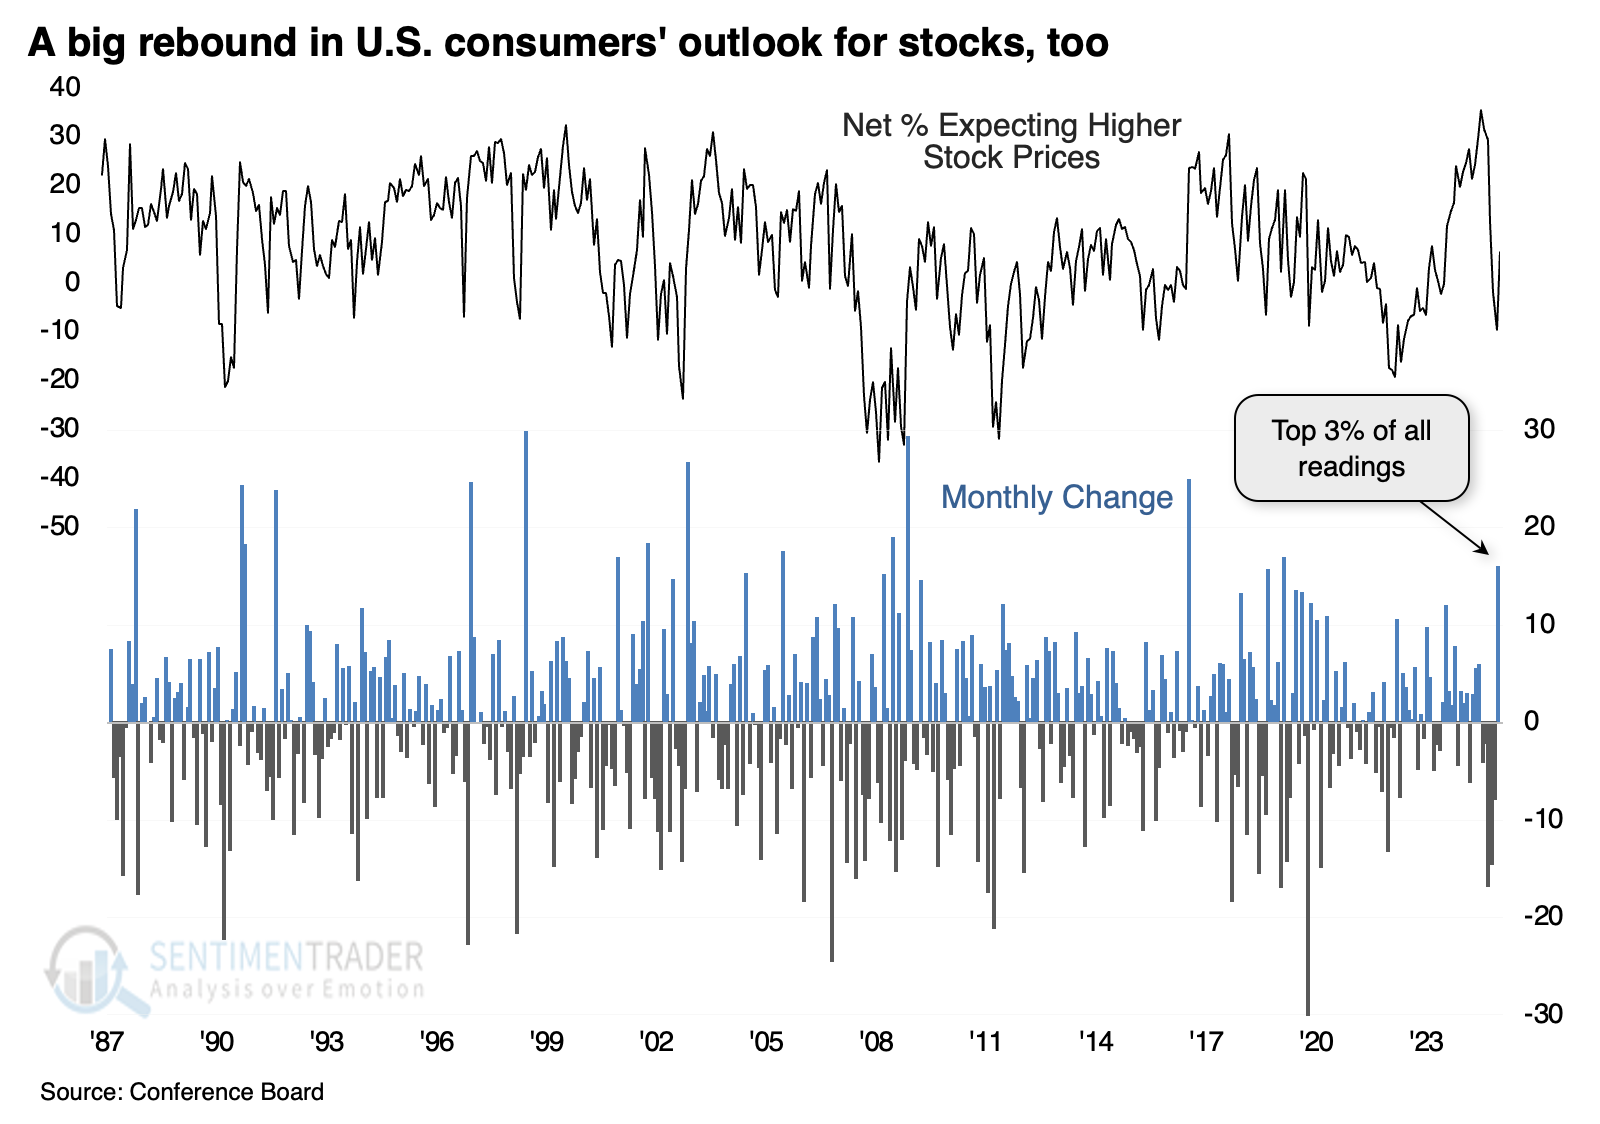
Contrarians like to think everything is a contrarian sign, but that hasn't been the case most of the time with big jumps in expectations. Outside of the 2001 and 2008 bear markets, returns were universally positive. It was the same situation when expectations turned positive after two or more months of investors expecting stocks to decline. The only losses over the following six to twelve months were in 2001.
Jay further highlighted a development in consumer confidence.
The chart below highlights all dates (including overlaps) when the Conference Board - Stocks index crossed above -7. The most recent signal occurred on 2025-05-30.
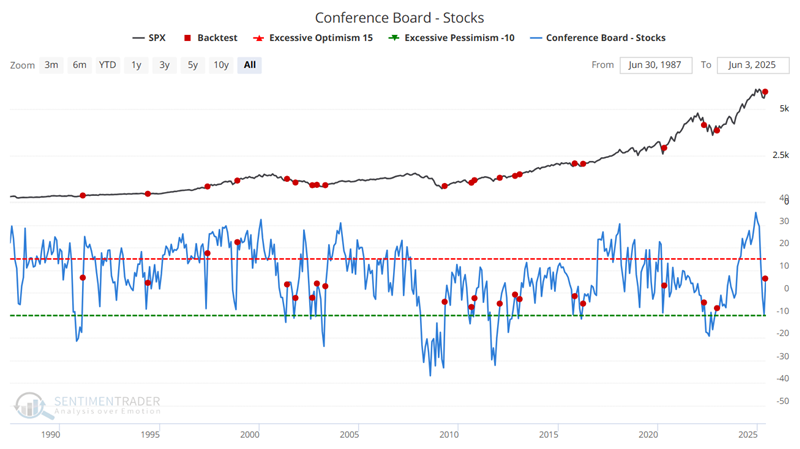
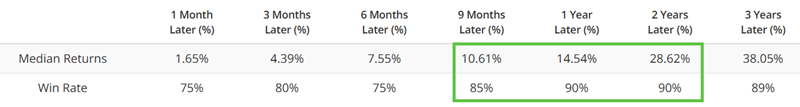
The nine-month and one-year timeframes show excellent overall performance.
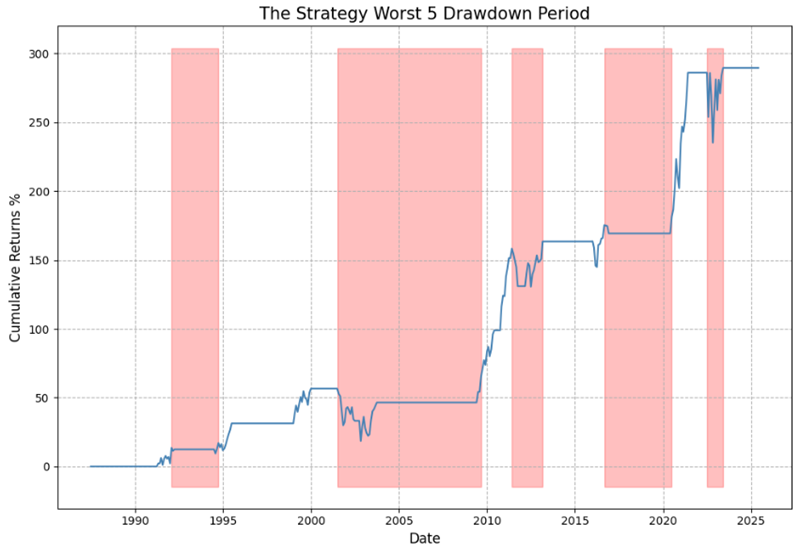
The chart below displays the hypothetical equity curve for holding the S&P 500 index for one year after a new signal. Equity curves help us understand the nature of performance - i.e., the consistency (or lack thereof) of gains and the "bumps in the road."
Unsurprisingly, technology has been the most consistent performer in this bullish market environment.
May momentum
The S&P 500 showed a gain of more than 5% for the month of May. Jay noted that the stock market has tended to perform better than average following 5+% months.
May 2025 showed the S&P 500 registering a monthly gain of +6.2%. This is not an uncommon occurrence. Post World War II, there have been 120 months that have registered a gain of 5% or more.'
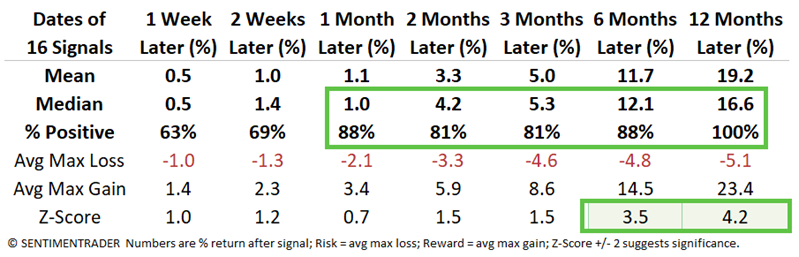
However, the study below will highlight only those occasions when the S&P 500 rose 5% or more during a calendar month after at least three consecutive declining months. The S&P performed well, with a 100% win rate over the following year.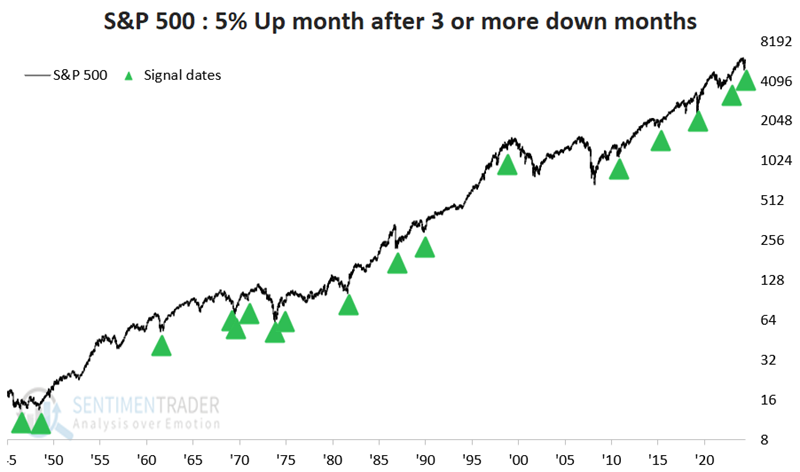
The chart below displays the hypothetical growth of $1 invested only during the 12 months after each date listed above (if a new signal occurs within 12 months of the previous signal, the holding period is extended for another 12 months).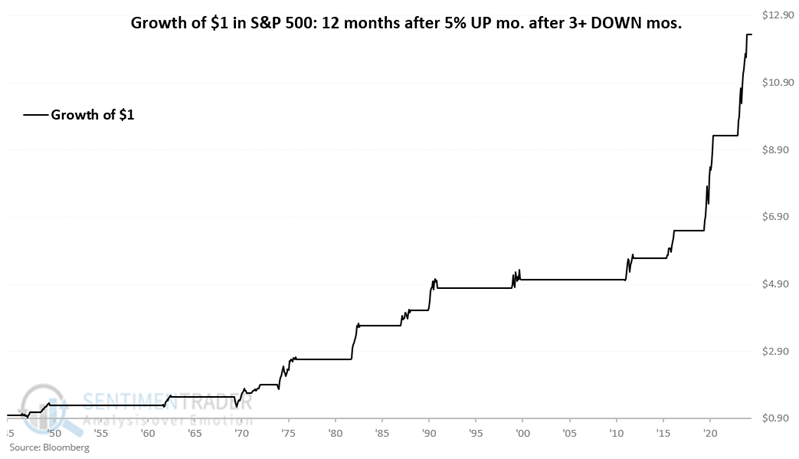
Small-cap and value stocks enjoyed among the highest average returns after these signals.
Risk is back on
The Sentimentrader Risk On/Off Indicator rose above 67%, shifting the composite to risk-on status. Dean showed that similar risk-on regimes significantly outperformed risk-off regimes.
Since plunging to an extremely low reading of 4.76% on April 8th, coinciding with the bottom in major stock indexes, the SentimenTrader Risk-On/Off Indicator, a composite of 21 diverse sentiment and breadth-based measures, has steadily climbed, signaling a broad recovery in investor appetite for risk.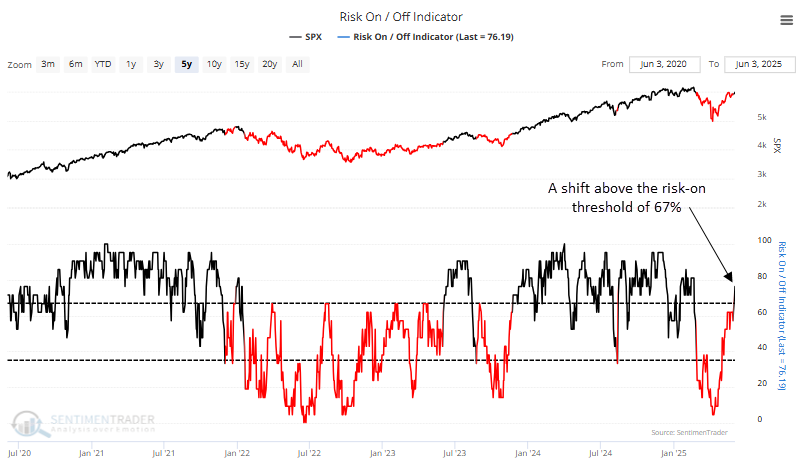
The timeliness of the most recent shift back to a risk-on status was less than ideal, primarily due to the lagging nature of slower-moving components that require time to recalibrate. This misalignment is not uncommon in V-shaped market recoveries, where the pace of rebound outstrips the ability of specific models to adjust quickly.
A $10,000 investment in the S&P 500 grows to $30,743 when the Risk-On/Off indicator rises above 67% and stays above 35%. In contrast, if the indicator falls below 35% and remains under 67%, the investment increases to just $13,743.
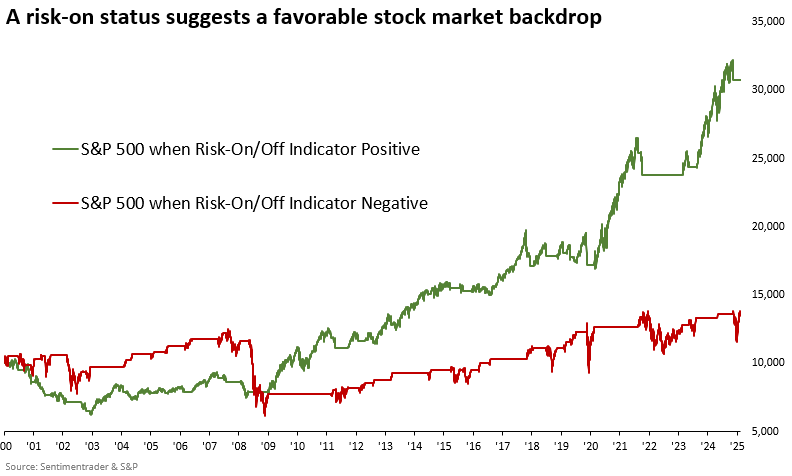
Whenever the Risk-On/Off indicator cycled from below 35% to above 67%, signaling broad bullish alignment among components, the S&P 500 advanced 90% of the time over the following year with a median gain of 12%.
Cyclicals were the top-performing sectors, with technology emerging as the standout, outperforming the S&P 500 across all periods and achieving the highest one-year gain.
Offensive sectors, such as technology, industrials, communication services, and consumer discretionary, hold the largest share of stocks with relative ratios hovering near the upper end of their ranges, indicating relative strength.
The environment is turning positive, too
Stocks are doing very well. A healthy market environment helps the sustainability of the advance, making it less likely we're witnessing a bear market rally.
The tech team at SentimenTrader has codified it and updates it daily on the site, making it available for saving and testing. The composite is based on 8 core, basic indicators, so when the majority of them are healthy, stocks tend to do well with less risk.
Investors (and traders) have been best served by focusing on long setups or becoming more aggressive when the Environment is healthy. Since 1998, when the version shown on the website originated, the S&P 500's annualized return was +10.7% when the composite was 5 or better. That compares to +6.8% when the composite was below 5.
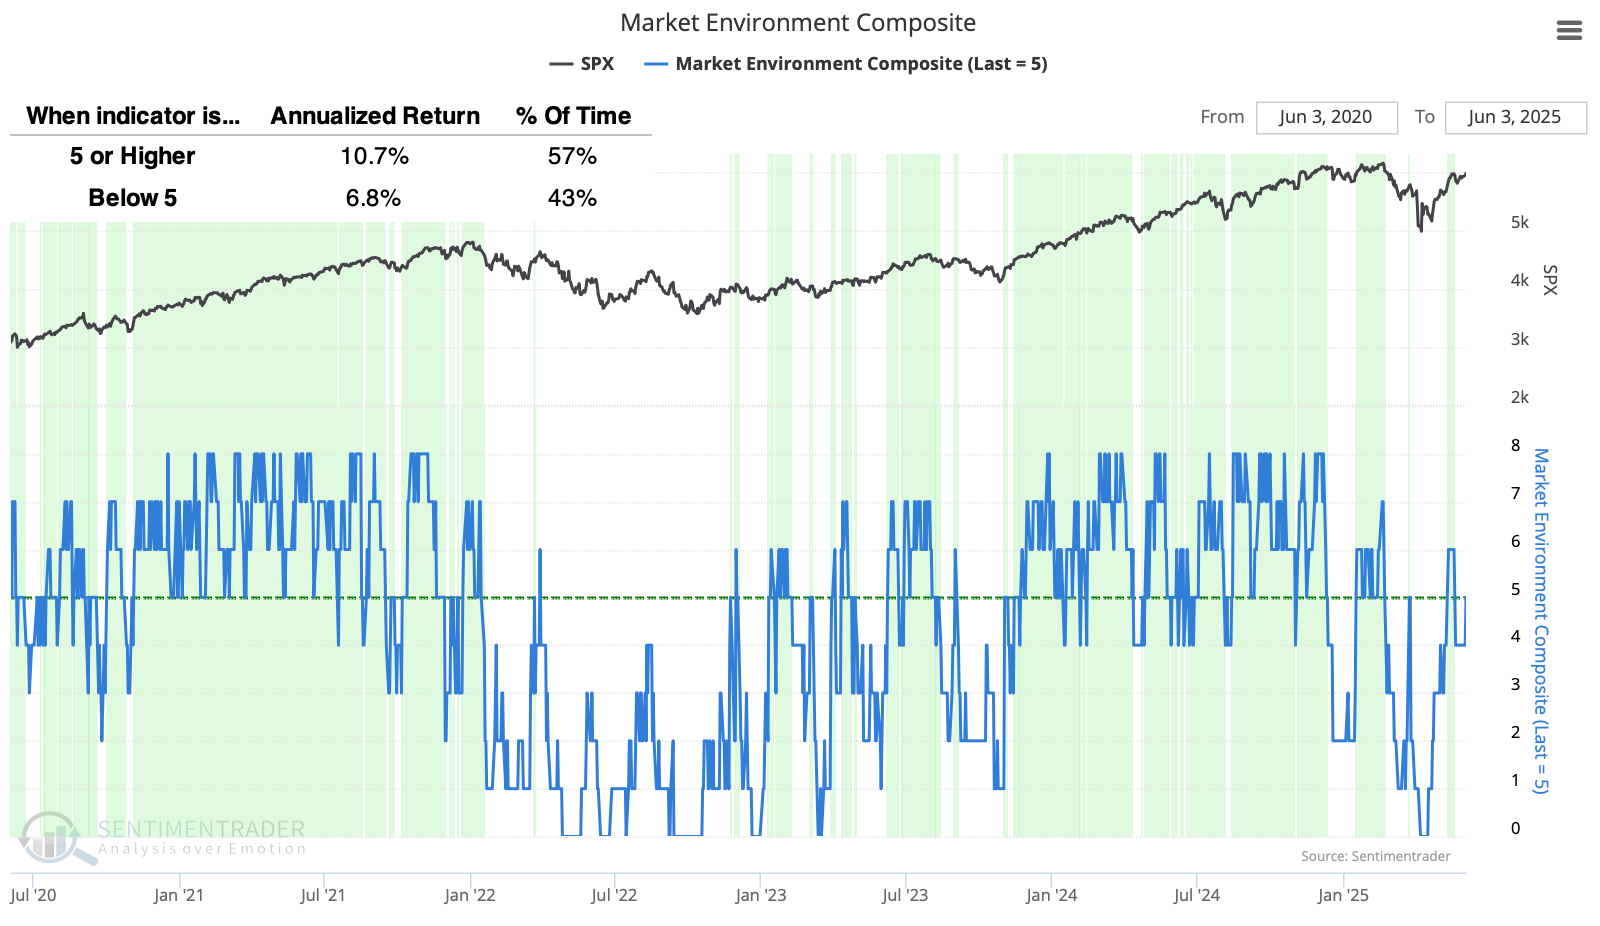 During healthy environments, $10,000 in the S&P 500 grew to more than $43,000 while suffering a maximum drawdown of only -13%.
It was more useful in higher beta indices like the Nasdaq Composite. Since 1998, an investor would have earned nearly as much as buy-and-hold while being in the market only 57% of the time, and suffering a drawdown only a third as large as buy-and-hold (ignoring taxes and transaction costs). It was a similar story in the small-cap Russell 2000.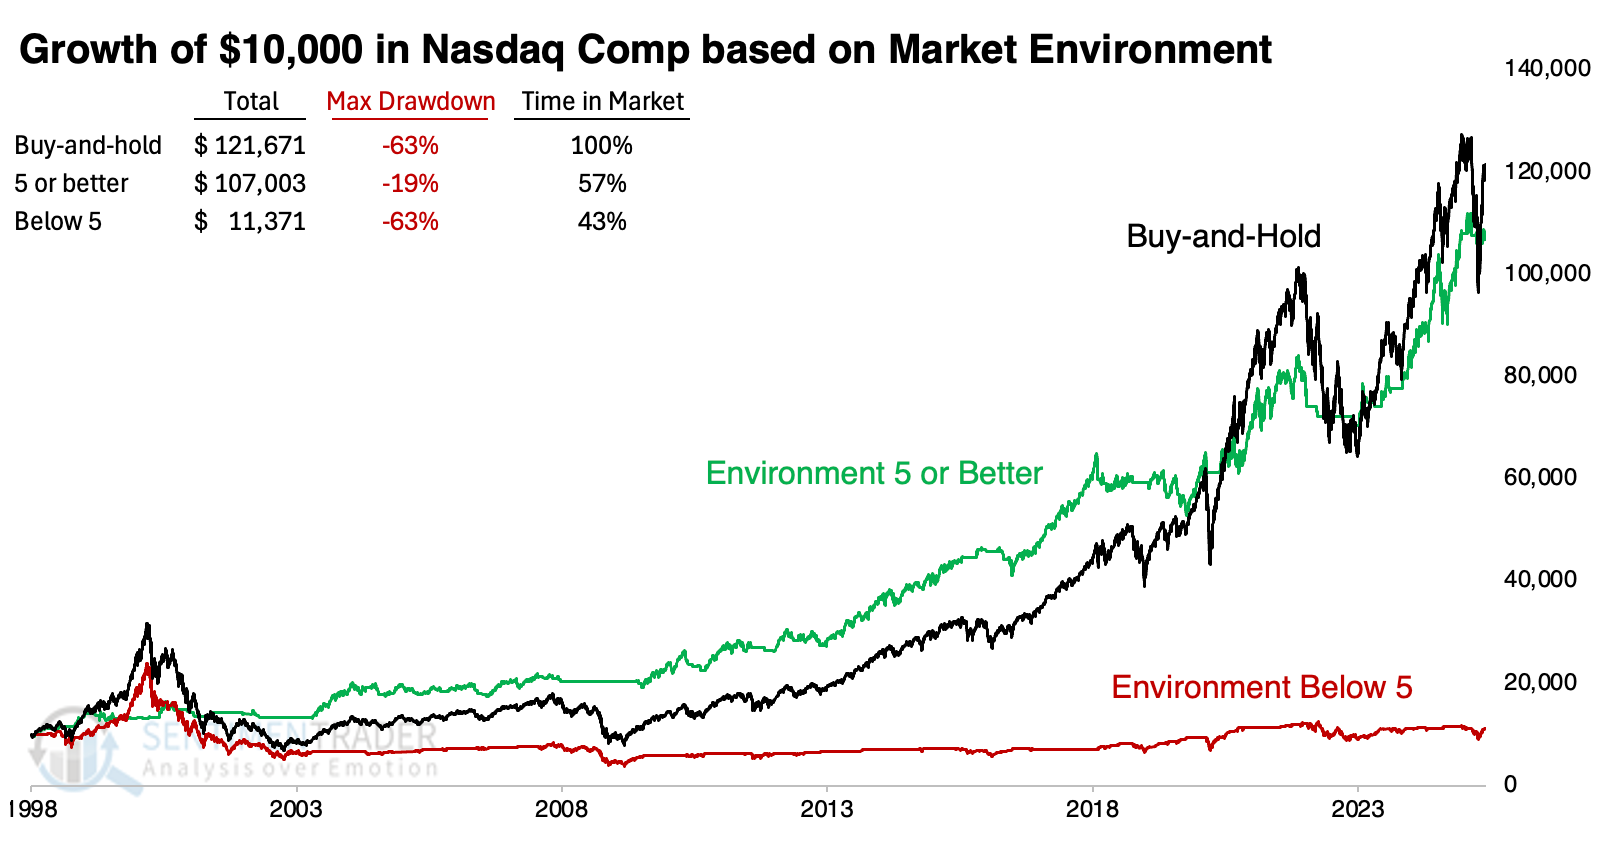
Growth and cyclical factors performed well during healthy environments, so it's no surprise that technology, consumer discretionary, and industrial stocks showed the highest returns.
During the worst of the selling in April, the 10-day average of the composite nearly dropped to 0, but it has since rebounded back into healthy territory.
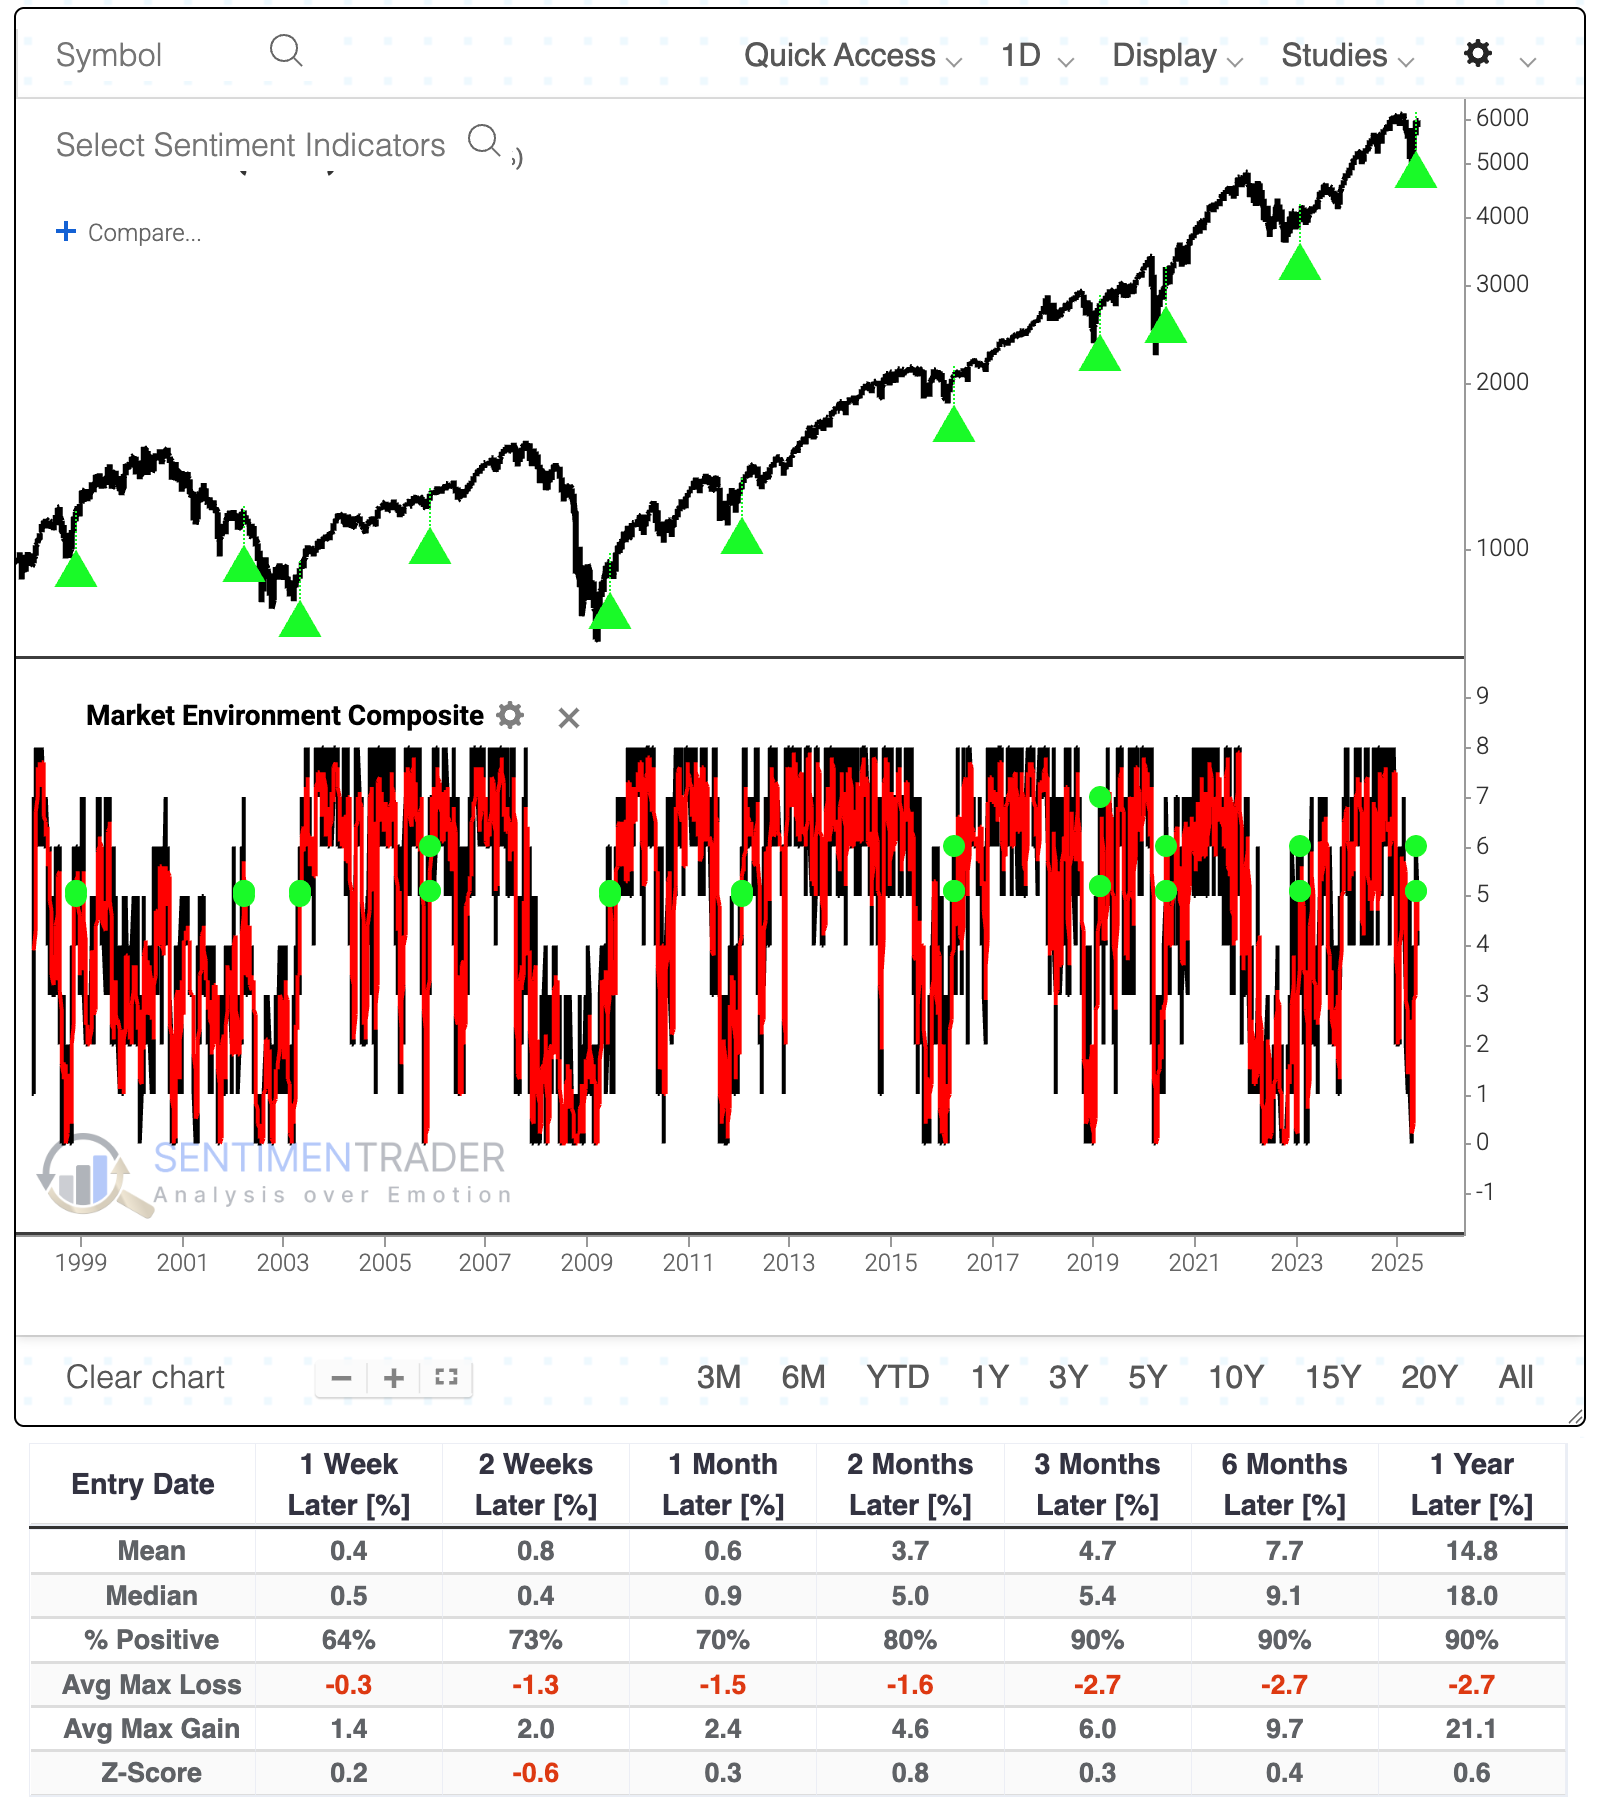 If you use Backtest Engine 2.0 to look at similar scenarios, you can see that the S&P 500 did very well in the months afterward, with a wicked exception during the 2002 bear market. Drawdowns tended to be mild after these signals. Only the 2002 failure witnessed a maximum decline of more than -7.1% at any point within the following year. Excluding 2002, the average one-year drawdown was a minuscule 2.7%.
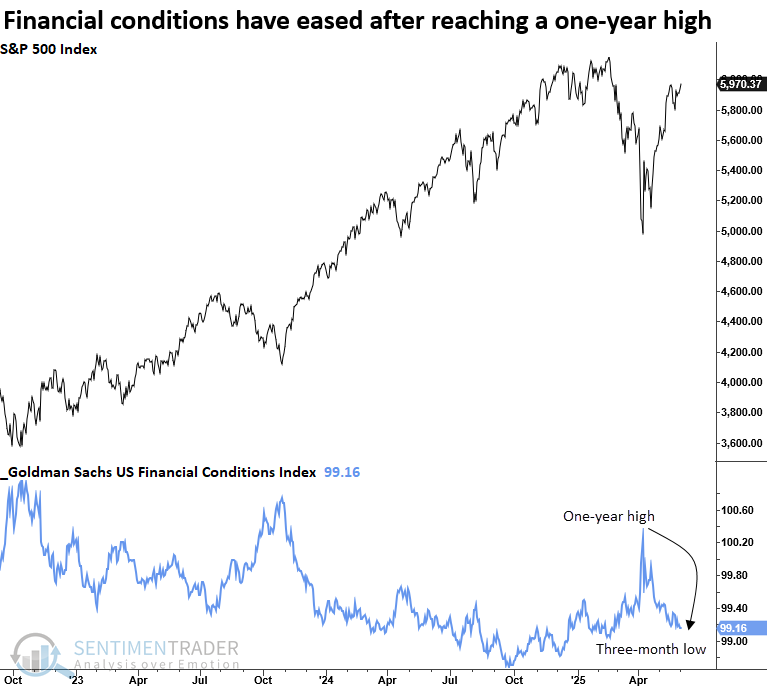
Financial conditions are easing
The Goldman Sachs Financial Conditions Index cycled from a one-year high to a three-month low. Dean showed that comparable shifts with stocks in an uptrend saw the S&P 500 rise 92% of the time over the next year.
The index incorporates a policy rate, a long-term bond yield, a credit spread, a valuation metric, and the dollar. This easing in financial conditions reinforces the trends we've been highlighting, namely, improved stock participation and a rebound in investor risk appetite, as seen in sentiment data, which strengthens the argument for a sustainable cyclical advance in stocks.
Each time the Goldman Sachs Financial Conditions Index cycled from a one-year high to a three-month low, with the broad market in a long-term uptrend, the S&P 500 rose in all but one case over the subsequent year, with a median gain of 14%.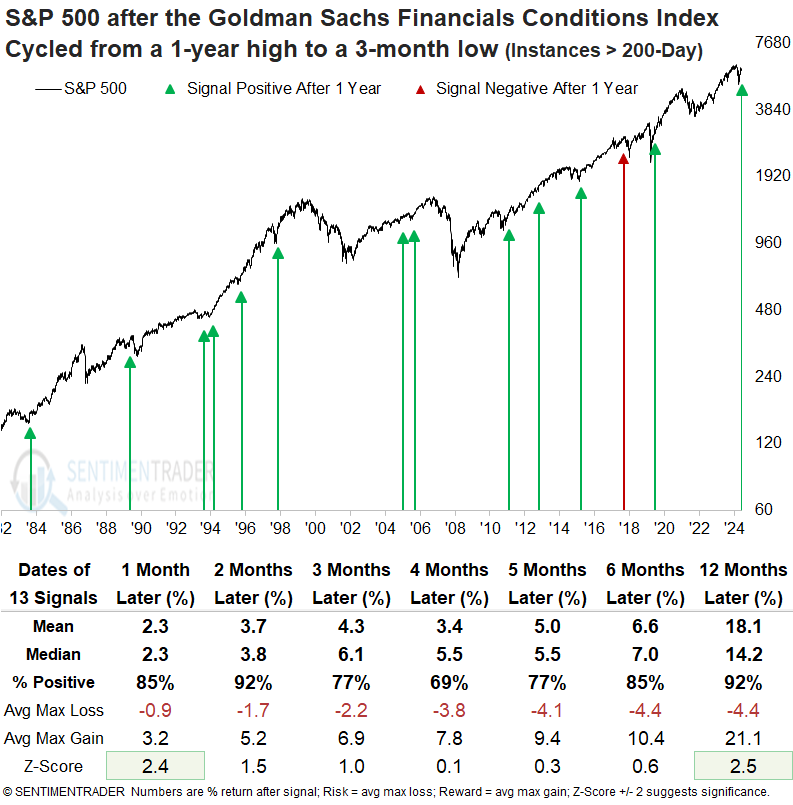
A year later, the S&P 500 declined more than 10% only two times. In contrast, it posted rallies of over 10% in 12 cases, suggesting a favorable risk/reward scenario. When signals experienced a significant drawdown, such as in 1990 and 2018, the Fed's interest policy couldn't have been more different. In 1990, it had already cut rates five times; in 2018, it hiked them seven times.
Over the next 12 months, the top-performing sectors were technology and financials, with technology posting gains that exceeded the S&P 500 across all periods.
More favorable indicators
When a variety of typically reliable indicators generate favorable signals within a short time, it often signifies a buying opportunity for stocks. Jay noted that our Industry % Indexes in Bear Market and Major Index Combo hedging indicators recently flashed favorable signals.
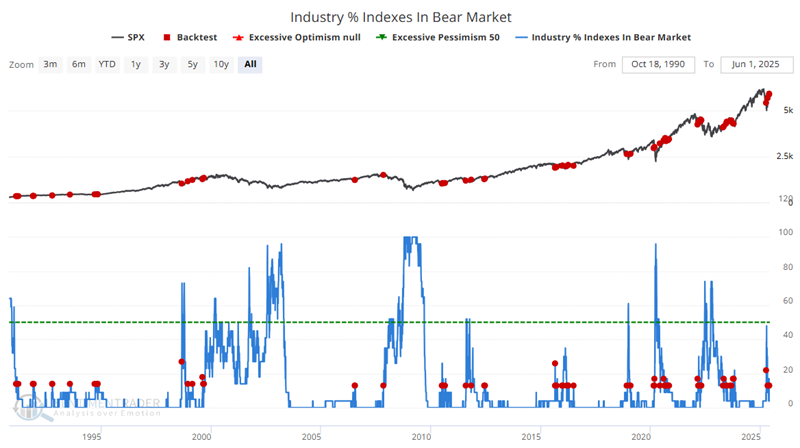
Our Industry % Indexes in Bear Market indicator shows the percentage of 23 industries that are trading more than 20% below their 52-week highs. Typically, a rise above 10% indicates a buyable pullback in an ongoing bull market or the onset of an actual bear market.
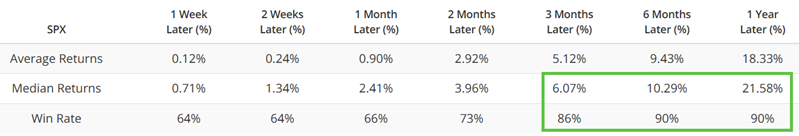
When this indicator rises above 10%, one can only speculate which of these two possibilities will ultimately play out. So, one approach is to wait for this value to drop back below 10% to suggest that the worst may be over. The chart below highlights all dates when the indicator value crossed below 10%. The S&P 500 rose 90% of the time over the following six and twelve months.
Our Major Index Combo indicator is based on weekly data and reflects hedgers' and small speculators' positions in the S&P 500, Nasdaq 100, and DJIA futures. The chart is a one-year stochastic of hedger positions minus speculator positions, so if it reads 100, then hedgers are the most exposed to stocks in at least a year, and speculators are the least exposed.
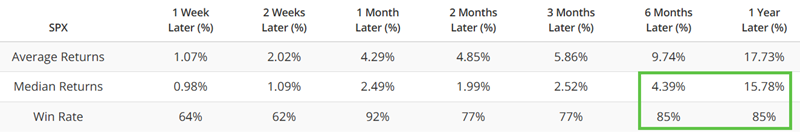
The chart below highlights all dates when the 10-week average for the Major Index Combo crossed above 66. The most recent signal occurred on 2025-05-20. The recent spike in this indicator is a favorable factor for stocks in the year ahead.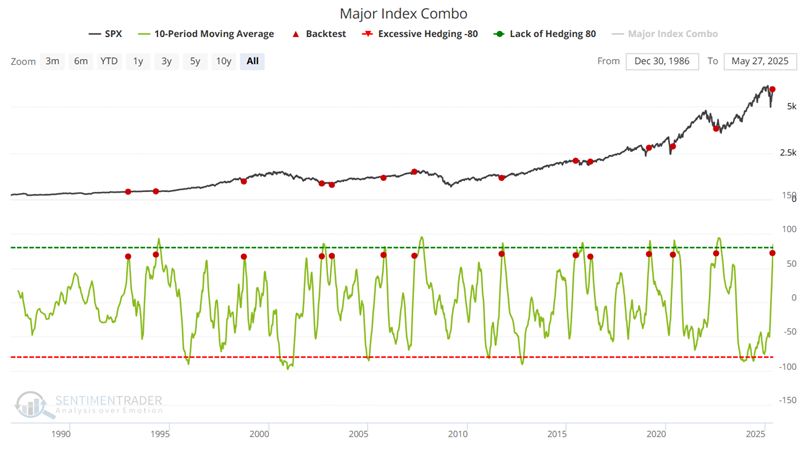
More trend score buy signals
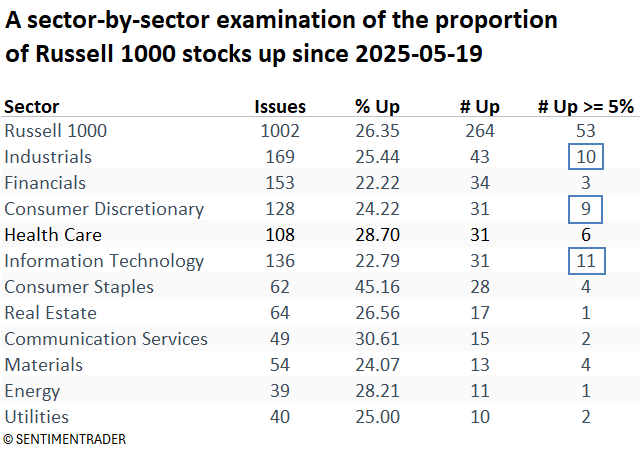
Cyclical sector stocks have outperformed since May 19th. Dean showed that this positive momentum has led to an increase in stocks generating trend score buy signals.
The S&P 500 and other major stock indexes have entered a consolidation phase that has lasted nearly two weeks. This period of sideways movement suggests a market environment marked by increased dispersion. Such conditions can be ideal for traders using relative strength indicators, as they help identify leadership names that are gaining momentum despite the broader index's stagnation.
As shown in the table below, 264 stocks, representing 26% of the Russell 1000, which tracks the 1,000 largest U.S. companies by market cap, have advanced since May 19 despite a stagnant broad market. Cyclical sectors are leading, with the majority of 5 %+ gainers concentrated in offensive areas, particularly technology, which accounts for 11 such stocks.
Meta triggered a trend score buy signal on Monday when its trend and relative trend composites simultaneously reached a score of eight or higher, and it closed at a 2-month absolute and relative high.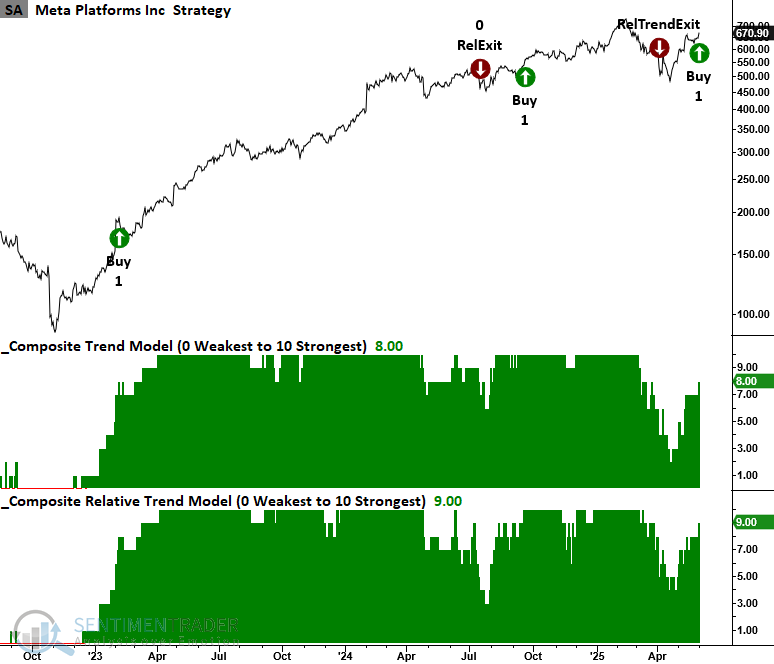
Etsy, a specialty retailer, triggered a trend score net change signal when its composite jumped by five points over five sessions.
Earlier this spring, Dean highlighted a trend score net change signal for the S&P 1500 semiconductor industry. Broadcom (AVGO) recently triggered a trend score buy signal and looks poised to reach a new all-time high.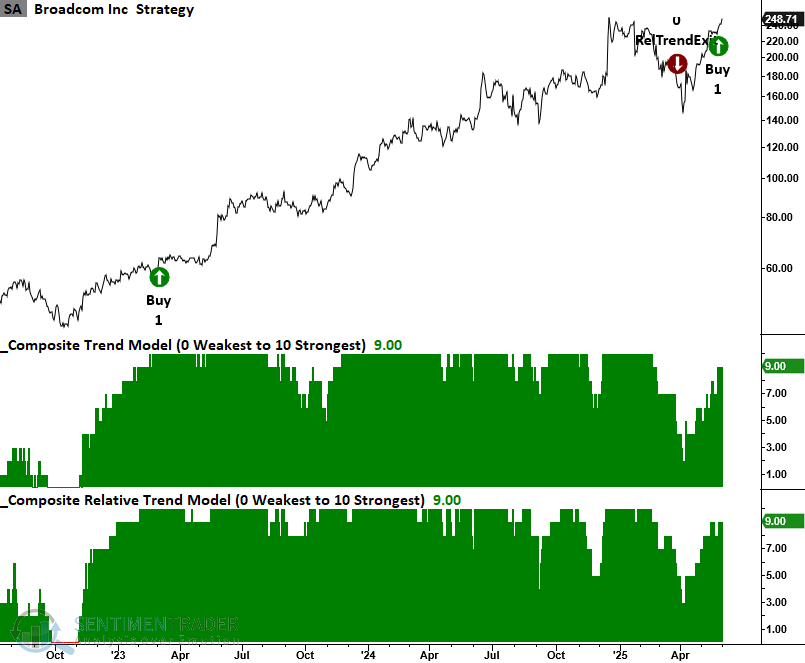
Recently highlighted stocks, especially in Dean's report "Technology dominates the relative highs breakout list", all show gains, as expected in a broadly rising market. Notably, 70% outpaced the S&P 500 by a median of 6%.
Cyclical sector stocks that recorded a 2-month absolute and relative low on Monday include housing-related names, which dominated the list, covering builders, flooring suppliers, lumber, HVAC suppliers, and more.
Using a credit default index to time the bond market
Income investors face a unique challenge these days; securities offering a decent yield can be quite volatile when rates fluctuate, but low-volatility income securities tend to provide low returns. Jay outlined a trading approach that incorporates the CDX Index indicator to decide when to be "risk on" or "risk off."
Over the past few years, one of the fastest-growing derivatives markets has been that for credit default swaps (CDS). A CDS allows the various parties to swap the exposure of default of the underlying credit.
As posted to the site, the indicator tracks an index created by Dow Jones that monitors the spread between credit default swaps on high-yield bonds and Treasury securities. The higher the index, the wider the spread. This means credit investors are increasingly worried about defaults and willing to pay higher prices for default protection.
When the CDX Index is below its 3-week moving average, we will call that "risk on" and when the CDX Index is above its 3-week moving average, we will call that "risk off".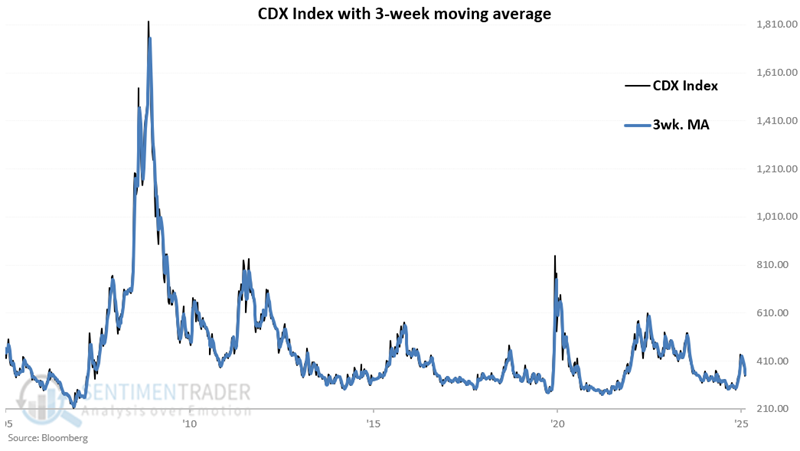 The basic idea is to combine a higher-yielding security held during risk-on periods, with a very low volatility security held during risk-off periods to maximize gains when things are good and limit risk otherwise.
The two securities we will use for this test are the Neuberger Berman High Yield Strategies Fund (ticker NHS) and the SPDR® Bloomberg 1-3 Month T-Bill ETF (ticker BIL).
- If the CDX Index is below its 3-week moving average, we will switch into NHS
- If the CDX Index is above its 3-week moving average, we will switch into BIL
Note that this method averages almost 20 trades per year. This suggests that this approach would be best used in a non-taxable account to avoid an endless stream of short-term capital gains or losses.
What we have is an admittedly very unorthodox and uncomfortable strategy for income investors who tend to trade only rarely. Nevertheless, the chart below displays the hypothetical growth of $1 invested using this switching method, versus the 50/50 method (which involves just one trade per year in January to rebalance to 50% in each security).
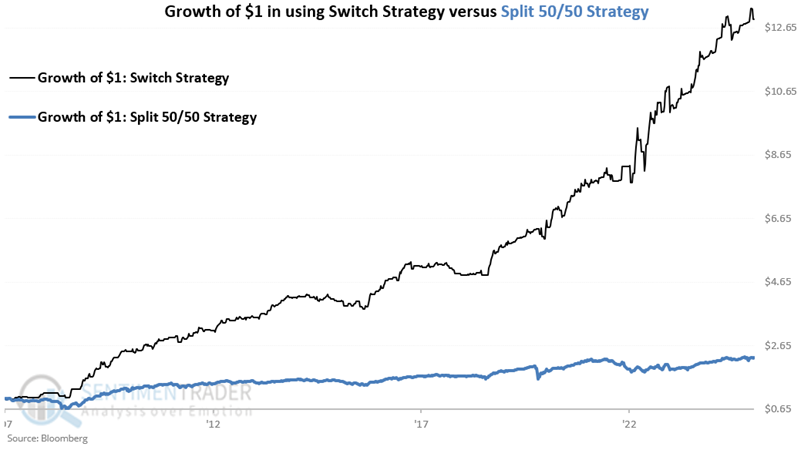
From June 2007, a hypothetical $1 invested using the 50/50 "split" method grew to $2.28 while the "switch" method grew to $12.93.
The "switch" method twice experienced a drawdown of roughly 14%, with a maximum drawdown of 14.2%. The "split" method experienced four drawdowns over 10%, three over 15%, two over 20%, and one of -33.4%.
The "Switch" strategy has already made nine trades in 2025. The most recent signal was a switch back into NHS, generated on 2025-05-30.
About TradingEdge Weekly...
The goal of TradingEdge Weekly is to summarize some of the research published to SentimenTrader over the past week. Sometimes there is a lot to digest, and this summary highlights the highest conviction or most compelling ideas we discussed. This is NOT the published research; rather, it pulls out some of the most relevant parts. It includes links to the published research for convenience, and if you don't subscribe to those products, it will present the options for access.