
TradingEdge Weekly for Jun 3 - 100-day starts, consumers hate stocks, buying thrusts

Key points:
- This year has been among the worst 100-day starts ever
- Poor stock returns have triggered extreme pessimism over a 100-day period
- Even general consumers are hating stocks - and bonds - right now
- Recent signs of overwhelming buying interest may put an end to some of this pessimism
- Even corporate bonds have seen a thrust of buying interest
- A couple of worries are longer-term price trends and seasonal influences
One of the worst 100-day starts ever
Even after a multi-day surge, the S&P 500 has tracked along with its worst starts ever. It's hard to find poorer "first 100 days," but there have been 15 years that showed a correlation higher than +0.5 (on a scale of -1.0 to +1.0).
It's interesting that - on average - those other years formed multi-month bottoms right about when we did this year.
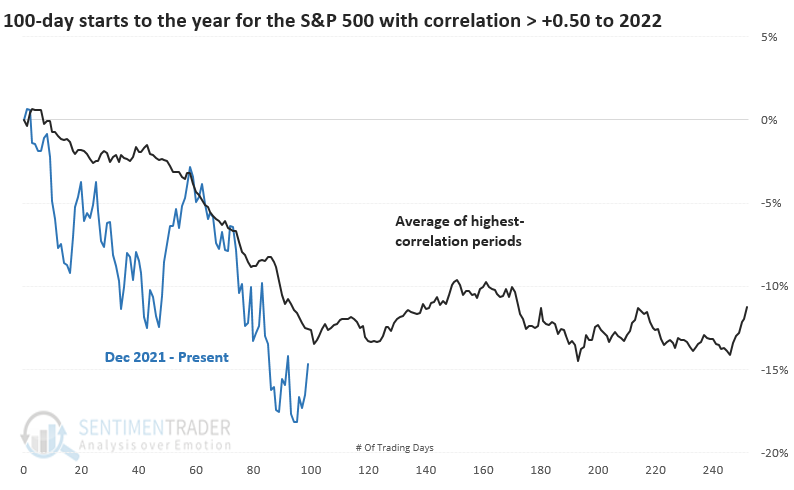
Looking at the ten most recent precedents, the S&P enjoyed at least a short-term low right about now in almost all the years, with 2002 being the most egregious exception.
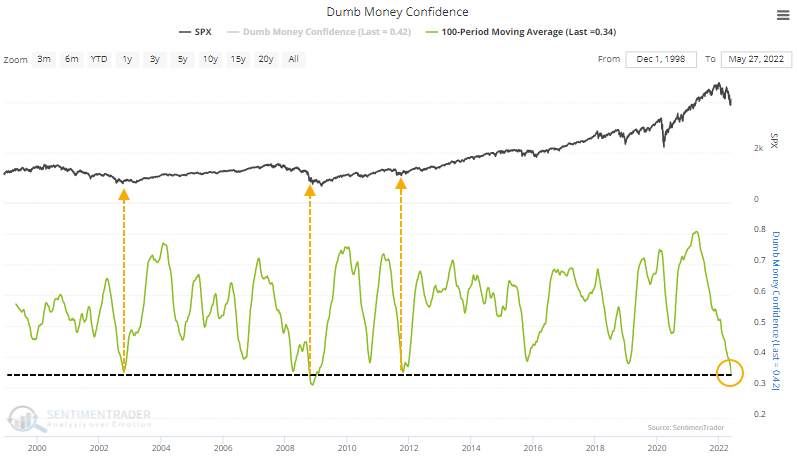
The poor showing has undoubtedly had an impact on sentiment. The 100-day average of Dumb Money Confidence just dropped to its 2nd-lowest level since we began calculating it more than 22 years ago. It got a bit lower after the signal in October 2008.
Longer-term surveys across investor groups are showing similar pessimism. The 20-week average of our AIM Model has now dropped to its lowest level since the 1970s. One of the few populations that has not been selling is corporate insiders. The number of officers, directors, and other insiders among S&P 500 companies that had an open market sale over the past six months has dried up to one of the lowest levels of the past 12 years.
Consumers hate stocks, too
It isn't just investors who are pessimistic. With a steady drumbeat of news reports about plunging stocks, bonds, and crypto, that poor attitude has spread to general consumers.
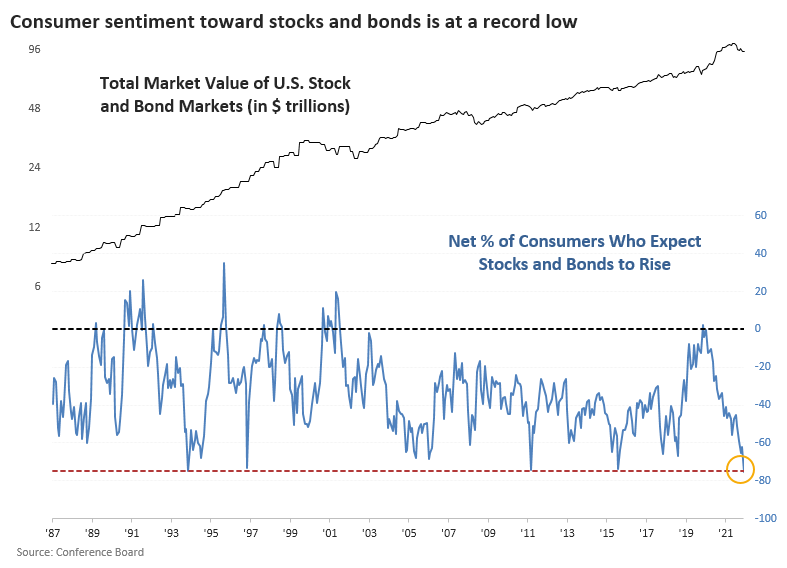
In the U.S., households now hate stocks on a level rarely matched in 35 years. According to the Conference Board, the net difference between consumers who expect stocks to rise versus fall is the lowest in over a decade. The bond market has also suffered a historic drawdown, so it's no surprise that consumers also hate bonds.
If we combine stock and bond sentiment, it is now the lowest in history. Never before in 35 years have more consumers expected both stocks and bonds to decline.
When we look at the worst combined stock and bond sentiment among consumers, it typically occurred after drawdowns (duh), but not necessarily significant ones. Even so, future returns in the S&P 500 were pristine, with an exceptional reward to risk ratio.
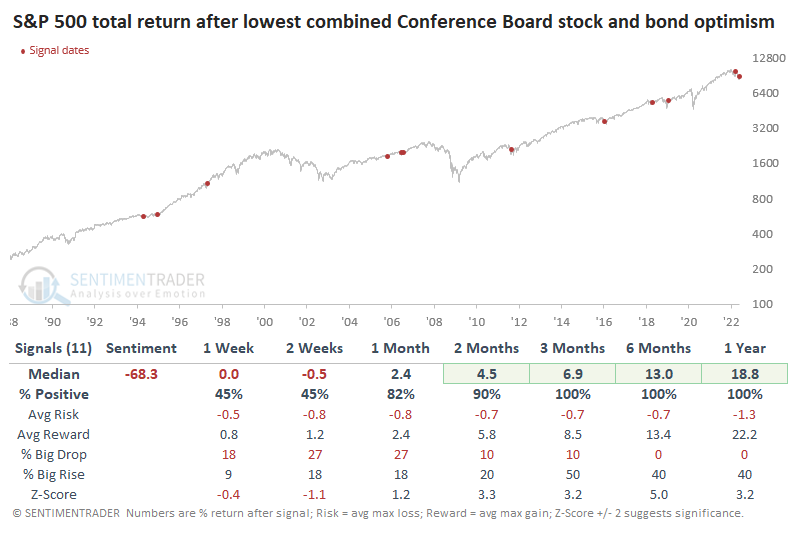
The past 35 years have had a persistent tailwind for bond prices, so it's not a shocker that the Bloomberg Barclays U.S. Aggregate Bond Total Return Index also showed fantastic returns after these bouts of dual pessimism.
Finally, some relief with a recent breadth thrust
In late March 2020, thrusts in buying interest were wildly impressive.
It's happening again, and there is skepticism that this rally is real - the number of articles dismissing the gains as just another "bear market rally" is nearly double the prior record from early April 2020.
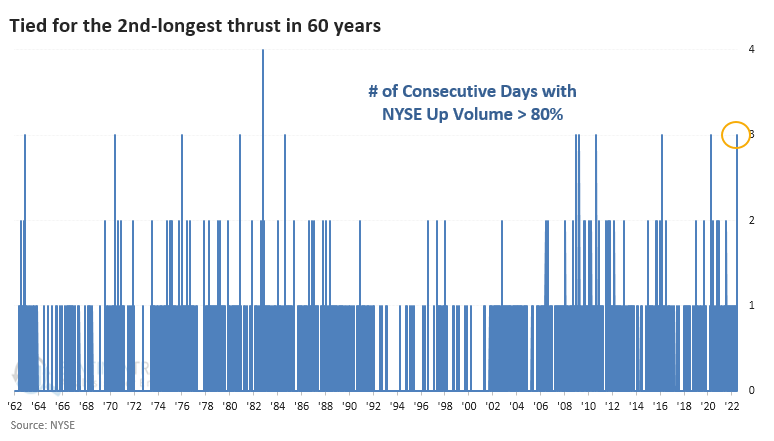
In the three days leading up to the exchange holiday, more than 80% of volume on the NYSE flowed into advancing stocks. We typically do not see this kind of behavior during bear markets, usually at the end of them. The only time in 60 years when there was a longer streak of overwhelming buying interest was October 1982, during the 2nd phase of the kickoff to one of the greatest bull runs in history.
Whenever they occur, streaks of three consecutive days with more than 80% up volume have shown a strong tendency to lead to positive forward returns in the S&P 500 across all time frames. Only 2 of 11 signals showed a loss from two months and beyond, and the risk/reward ratio was exceptionally positive.
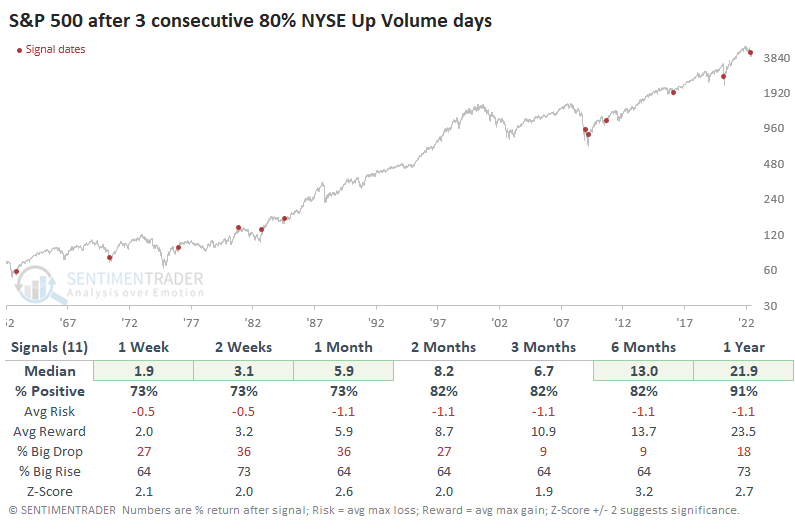
Even more significantly, this thrust is coming directly on the heels of what had been a 52-week low in the S&P 500. Similar behavior triggered only three other times, so we're dealing with a minuscule sample size, but the consistency of future returns is notable. Each of them ended bear markets.
Corporate bonds are "thrusty," too
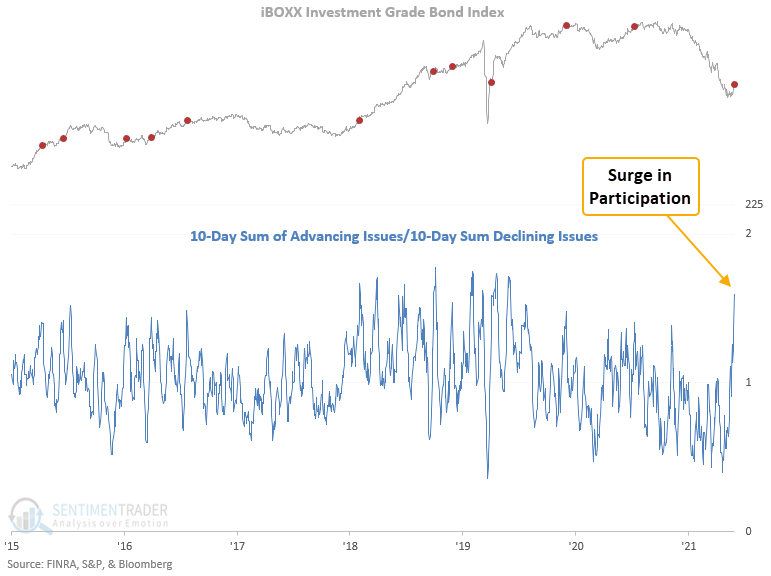
It's not just stocks that are enjoying a thrust. Dean noted that a ratio between investment-grade bond advancing and declining issues surged higher, triggering a new breadth thrust buy signal. Investment-grade bonds have rallied 87% of the time and stocks 93% of the time after other signals.
The breadth thrust model identifies when the 10-day sum of investment-grade advancing issues exceeds the 10-day sum of investment-grade declining issues by a ratio of 1.41. The IG bond breadth ratio has reached the highest level in almost 2 years.
This model generated a signal 15 other times over the past 16 years. After the others, investment-grade bond future returns, win rates, and risk/reward profiles were solid across almost all timeframes. The signal shows a positive return at some point in the first 3 months in all instances. 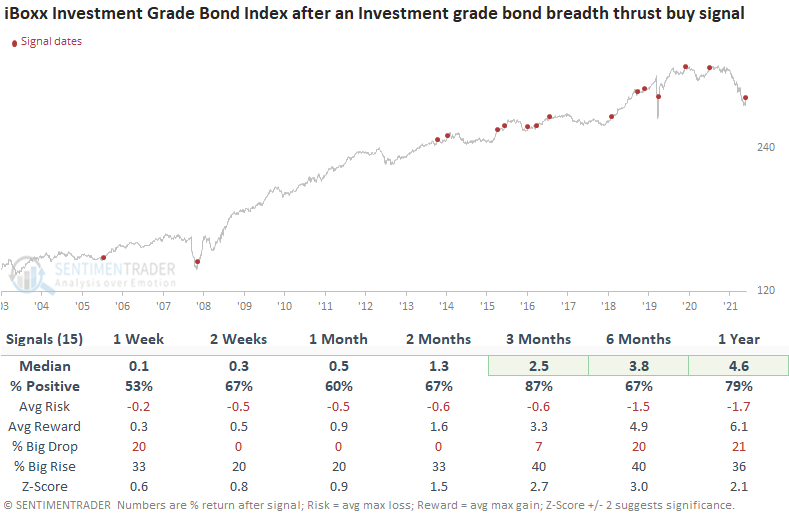
Price trends are still shaky, though
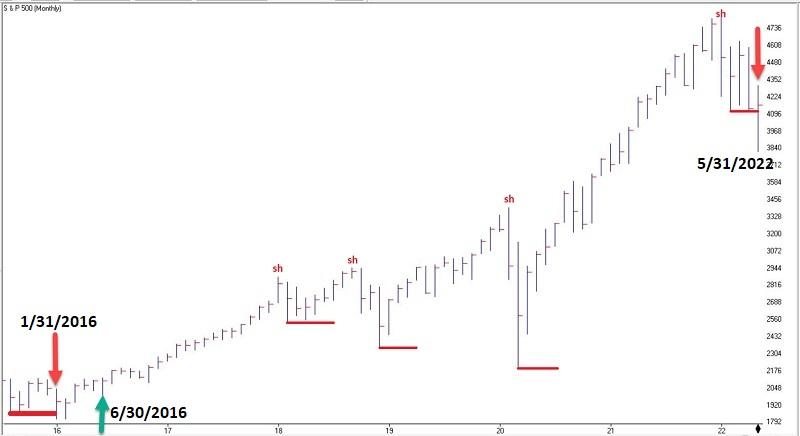
Jay showed a trend-following system that only takes a few minutes each month. This system uses a monthly price bar chart for the S&P 500 (SPX) to generate trading signals, and analysis is done only at the end of the month.
A buy signal occurs when:
- The high for the SPX this month is above its highest price of the previous six calendar months (the actual buy signal occurs at the end of the month).
- That's it.
A sell signal occurs when:
- SPX registers a month where the month's high is above the previous month's high and then goes three consecutive monthly bars WITHOUT exceeding the first month's high price. We call the first month's high a "swing high."
- Once this happens, the lowest low for SPX registered during the three months after the first month is deemed as the "sell trigger price."
- Once a sell trigger price is established, an actual sell trigger occurs at the end of the month IF the low for the current month is below the "sell trigger price."
HOWEVER...if, before triggering an actual sell signal, SPX makes a new monthly high above the previous "swing high," then the sell signal alert is aborted, and the "sell trigger price" is no longer active.
Sounds complicated, but the chart below should clarify things a bit.
Let's consider the plight of the market when the method is bearish. The chart below displays the growth of $1 invested in the S&P 500 Index only when the trend-following method described above has been bearish since 1970.
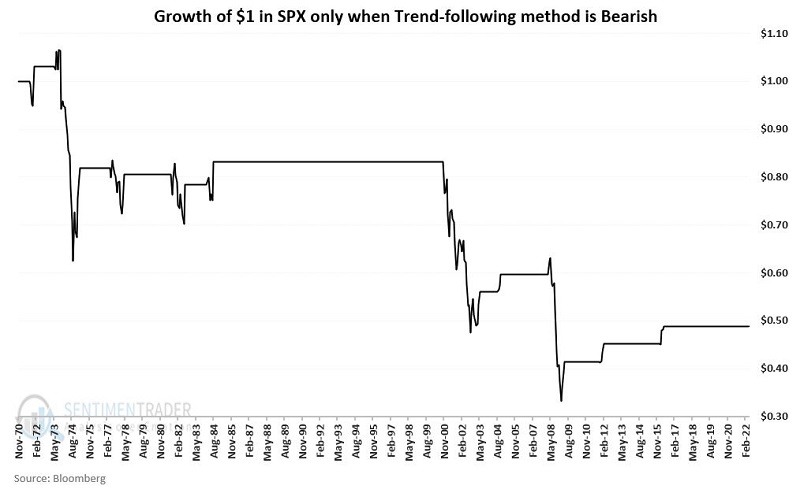
Trend-following systems can be subject to whipsaws, and this one is no different. But it has paid to be on the side of the system over the long-term.
More headwinds - seasonality
Jay presented an analysis of stock market history on a monthly basis across twenty-year cycles and revealed 17 out of 120 months that exhibited consistently poor results. Two of those 17 months during the current cycle (2020-2039) are June 2022 and September 2022.
The chart below displays the cumulative % performance for the Dow Jones Industrial Average if held long ONLY during this same sequence of 17 months every 20 years.
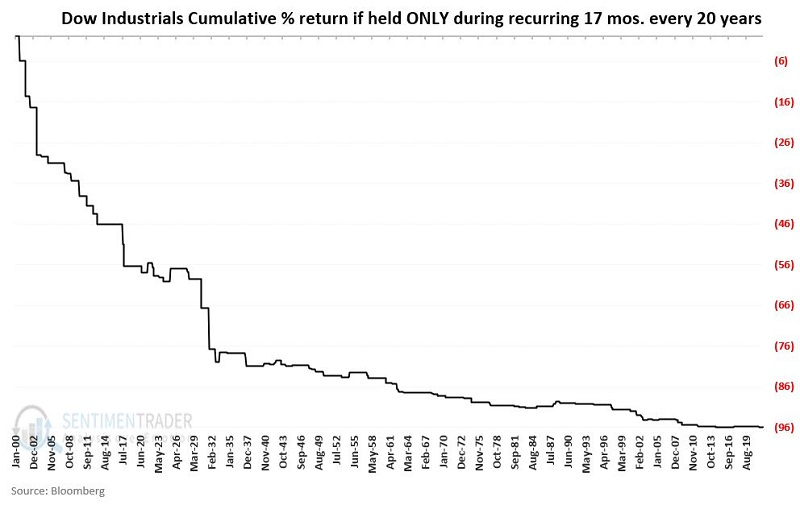
The net result is this - held only during the same 17 months within every 20-year cycle starting in 1901, the Dow Jones Industrials Average has lost -96.3% of its value, which is pretty hard to believe (yet mathematically correct). Which makes this an opportune time to issue the all-important "past performance is no guarantee of future results" caveat.
About TradingEdge Weekly...
The goal of TradingEdge Weekly is to summarize the research published to SentimenTrader over the past week. Sometimes there is a lot to digest and this summary is meant to highlight the highest conviction or most compelling ideas we discussed. This is NOT the full research that's published, rather it pulls out some of the most relevant parts. It includes links to the published research for convenience; if you don't subscribe to those products it will present the options for access.