
TradingEdge Weekly for Jun 27 - New highs in tech, oil reversal, summer rally period

Key points:
- Technology indices closed at record highs
- Trend indicators are confirming a sustained move
- Some indicators that deserve attention, especially with recent signals
- Short-term risk levels are high...but that's a good thing
- The Summer Rally Period is about to start
- Financial stocks' relative returns have improved
- Silver got stretched
- The big negative reversal in crude oil tends to lead to more losses
- Headwinds for unleaded gas prices
Tech's new highs
The S&P 500 Technology sector and the Nasdaq 100 closed at new highs. Dean showed that initial breakouts from prior major troughs resulted in powerful advances in both indexes.
While breakouts are a common phenomenon during bull markets, it's noteworthy that these are the first new highs following significant pullbacks. The S&P 500 Technology sector transitioned from a 1-year low to a 1-year high in just 52 sessions, marking the second-fastest rebound on record, surpassed only by a recovery in 1978.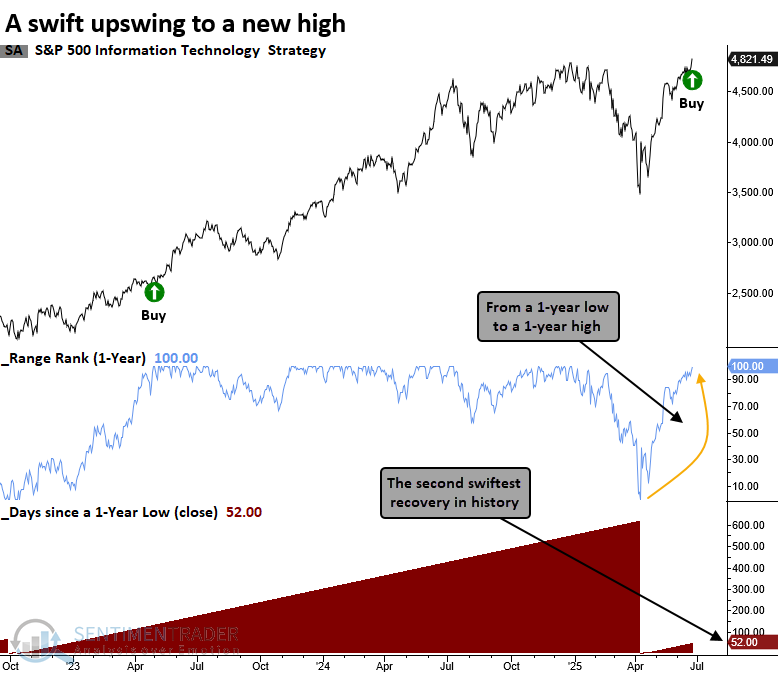
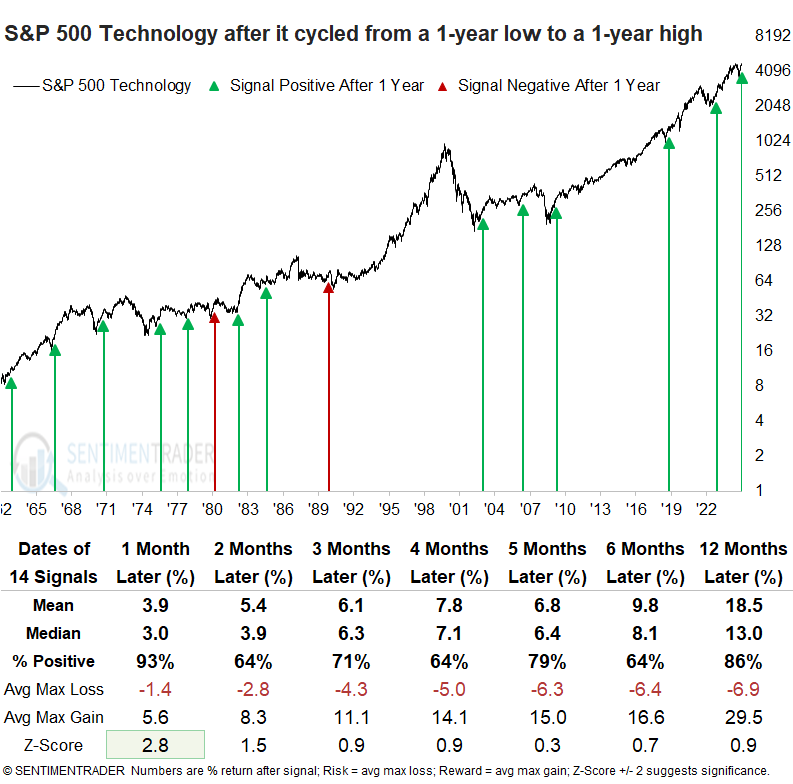
Whenever the S&P 500 Technology sector cycled from a 1-year low to a 1-year high, it advanced over the next month in 93% of cases, an encouraging sign that suggests upside follow-through as a favorable seasonal period approaches.
In just 52 trading sessions, the Nasdaq 100 climbed from a 9-month low to a 1-year high, posting its second-fastest recovery on record, eclipsed only by the rebound seen in 1989. Under similar scenarios, the popular tech-heavy index advanced without fail over the following year.
The Deviation from Trend indicator identifies momentum shifts by tracking the ratio of the 30-day to 150-day average. A signal occurs when the ratio cycles from below 0.95 to above 1.03, and the index registers a 42-day high.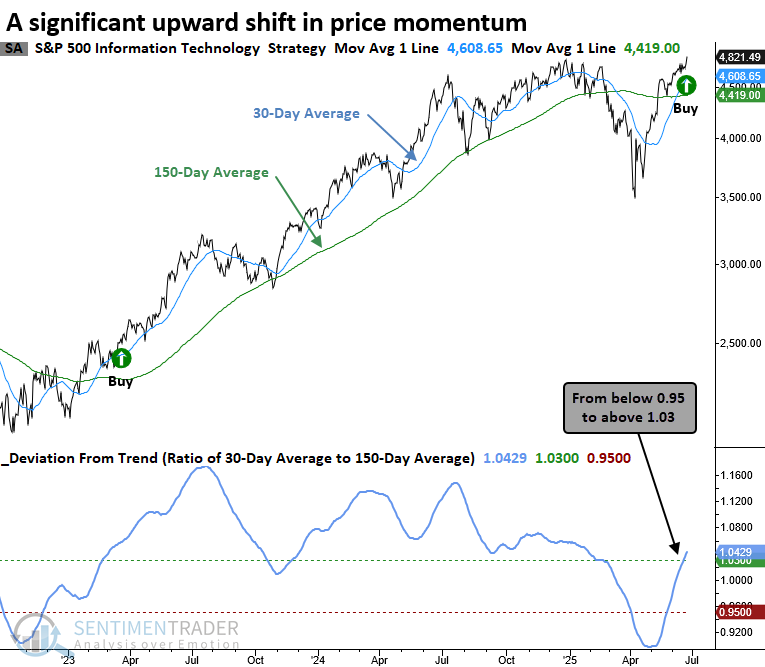
An upward shift in price momentum, as measured by the deviation from trend indicator, tended to produce outstanding returns and consistency for the S&P 500 Technology sector over the subsequent year.
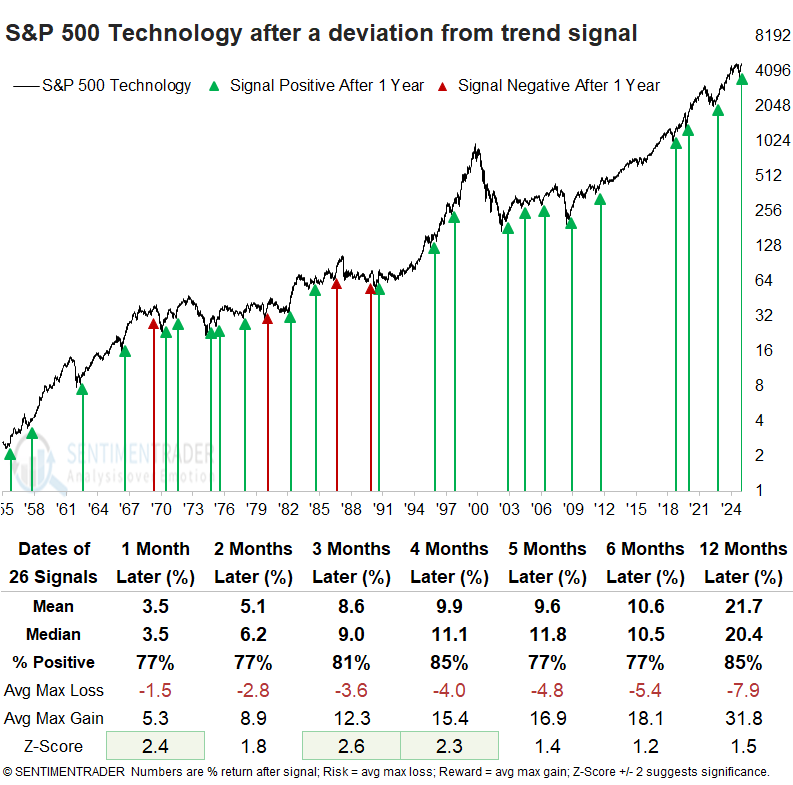
Over the next year, the S&P 500 Technology sector declined by more than 10% on eight occasions, while it rallied by more than 10% 22 times, underscoring a compelling risk-reward profile.
The Nasdaq 100 also generated a deviation from trend alert, which consistently led to strong forward returns in the Nasdaq 100 over the following year, with the one- and twelve-month intervals registering only one loss and displaying significance relative to random expectations.
Trend confirmed
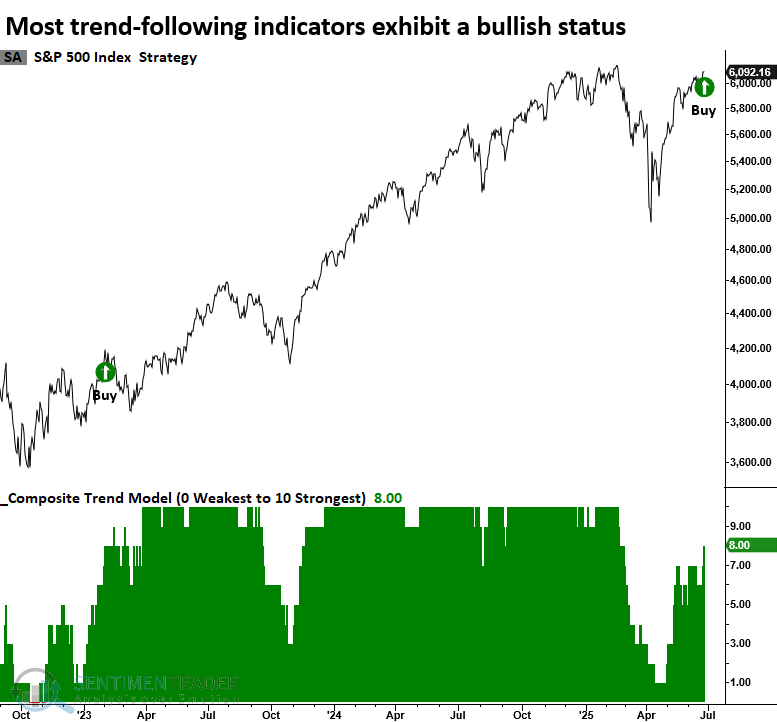
Almost all trend-following indicators in the S&P 500's Composite Trend Model display a bullish status. Dean noted that similar recoveries in the trend-following composite suggest the cyclical advance in stocks should persist.
On Wednesday, the S&P 500's trend score increased to eight, generating a signal in the TCTM Composite Confirmation Model. This occurs when the composite rises from two or below to eight or higher. The new alert marks the first component in the confirmation model to trigger. Unlike the more responsive signals in the Composite Thrust Model, these confirmation components are designed with a longer-term perspective and are inherently less timely. Their purpose is to offer supporting evidence that the S&P 500's trend is gaining strength.
Each time the S&P 500's Composite Trend Model moved from two or lower to eight or higher, the world's most benchmarked index tended to advance over the following year, especially in recent decades, where it has posted 16 consecutive winning outcomes since 1988.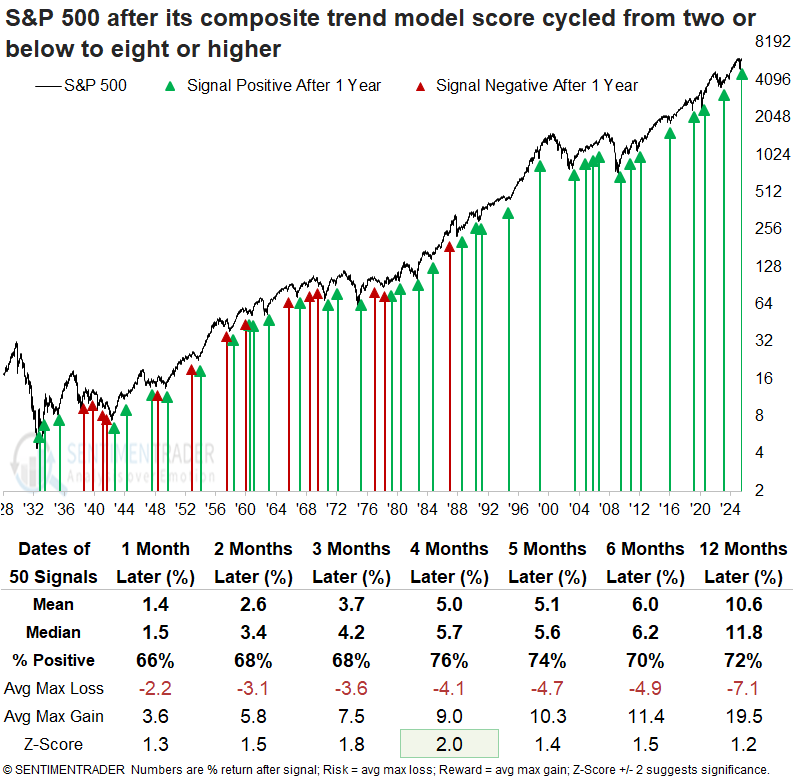
The weight of the evidence continues to suggest that equity indices are in the early stages of a cyclical upswing. Consequently, as the advance unfolds, more signals are likely to turn positive, reinforcing the trend's strength.
Indicators to follow
Jay highlighted a variety of sentiment indicators that give meaningful signals investors may want to pay attention to.
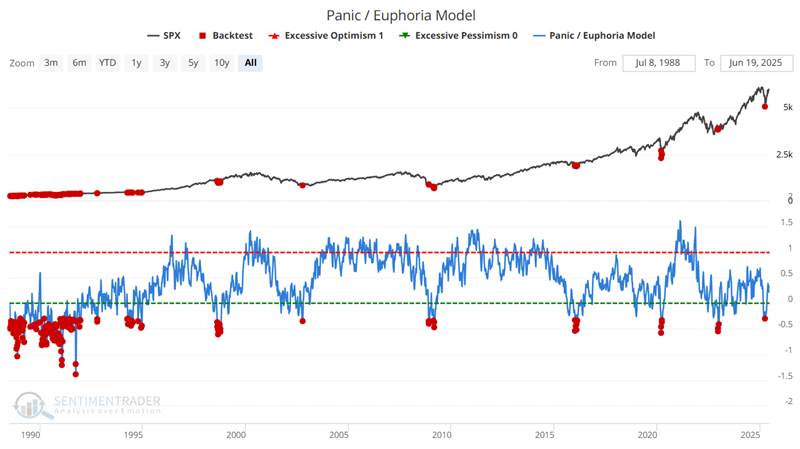
Among them, the Panic/Euphoria Model comprises the following primary inputs: NYSE short interest, margin debt, Nasdaq vs NYSE volume, Investor's Intelligence survey, AAII survey, retail money market funds, put/call ratios, commodities prices, and retail gasoline prices. Low values, particularly below zero, suggest investors have panicked, and higher forward returns are expected.
The chart below highlights all weeks when the Panic/Euphoria Model was below -0.30.
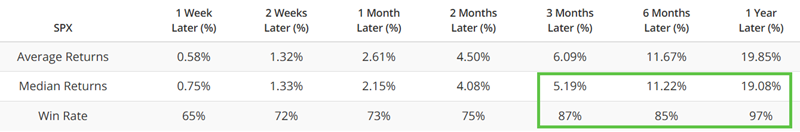
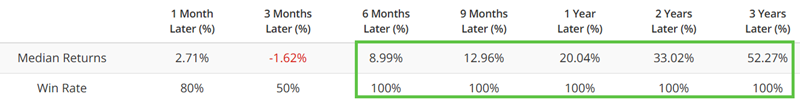
Except for a handful of signals in late 1989 and early 1990, all signals saw the S&P 500 higher twelve months later. Since then, most signals have coincided with significant market declines/bottoms. The table below reveals this to be a valuable signal for investors with a three-to twelve-month timeframe.
Jay also showed performance following readings in the Sentiment Cycle Composite and 20-week average of the AAII Bull Ratio.
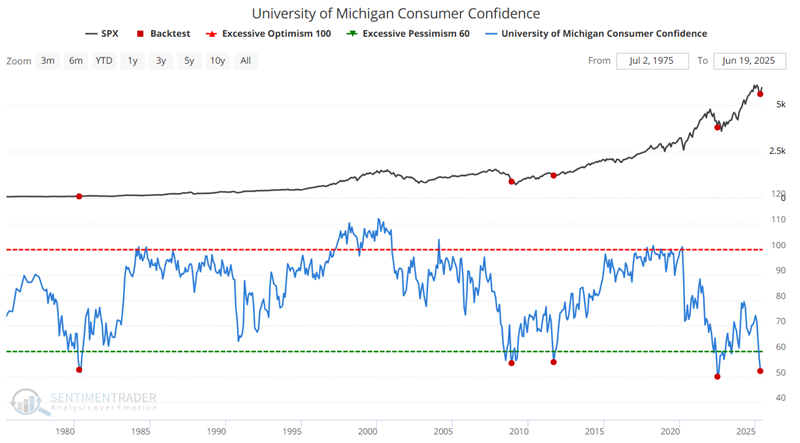
in Part II, Jay looked at total put premiums paid vs. call premiums, the Retail-Only, Buy-to-Open Put/Call Rato, and the Thomson/Reuters University of Michigan Consumer Sentiment Index.
That survey gives a very accurate indication of the national economy's future course. Like most other sentiment surveys, this is a coincidental indicator. When times are good, consumers are happy; when times are bad, they are less optimistic. When the survey recorded readings under 70, it coincided with challenging market conditions. The chart below highlights the rare occasions when this indicator crossed below 56. At the end of April 2025, only the fifth signal since 1980 fired.
Risky (?)
Our Short-Term Risk Levels indicator has risen lately. Jay showed that this is, in theory, an unfavorable development, we have found at least one iteration of this indicator that tends to bode well for stocks when it rises.
The chart below highlights all dates since 2004 when the 50-day moving average of the Short-Term Risk Levels indicator was above 6.3. It has a strong tendency to occur at the onset of new bull markets after a substantial price decline and investor panic.
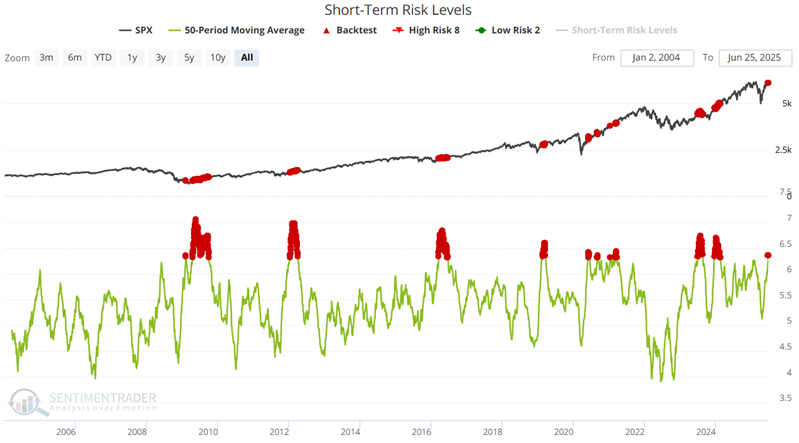
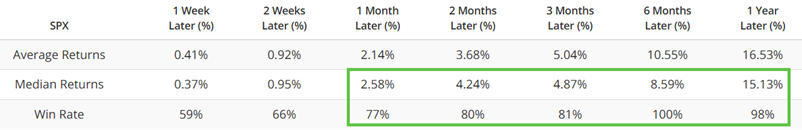
Since 2004, there have been 361 days when the 50-day average of the Short-Term Risk Levels indicator was 6.3 or higher. All 361 of these days (so far) have seen the S&P 500 stand higher six months later.
The chart below highlights only those dates when the 50-day average of the Short-Term Risk Levels indicator crossed above 6.3 for the first time in six months.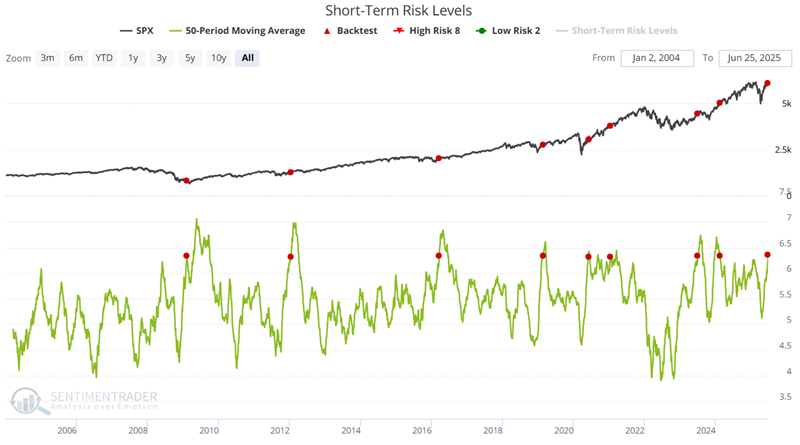
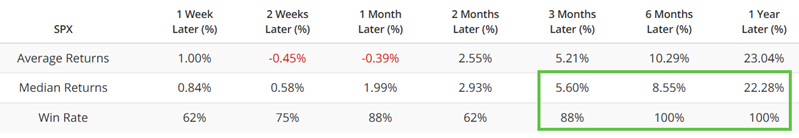
As with many "bull market signals," the technology sector has significantly outperformed following the abovementioned signal.
Summer doldrums
The supposed "Summer Rally" in the stock market is one of those adages thrown around but rarely defined. Jay took a closer look at the stock market's performance during the summer months of June, July, and August.
The chart below displays the cumulative price return for the S&P 500 Index if held long ONLY during June, July, and August, every year from 1942 through June 23, 2025.
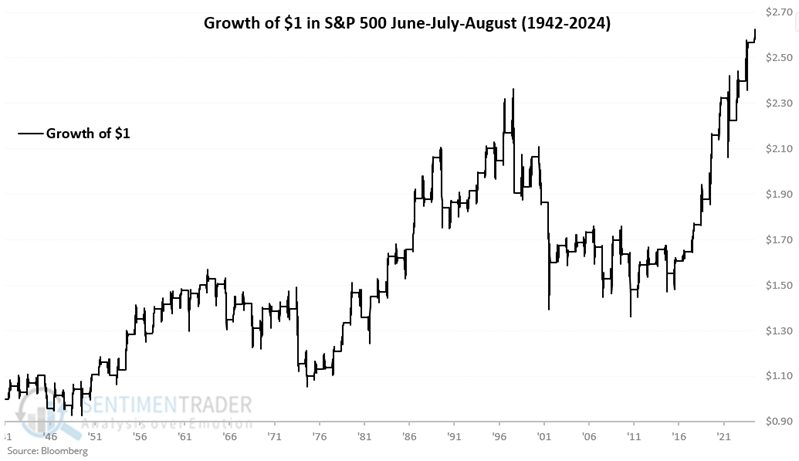
While the stock market has shown a positive overall performance during the summer months, these months have not been the most dynamic time of year. From June through August, the S&P 500's cumulative return was +162%, compared to +26,387% during all other months.
The "Summer Rally Period" is generally recognized to be the last three trading days of June through the first nine trading days of July. For 2025, this period begins at the close on 2025-06-25 and ends at the close on 2025-07-14.
The chart below displays the cumulative percentage price change for the S&P 500 Index during the summer rally period (in black) compared to all other summer days (in blue, meaning all June through August trading days, not including the nine days highlighted above).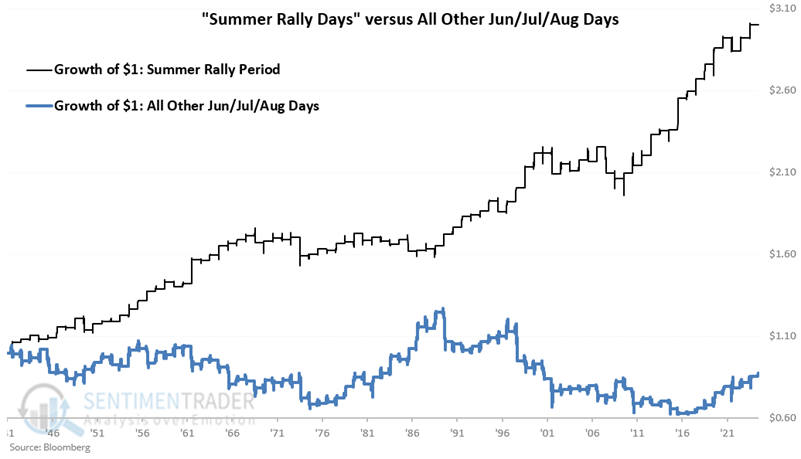
These short seasonal windows were positive during 73% of years and had a cumulative return of +200.2%. That compares to all other summer days, which had a 55% win rate and return of -12.8%.
Improvement in financial stocks
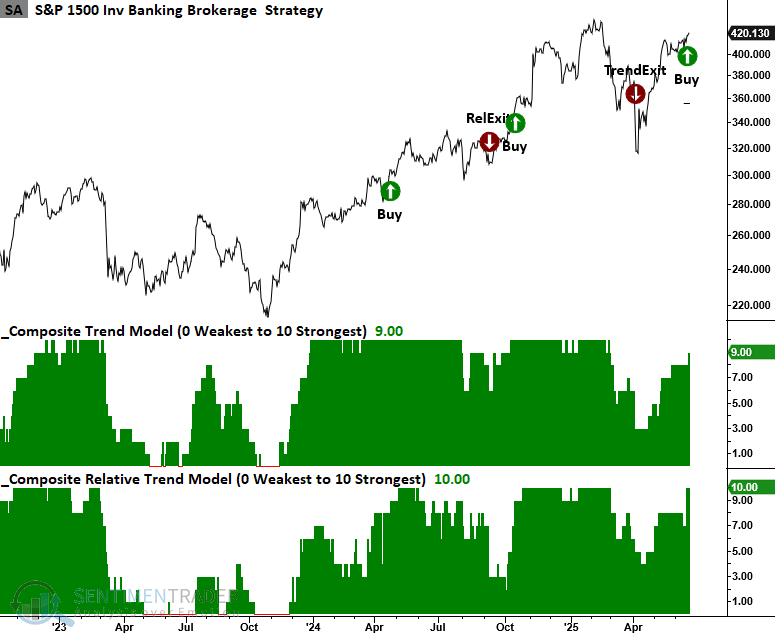
S&P 500 Financial sector stocks experienced a significant shift upward in relative strength ranks. Dean noted that the S&P 1500 Investment Banking and Brokerage sub-industry group triggered a trend score buy signal.
The pace of broad market trading signals has slowed considerably as indexes have been consolidating (until recently) following the rally from the April lows. One area that deserves attention is the financial sector, which posted a sharp rise in 10-day relative strength rankings, leading all sectors on Monday.
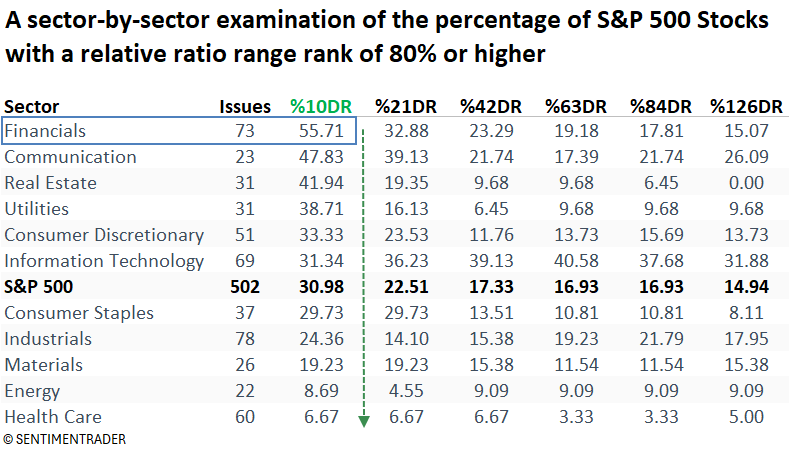
You can now visualize the data from the table above in a chart and analyze it using the backtest engine. The chart below shows that S&P 500 Financials stocks with a relative strength range rank of 80% or higher experienced a sharp uptick in recent sessions.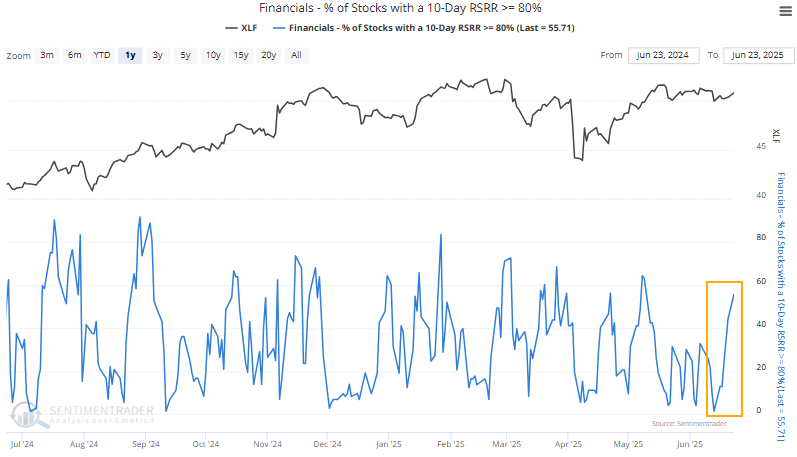
The combination of a sharp rise in 10-day relative ranks and favorable long-term trend scores suggests that investors should look for potential opportunities within this group.
The S&P 1500 Investing Banking and Broker sub-industry group recently triggered a trend score buy signal. The SPDR Capital Markets ETF (KCE) serves as a strong proxy for this group, comprising 61 stocks spanning investment banks, brokers, exchanges, and asset managers.
Brokerages like Robinhood, Schwab, and Interactive Brokers, along with exchanges such as Coinbase, Nasdaq, and Intercontinental Exchange, are showing strong absolute and relative trend scores, suggesting that 2025's volatility is favoring firms tied to heightened trading activity. Coinbase, the digital asset exchange, recently generated a trend score signal. With shares trading only 3% below their all-time high and no overhead resistance in sight, a breakout could fuel further momentum.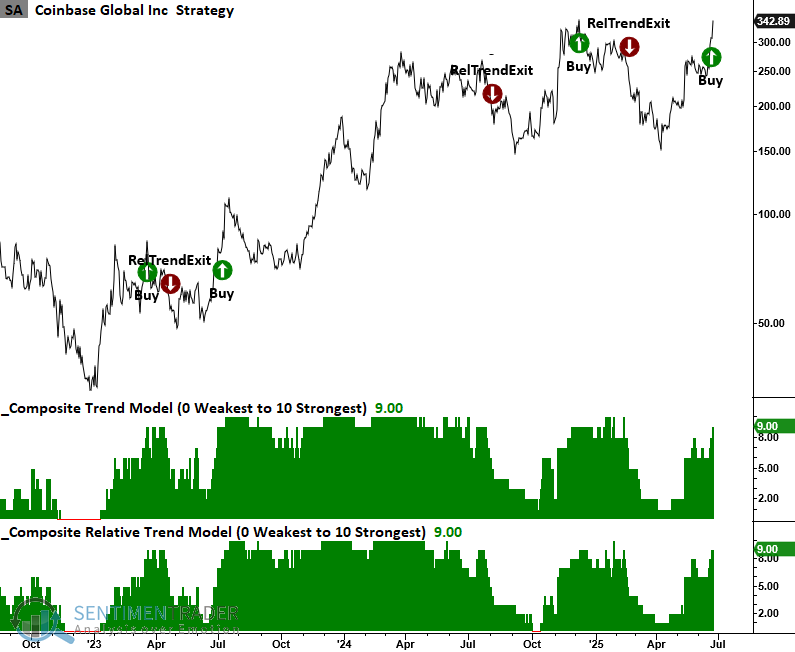
Silver stretched
Silver is back on traders' radars after being mostly an afterthought thanks to gold's impressive run. As a result, the metal became stretched above its moving averages just as it reached a multi-year high.
For one of the few times in decades, silver hit a new high just as it pushed more than 10% above its 50-day moving average and 15% above its 200-day average, before pulling back a bit in recent sessions. The last time it accomplished such a feat was last October, right before a -14% pullback over the next few months.
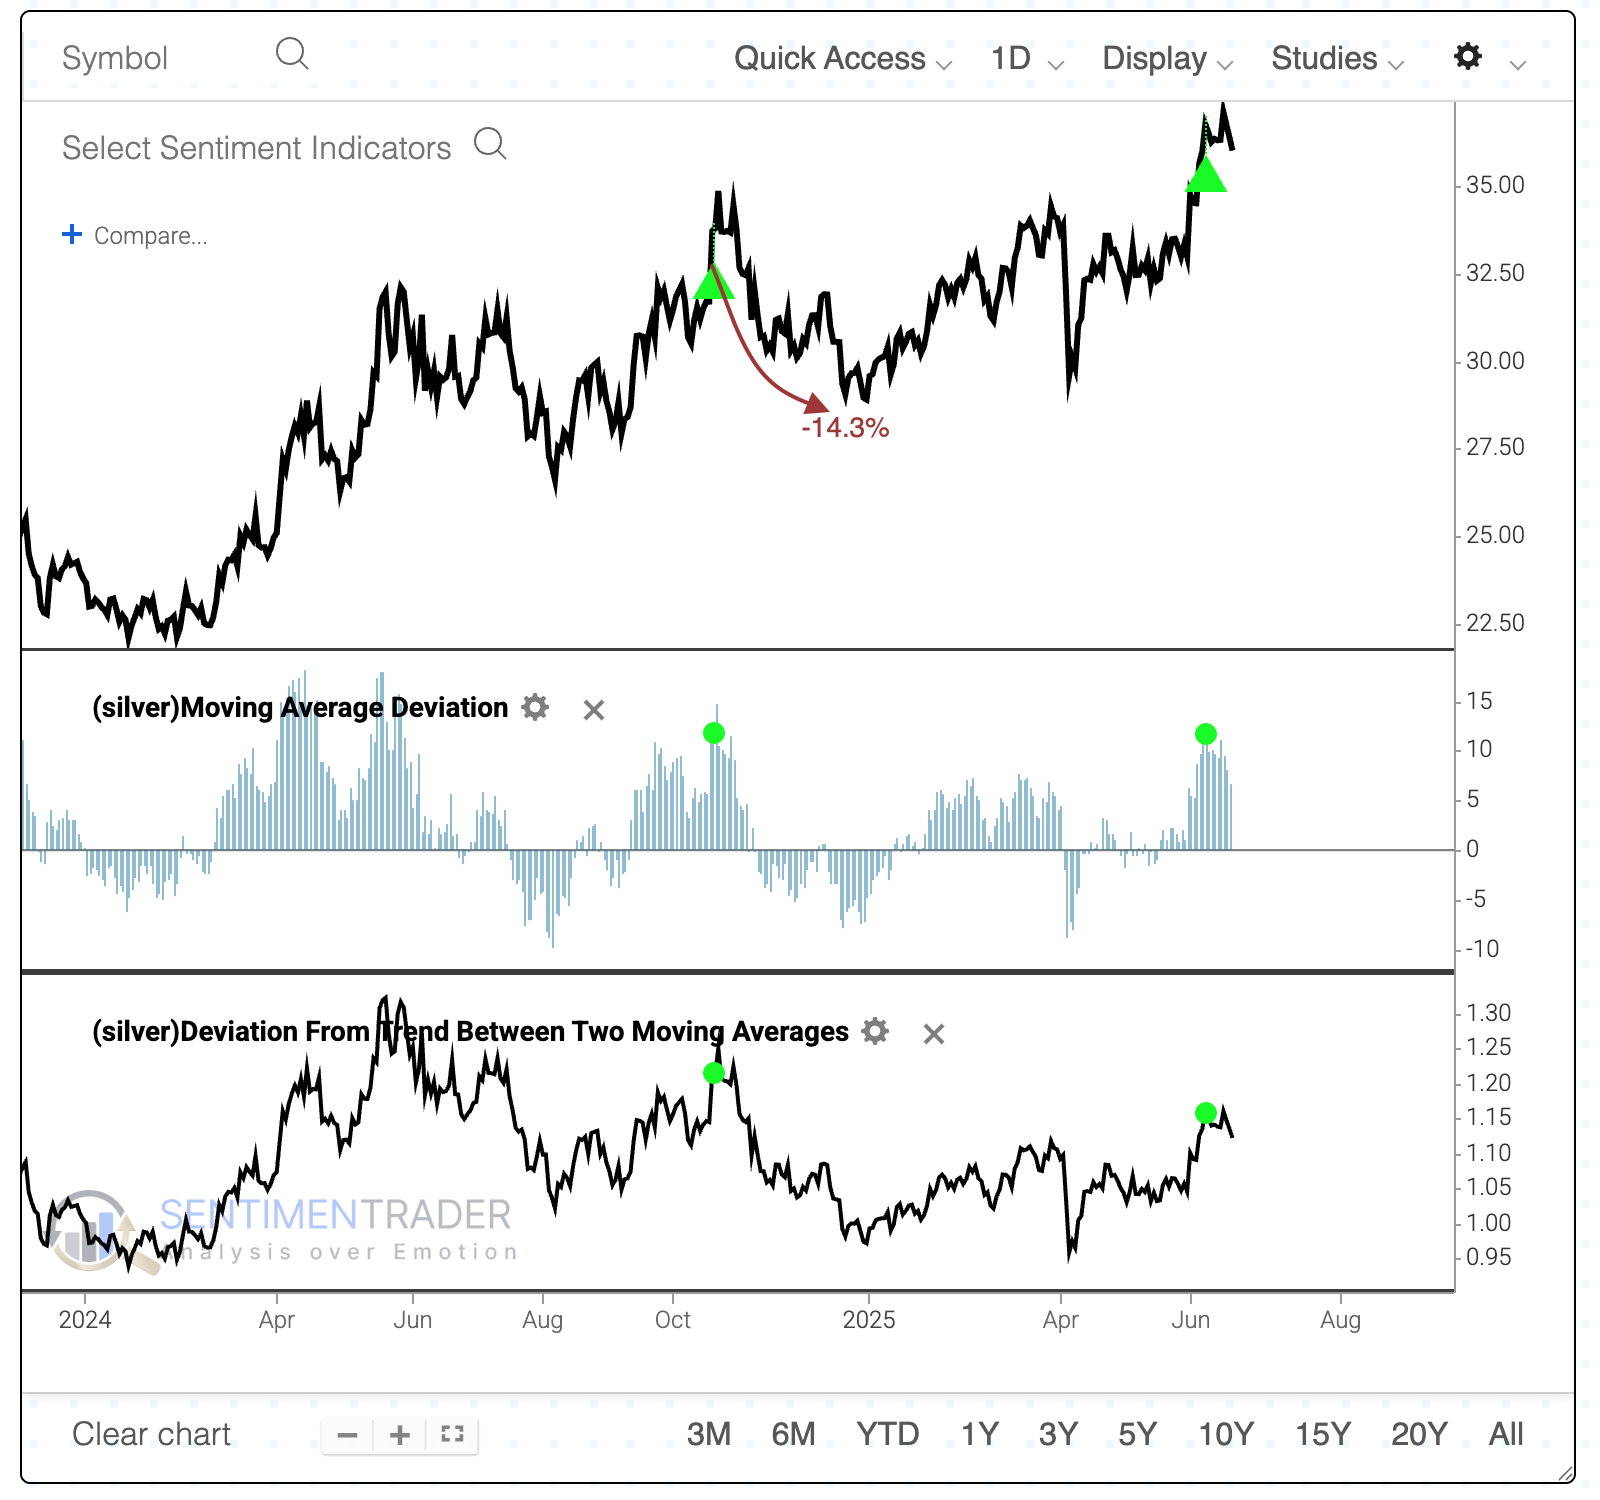
The time before that was a post-COVID money-printing spike in 2020 that saw silver rise exponentially over the next few weeks. After that euphoric spike, it gave back half its gains and then stagnated for years. Another global conflagration in 2007-08 saw silver pull back more than -11% during the next couple of months. The only other precedent for this run in silver occurred in 1995 when it formed a volatile peak before ultimately crashing more than -17% in a short period.
The Optimism Index (Optix) for silver just exceeded 83, which is the highest level in nearly 15 years. Out of 72 days with sentiment at the current extreme, silver showed a negative return 69 times at some point within the next three months.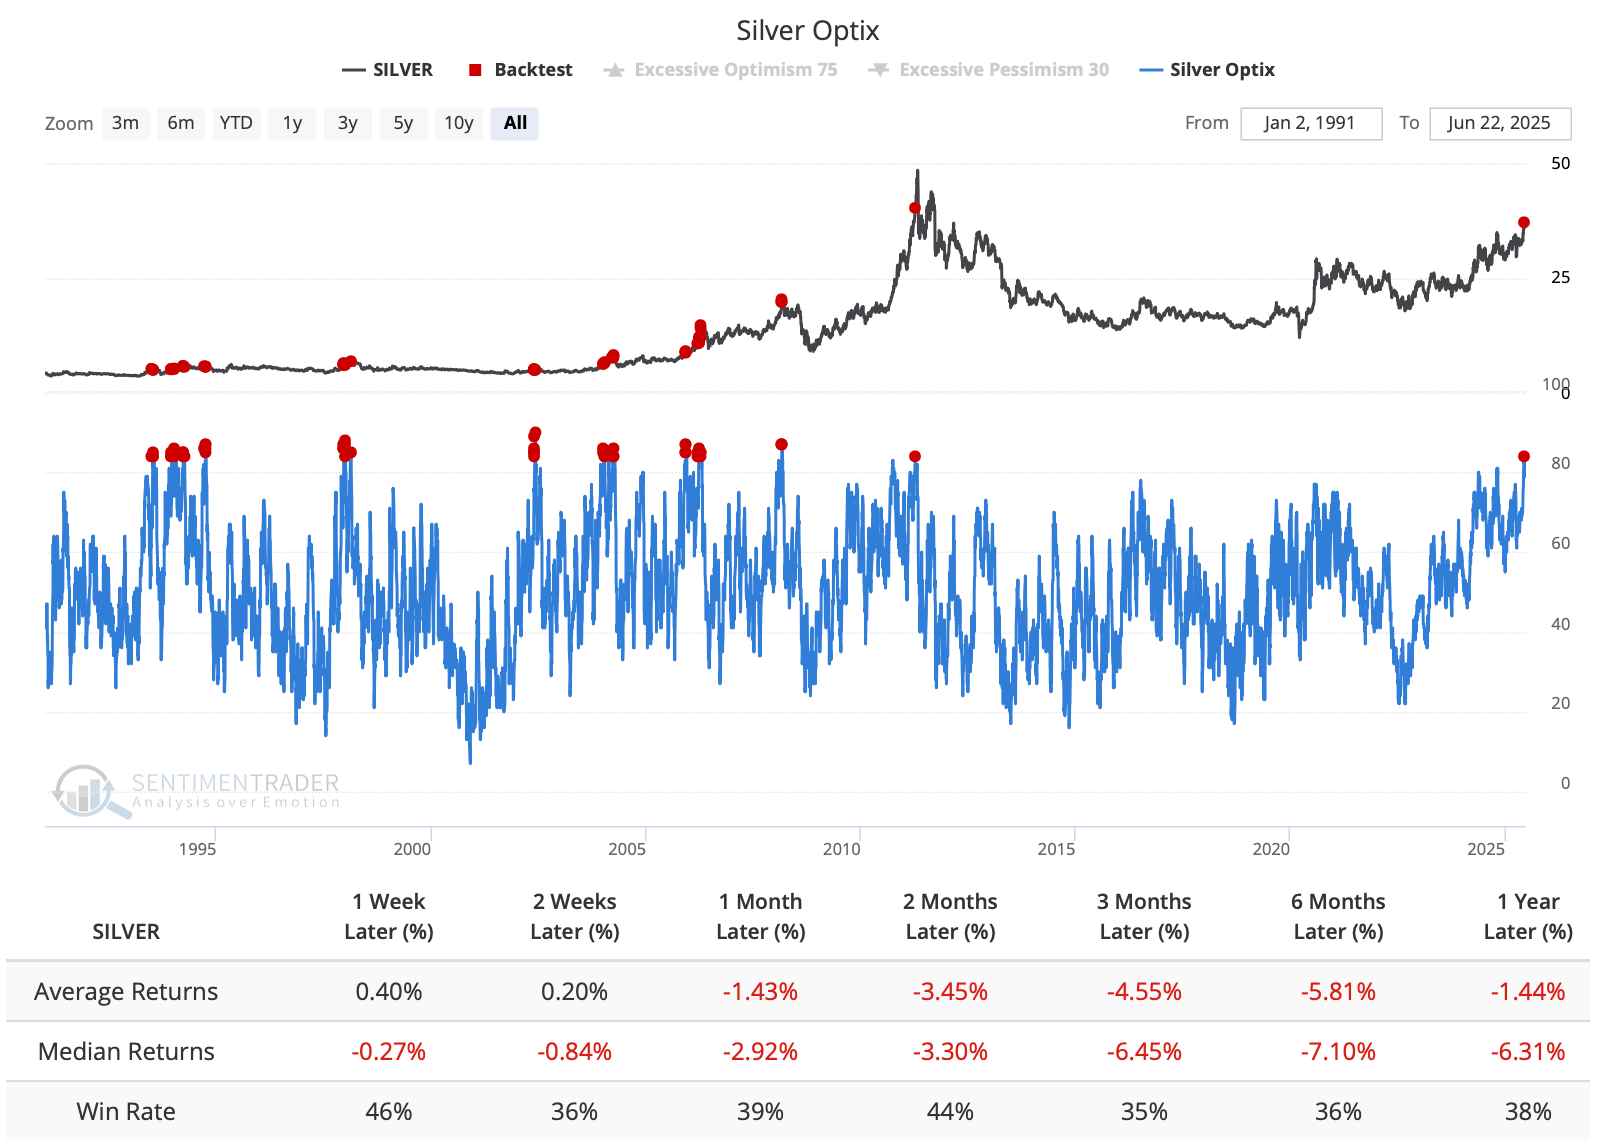
Taking a more systematized view, shorting silver when its Optimism Index crossed below 83 resulted in a profitable short position 8 times and a losing position 3 times if holding for four months.
A major component of the Optimism Index is the behavior of speculators in silver futures. When large speculators hold over 38% of open interest net long its average returns were poor across all time frames.
Seasonally, silver often bottoms around late June and rallies into the early fall. It mostly held to its seasonal pattern to start the year, but has bucked it since then, rallying strongly during a typically soft part of the calendar. History is mixed, whether this is a good sign, with some years showing that a structural imbalance was taking over, while others showing that gains were front-run.
Oil's historic reversal
After years of malaise and some long-awaited relief in June, oil bulls thought they finally had their moment. A war in the Middle East is their dream scenario (assuming their thoughts of profits supersede the nightmare of human suffering). It didn't last long.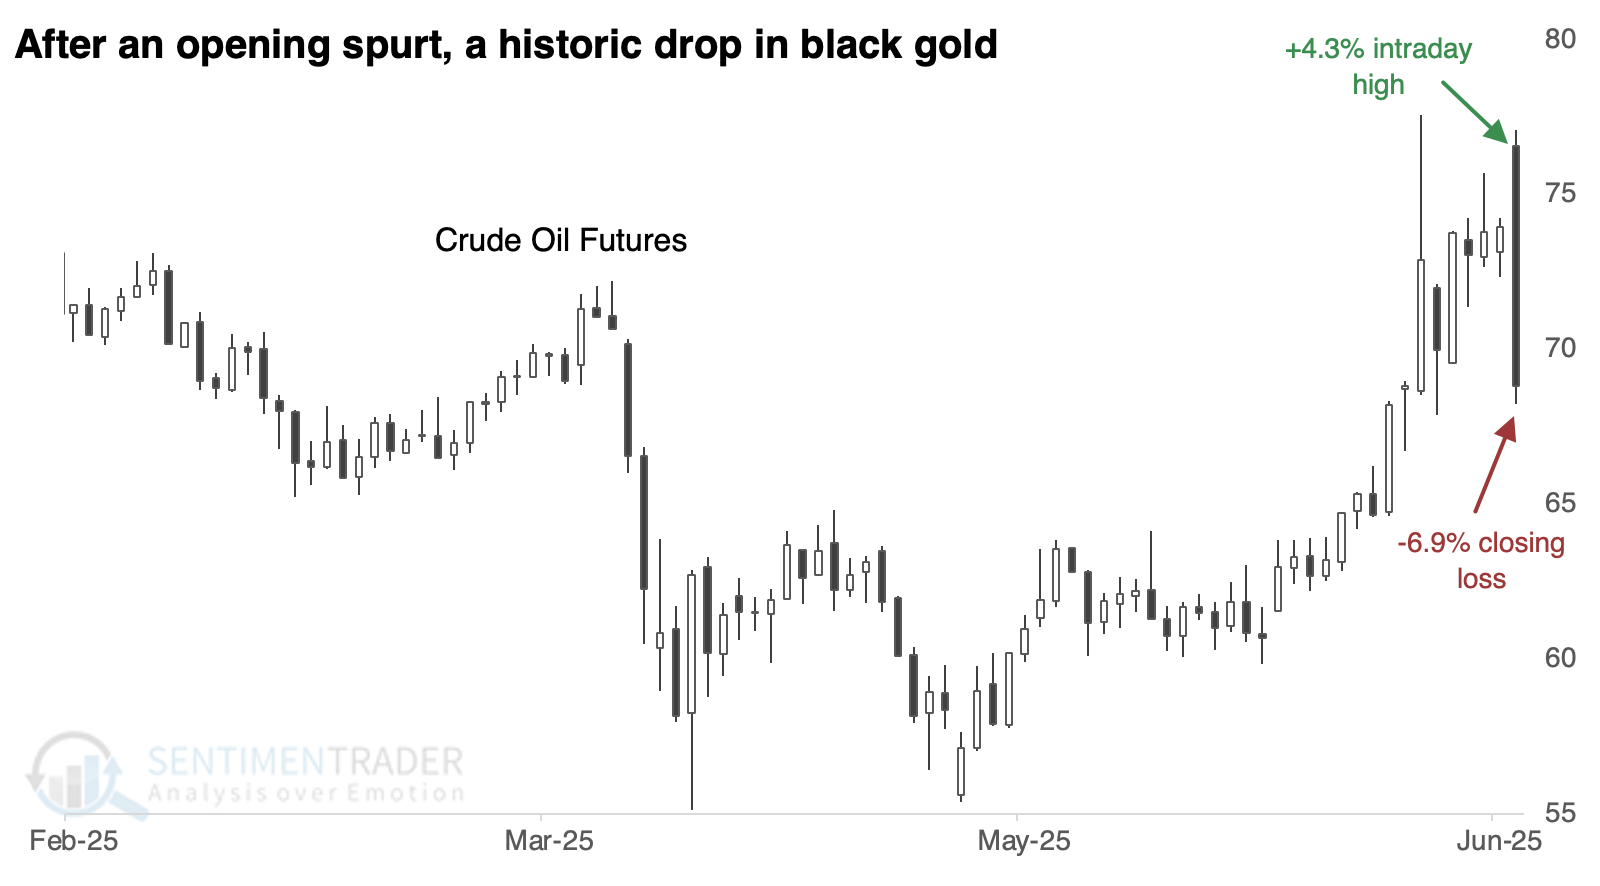
There have only been a handful of times the contract rallied more than +3% intraday, only to close more than -5% below its prior close. These bearish outside reversals have tended to stick over short time frames.
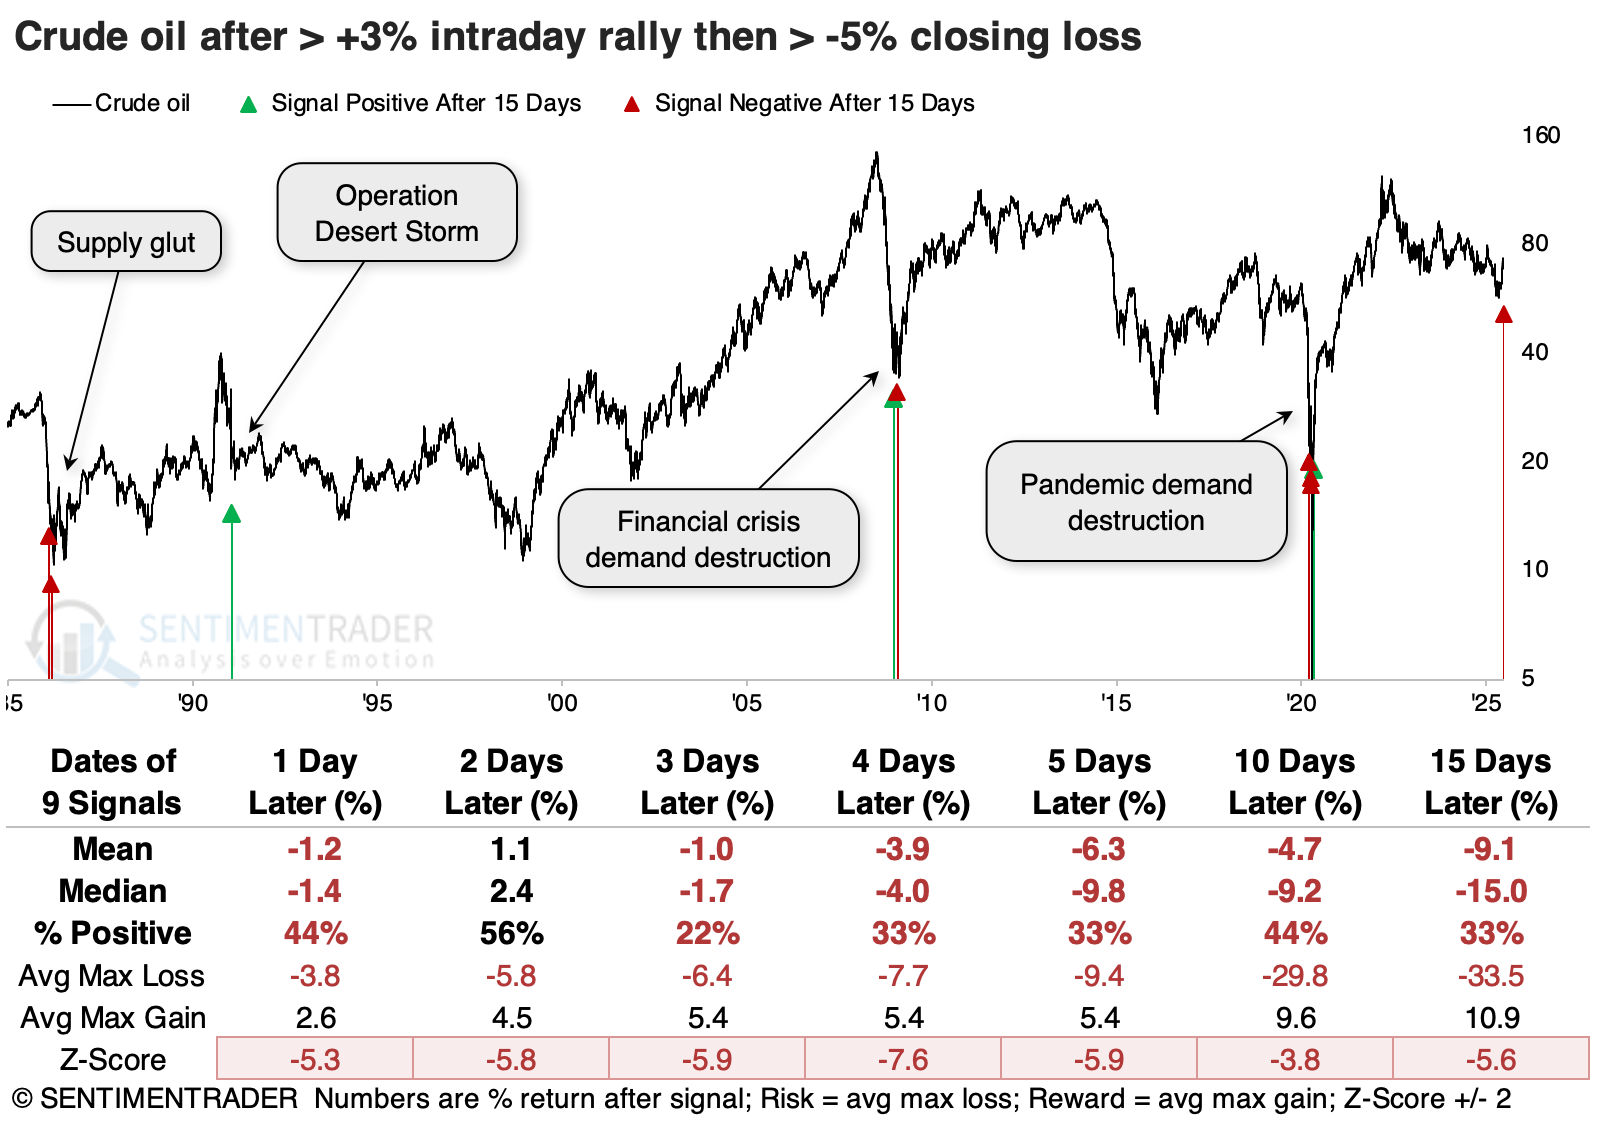
Over longer time frames, the initial losses tended to be reversed more often than not. By three months later, crude oil futures were higher 8 out of 9 times.
Energy stocks also tended to show gains, though not as consistently or impressively. Even so, the sector gained 100% of the time over the following year. The broader S&P 500 did even better in consistency; the S&P witnessed a minimum gain of +21.2% over the following year.
It's difficult to rely on a small sample size, especially when several dates are clustered together. The table below shows crude oil's returns when it turned a +3% intraday rally into a -3% loss by the close. Returns were unimpressive over the next couple of months, but tended to rebound in the month(s) after that, especially since 2008.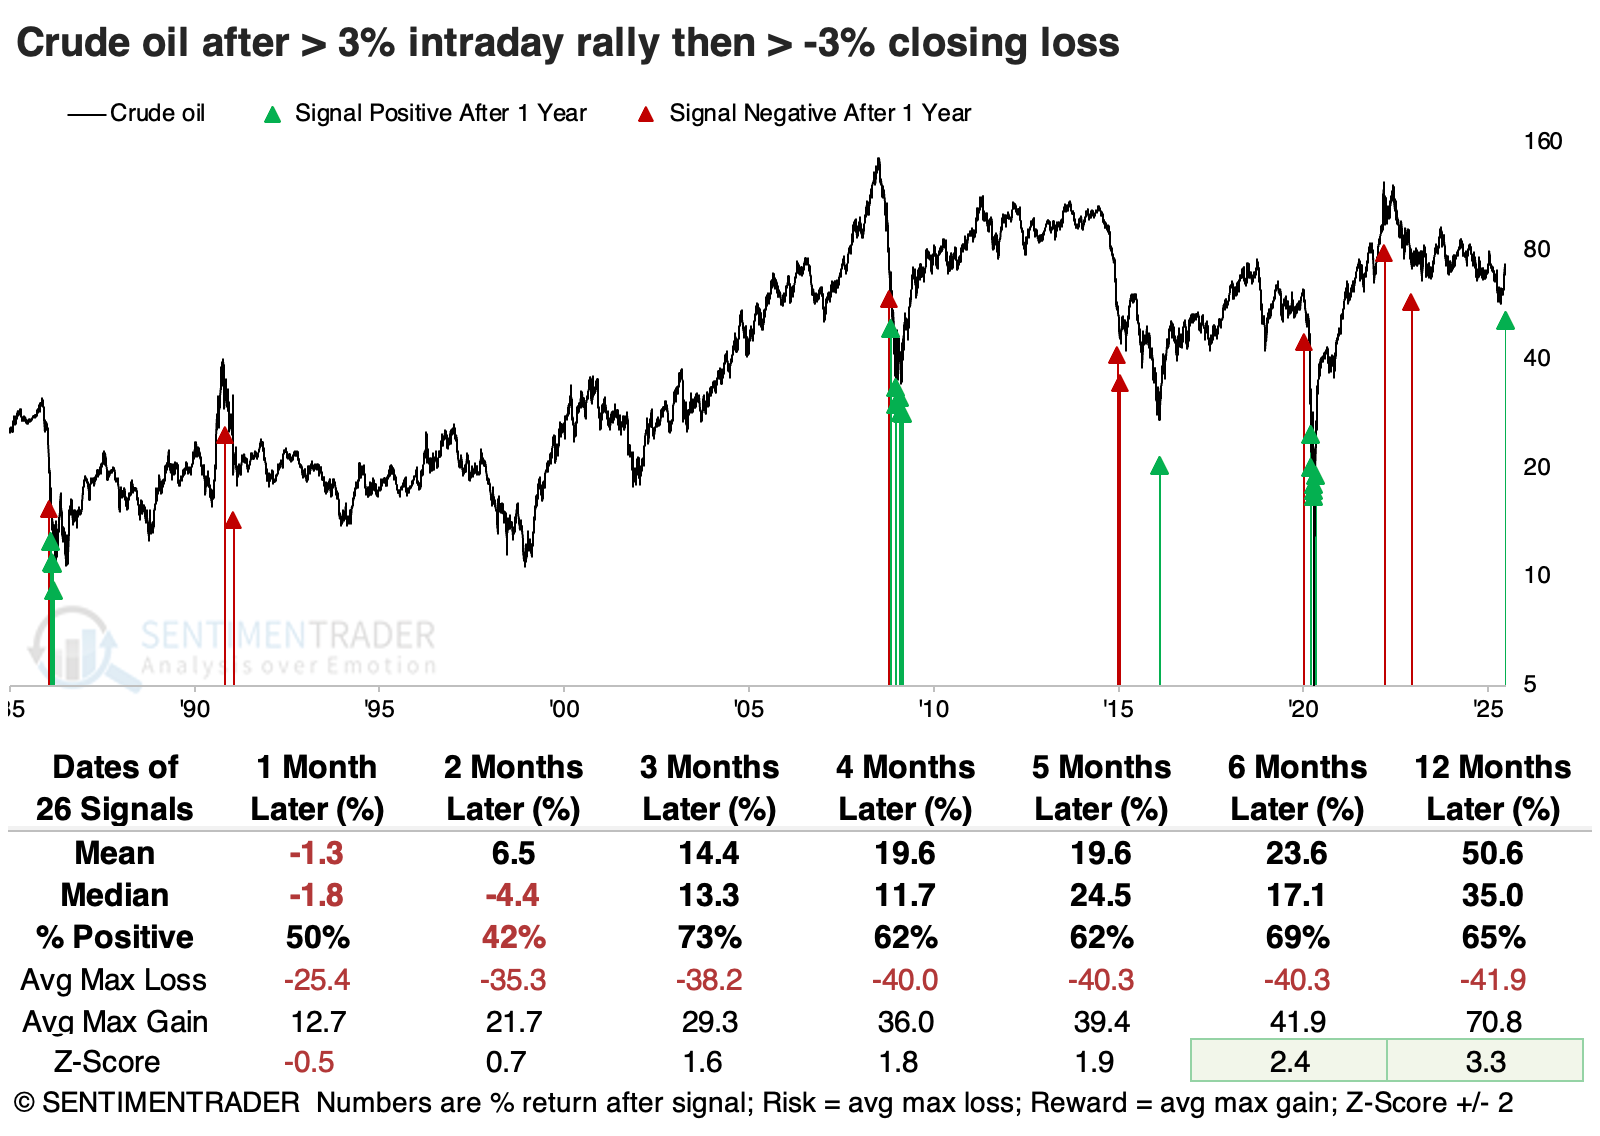
Once again, the S&P 500 tended to be an even bigger beneficiary of these negative reversals in oil prices. From four months and beyond, the index was higher more than 80% of the time, with average returns well above random.
The Nasdaq Composite performed even better than the S&P 500 over all time frames, with an impressive average gain and win rate during the next 6-12 months. Over shorter time frames, a broad commodity index tended to get pulled down along with crude oil, and early rallies in the U.S. dollar showed a strong tendency to peter out. Among all sectors, the most consistently impressive performer was materials.
Running out of gas
Unleaded Gas is entering its weakest time of year. Jay noted that a recent development in crude oil pricing has also flashed a yellow flag.
The chart below displays the annual seasonal trend for Unleaded Gas futures. We see a glaringly obvious tendency for unleaded gas to decline during the year's second half.
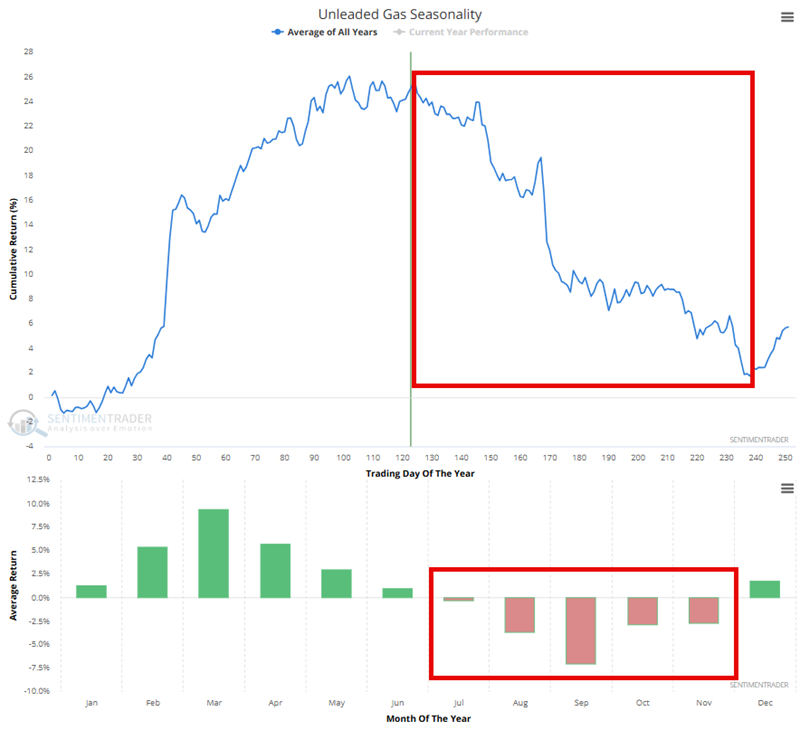
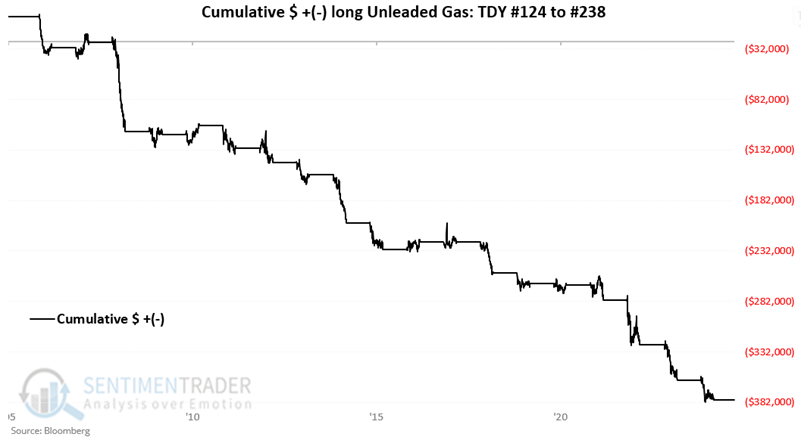
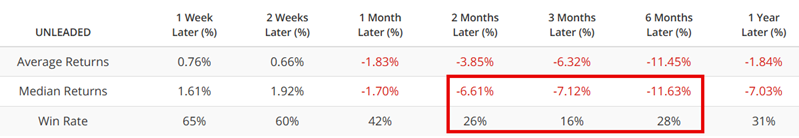
Trading Day of the Year (TDY) #124 through TDY #238 is highlighted in the red box in the upper clip. For 2025, this period extends from the close on 2025-06-25 through 2025-12-04. The chart below displays the hypothetical cumulative $ +(-) achieved by holding a long position in unleaded gas futures during these windows. The contract declined during 84% of years, with an average loss more than 3 times greater than the average gain.
The term structure of crude oil futures shows the relationship of the near-term futures contract to a further-out contract. Crude and unleaded typically trade with a correlation of somewhere in the 80% to 85% range. The chart below uses Unleaded Gas futures as the index and shows the dates when the Crude Oil Term Structure crossed above 1.05 for the first time in 21 days in the last 15 years.
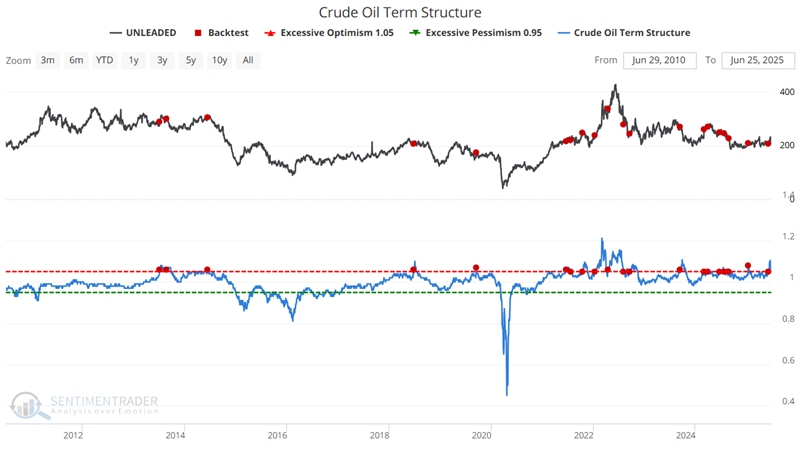
Let's look at combining these two factors into a simple model:
A = If the Trading Day of the Year for Unleaded Gas is between TDY #124 and #238, then A = -2, else A = 0
B = If Crude Oil Term Structure crosses above 1.05, then B = -1 for 63 trading days (a subsequent drop below 1.05 followed by another cross above 1.05 would extend the -1 reading for another 63 trading days)
C = A + B
Variable C can range from 0 (most positive) to -3 (most negative).
The model dropped from -1 to -3 at the close on 2025-06-25, changing the model from "favorable" to "unfavorable." It will stay at -3 until the close on 2025-09-04 (when the 63 trading day counting period for Crude Oil Term Structure signal runs out) UNLESS our Crude Oil Term Structure indicator crosses back above 1.05 between now and then.
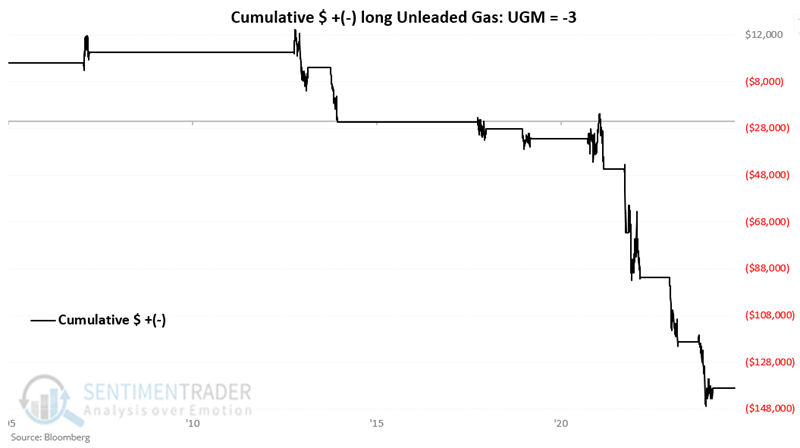
The chart below displays the hypothetical cumulative $ +(-) from holding a long position in Unleaded Gas futures if the model = -3. The hypothetical loss is -$139,003.
About TradingEdge Weekly...
The goal of TradingEdge Weekly is to summarize some of the research published to SentimenTrader over the past week. Sometimes there is a lot to digest, and this summary highlights the highest conviction or most compelling ideas we discussed. This is NOT the published research; rather, it pulls out some of the most relevant parts. It includes links to the published research for convenience, and if you don't subscribe to those products, it will present the options for access.