
TradingEdge Weekly for Jun 23 - Breadth breakout, rising volatility and stocks, Industrial breakouts, Health Care seasonals

Key points:
- An important breakout in breadth
- The S&P 500's breakout last week came as volatility increased, which is unusual
- Unfortunately, the index tends to suffer a summer seasonal swoon
- There is a short-term period around July 4th where stock buck the seasonal swoon
- Stocks in the Industrial sector are seeing some of the most impressive breakouts
- Homebuilders have been hitting quite a few new highs
- Health Care has some compelling bullish factors
- Biotech seasonality is volatile, consistent, and now positive for a while
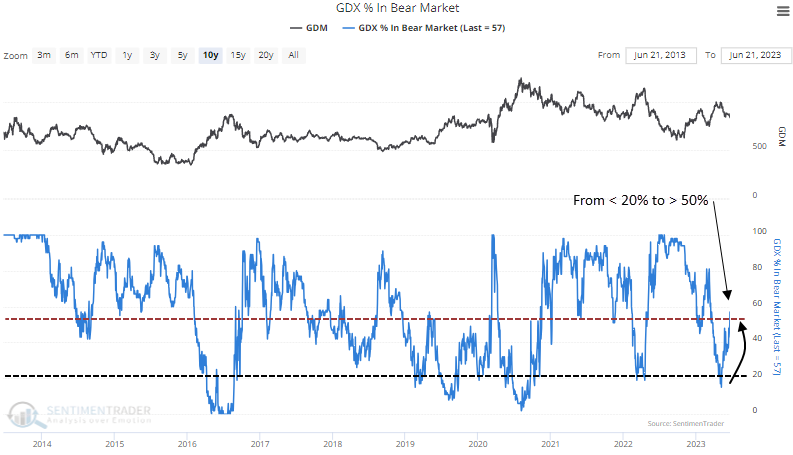
- Most gold miners are back in a bear market
A breakout in breadth
Since last October, we've spent a lot of time outlining the various breadth thrusts in sectors, industries, and across broad indexes. The lasting push has finally been enough to trigger a new all-time high in the S&P 500's Cumulative Advance/Decline Line.
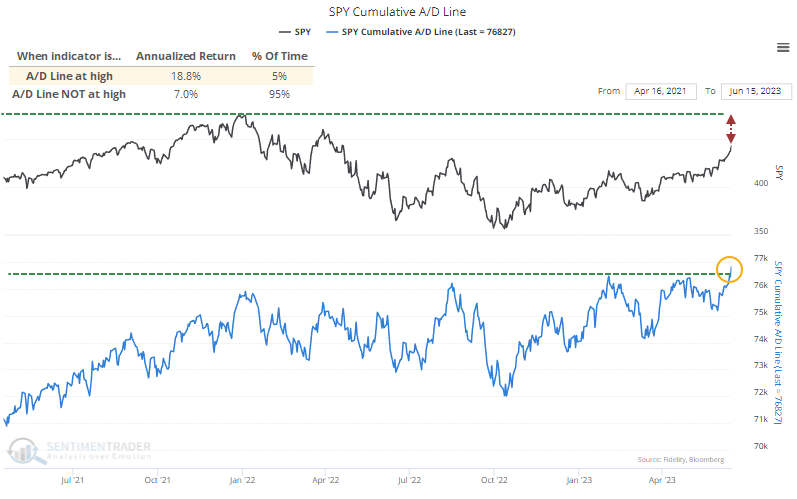
We can see from the chart that when the A/D Line scores a new high, the S&P's annualized return since 1928 has been +18.8%. That's well above those days when the line is not at a new high. After the A/D Line reached a new high for the first time in at least 200 sessions, the most notable aspect tended to be low drawdowns. Out of 23 signals, only 3 witnessed a decline of more than -10% at any point within the next six months.
Not only did the A/D Line reach a fresh 52-week high, but it's also a multi-year high. That necessarily means a smaller sample size, but the S&P's consistency improved over the medium- to long-term after these rarer occurrences. The only signal that suffered a more than -10% drawdown within the next six months was in 2010, which quickly reversed as the S&P soared to new highs.
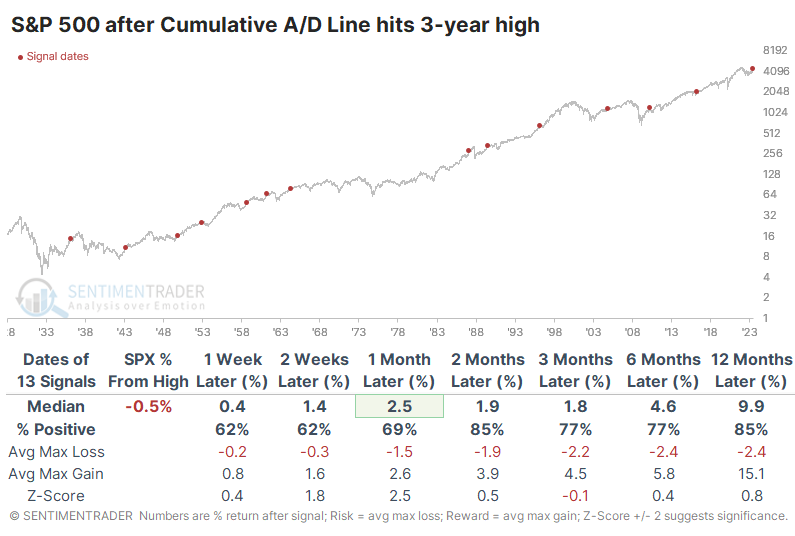
Investors are always worried about the last bear market, and for what that's worth, the A/D Line never reached a 3-year high at any point during the most fearsome protracted bear markets in 2008 or 2001-02.
Even more rare is that the A/D Line has scored a multi-year high while the S&P itself is still well below its own high. If we filter the table above to only include those signals when the line was leading the index, forward returns were quite good. Breadth tended to lead the index higher.
A breakout in the S&P, too...a volatile one
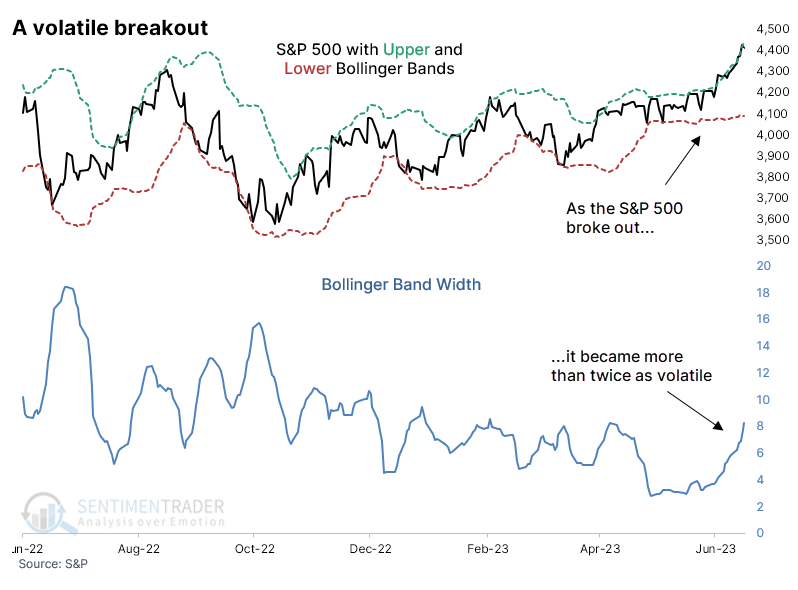
The most benchmarked index in the world broke out to new highs last week and became more volatile in the process. Unlike in most commodities and some currencies, this behavior is atypical - normally, stocks get less volatile as they rise.
Using standard settings for the popular Bollinger Band indicator, we can see how the S&P 500 rose above its upper Band and traded at fresh 52-week highs while the width between those Bands got twice as wide as a few weeks ago.
When the S&P reached a 52-week high with Bands that doubled in width within the past month, it was a good sign for stocks. But its returns weren't special, and the risk/reward was uninspiring.
We like to incorporate a broader context as much as possible. The table below shows S&P returns after the same types of momentum using Bollinger Bands, but with the added condition that it's the first set of 52-week highs in the index in at least three months. This prevents us from comparing the recent breakout to something like 1929 or 2000, when stocks had been hitting new highs for months.
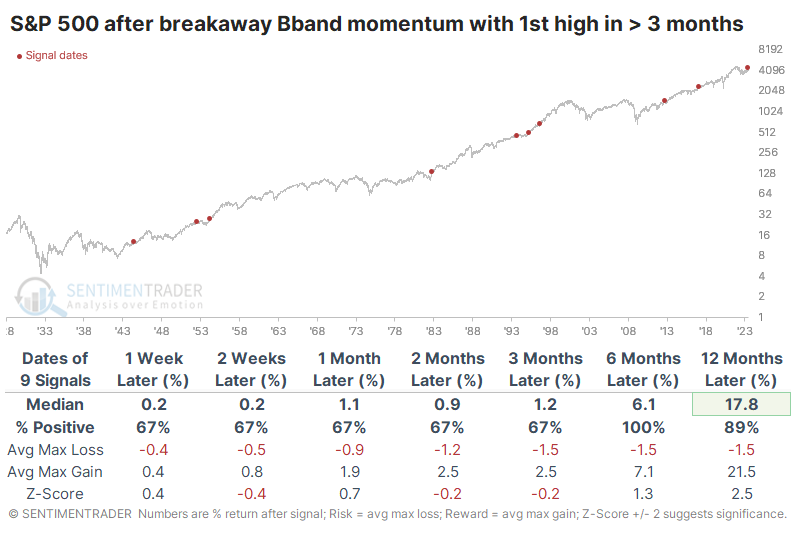
After these precedents, the S&P never showed a loss over the next six months, and losses across any time frame were rare and limited in scope. Even up to a year later, the largest drawdown was a very modest -7.3%, while the maximum gain averaged more than +21%.
A summer seasonal swoon
Jay noted that the stock market has shown a long-term tendency to perform less well during the summer months of June/July/August than during the rest of the year. To watch a recent interview with Jay with Negocios TV, click here.
The chart below displays the Annual Seasonal Trend for the S&P 500 Index. Note that the average performance during the June - August period is a sideways affair.
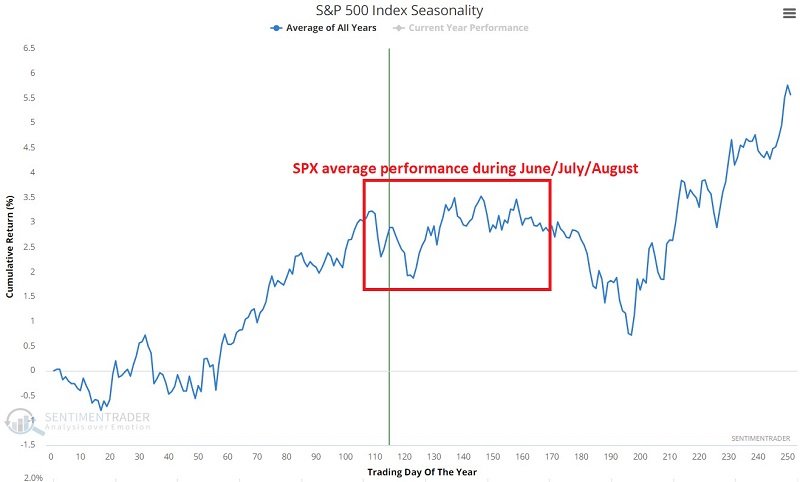
It is important to note that year-to-year performance can vary greatly - with some years showing exceptional gains, others with severe declines, and others still with something resembling the "going nowhere" action shown below.
The chart below displays the growth of $1, assuming an investor held a long position in the S&P 500 Index every year ONLY during June, July, and August, starting in 1940.
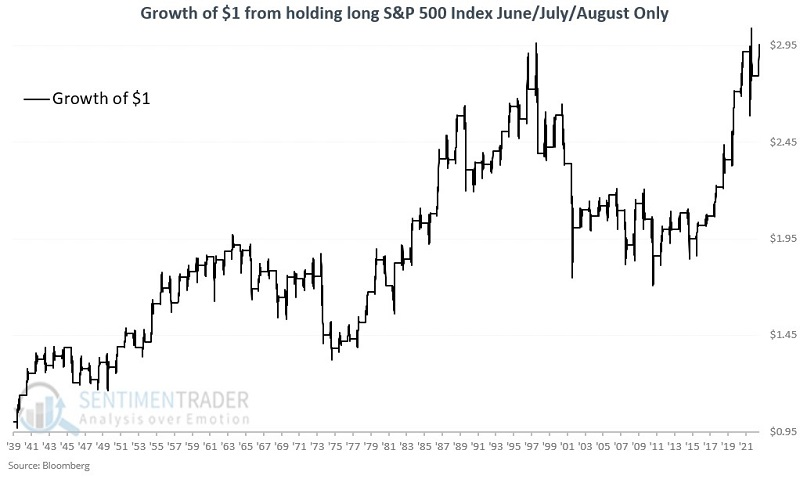
At a glance, the results seem OK, if a bit choppy. The $1 grew to $2.93, for a cumulative % gain of +193%.
To put the June/July/August returns from the chart above into perspective, the chart below shows the growth of $1 for an investor who held a long position in the S&P 500 Index every year ONLY during June, July, and August (in black) versus ALL MONTHS OTHER THAN June, July, and August (in blue).
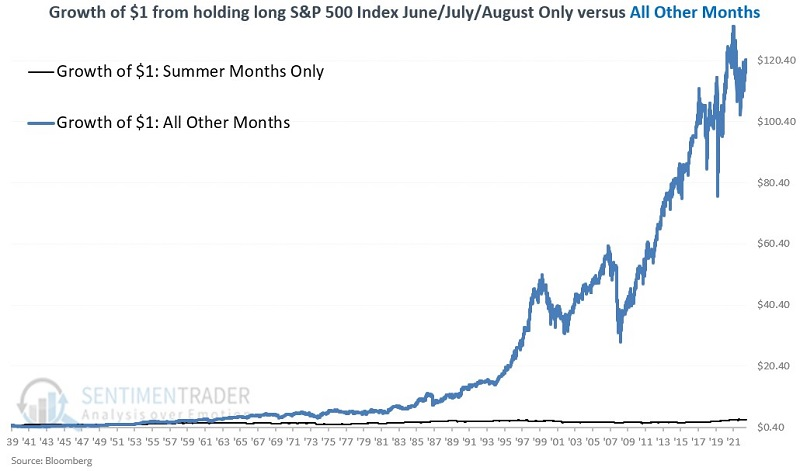
The summer months of June/July/August combined gained +193% since 1940 while all other months combined gained +11,884%. Suddenly, summer month returns don't look so great.
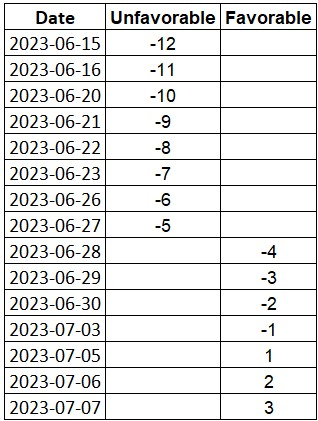
Jay further outlined a short-term period coming up soon that has tended to buck the seasonal swoon. We will break the July 4th period into two parts:
- The four trading days before AND the three trading days after July 4th are deemed "favorable" as the market has tended to rally near market holidays
- The eight trading days before the start of this favorable period are deemed "unfavorable"
The table below displays the pattern described above applied to 2023. The unfavorable period extends from the close on 2023-06-14 through the close on 2023-06-28. The favorable period extends from the close on 2023-06-28 through the close on 2023-07-07.
We started our test in 1934 using daily closing price data for the S&P 500 Index. The chart below displays the growth of $1 and the S&P 500 performance for the favorable and unfavorable periods together. The favorable period has achieved a hypothetical total gain of +169% while the unfavorable period has achieved a hypothetical loss of -35%.
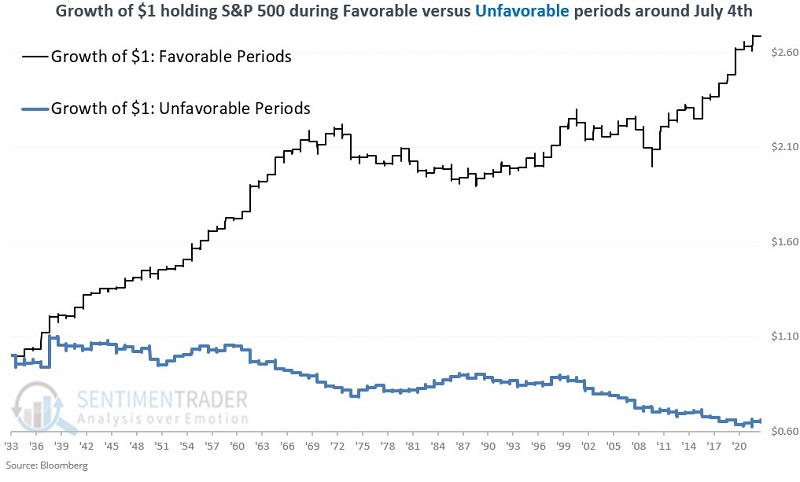
The favorable periods rallied during 69% of the years, averaging +1.2%. The unfavorable periods showed a gain during 44% of years and sported an average return of -0.5%.
Industrial stocks are breaking out along with the S&P 500
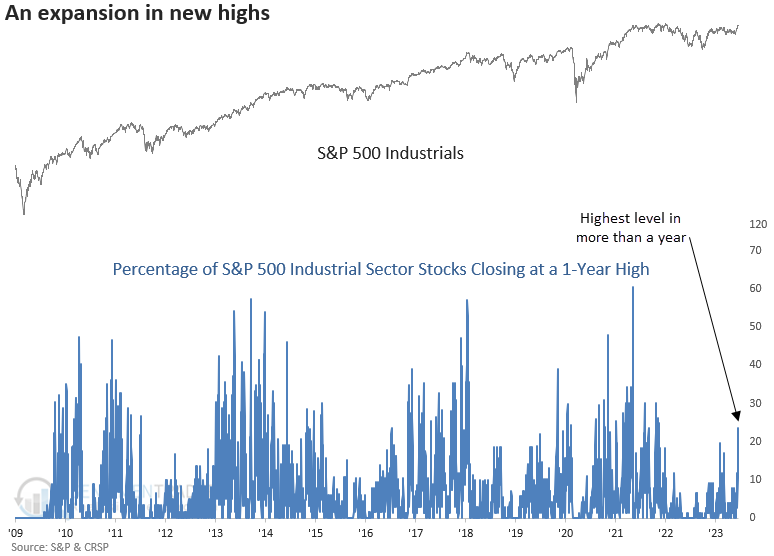
Dean noted that the percentage of S&P 500 Industrial sector stocks closing at a 1-year high exceeded 23%, the highest in more than a year. Following similar expansions in new highs, both industrials and the S&P 500 displayed solid results.
The prevailing concern for most market participants has been the lack of broad-based participation from sectors beyond a handful of growth-oriented groups. But nowhere is the improvement in breadth more evident than in large-cap Industrial stocks. In that sector, new highs expanded above 23% of all members - better than all other sectors, including Technology.
When the percentage of S&P 500 Industrial sector stocks closing at a 1-year high exceeds 23% and records the highest level achieved in the past year, the sector tends to rise over the subsequent year. The Dotcom bust was the lone exception.
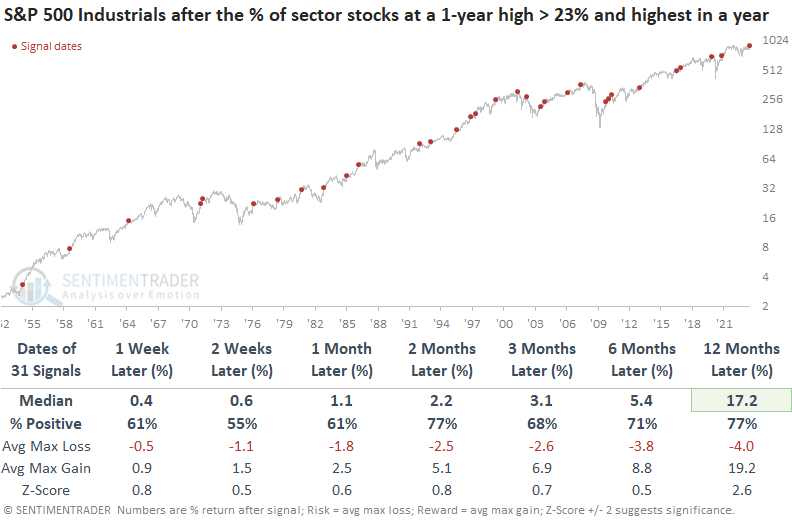
The S&P 500 shows a solid tendency to rally when the percentage of 1-year highs for S&P 500 Industrial sector stocks expand like now. Similar to the industrial sector outlook, the lone hiccup a year later occurred during the Dotcom bust.
Homebuilders have been hitting quite a few new highs
Dean showed that over the last year, homebuilders have achieved a 1-year high on 21 occasions. The persistent increase in new highs occurred after the industry failed to record a single high, and similar behavior resulted in positive returns for homebuilders and the S&P 500.
With significantly better-than-expected housing starts and permits data released on Tuesday, Dean checked on the homebuilders. He noticed that the sector had quietly accumulated 21 new highs over the past year.
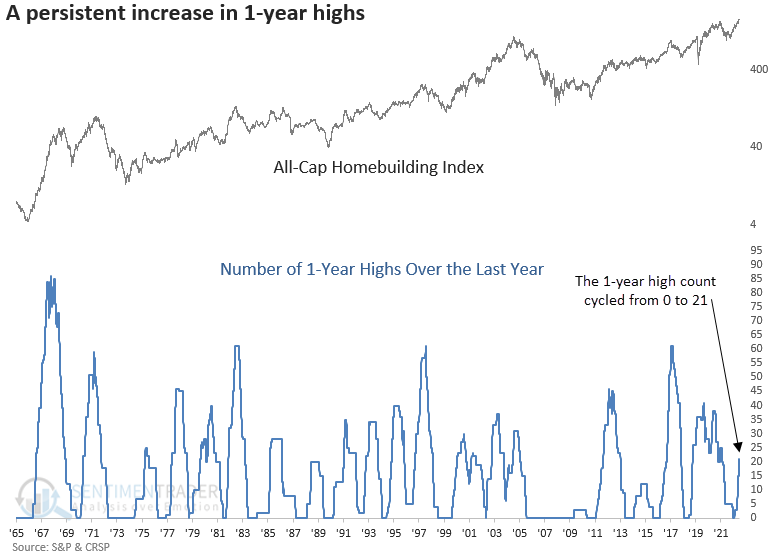
When the 1-year high count for the homebuilding sub-industry group cycles from 0 to 21, the favorable industry momentum tended to continue, especially up to three months later. Over that period, builders were higher at some point in all but one case. A year later, the group was higher 86% of the time, with only one significant loss. Over the next three months, the max gain exceeded the max loss in 12 out of 14 precedents.
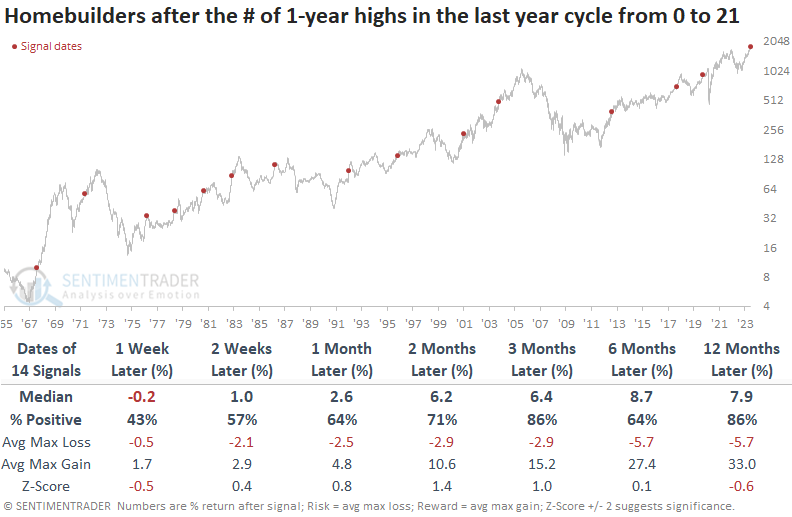
The S&P 500 tended to trend upward when homebuilders registered a significant number of 1-year highs. Except for one instance, the large-cap index increased a year later. The lone exception occurred during the 2000-02 bear market when housing was a bright spot in a generally soft economy.
A seasonal respite for Health Care
Jay showed that a variety of indicators suggest better days might be ahead for the Health Care sector. These include signals from seasonal, insider, and breadth indicators.
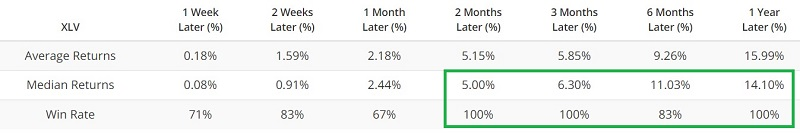
The sector is in a favorable seasonal period extending from the close of Trading Day of the Year (TDY) #113 through TDY #158. For 2023, this period extends from the close on 2023-06-14 through 2023-08-22.
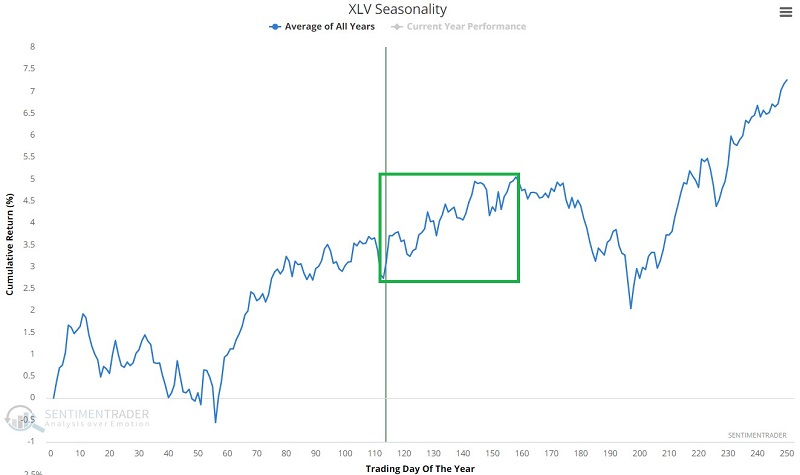
For the chart below, we use sector index data starting in 1953. The chart below displays the growth of $1 if held in the healthcare sector only during these seasonal windows since then.
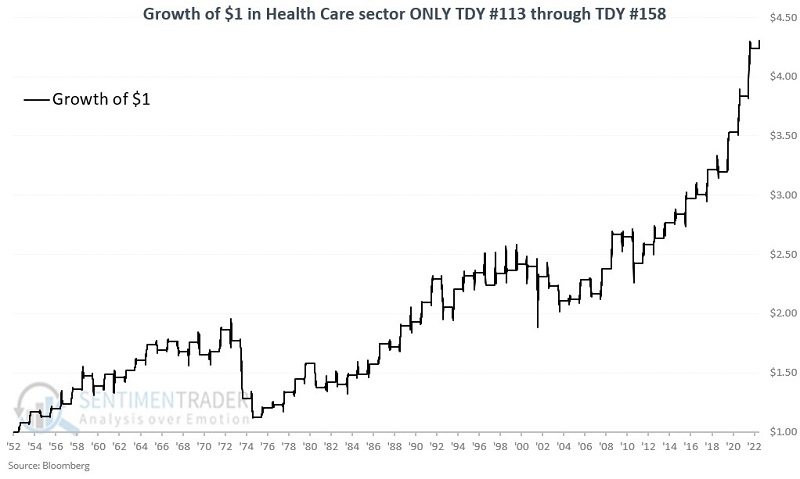
The sector sported a gain 69% of the time, with an average gain larger than the average loss and it was nearly twice as likely to show a 10% gain than a 10% loss.
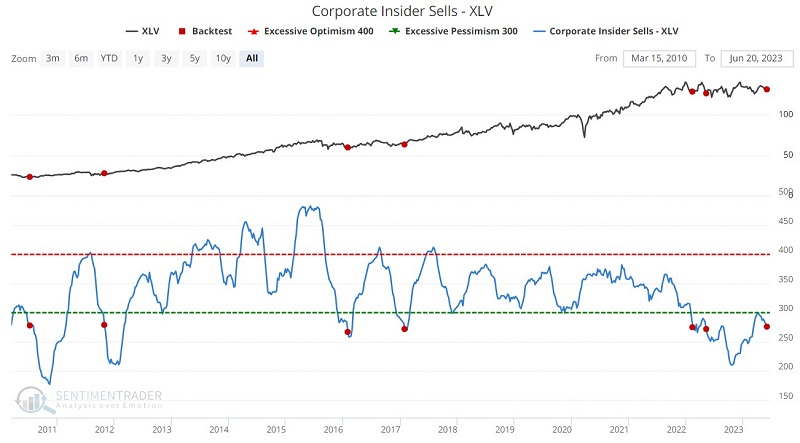
The most bullish thing insiders can do is buy shares of their own company. The second most bullish thing insiders can do is not to sell shares of their own company. The chart below shows that our Corporate Insider Sells - XLV indicator recently crossed below 280. The table displays all previous instances. Historically, sector performance has been favorable when healthcare insiders reduce their sales.
Breadth in the sector is improving from a deeply oversold condition. Jay noted that when the XLV McClellan Oscillator indicator was below -100, which was triggered near the end of May 2023, the sector showed greater than a 90% chance of rallying over the next 3-12 months.
Biotech's volatile - but fairly consistent - seasonal pattern
Jay also noted that the biotech sector has shown consistent cyclicality in the past 22 years and it just entered one of three notable seasonally favorable periods.
The chart below displays the annual seasonal trend for the iShares Biotechnology ETF (ticker IBB).
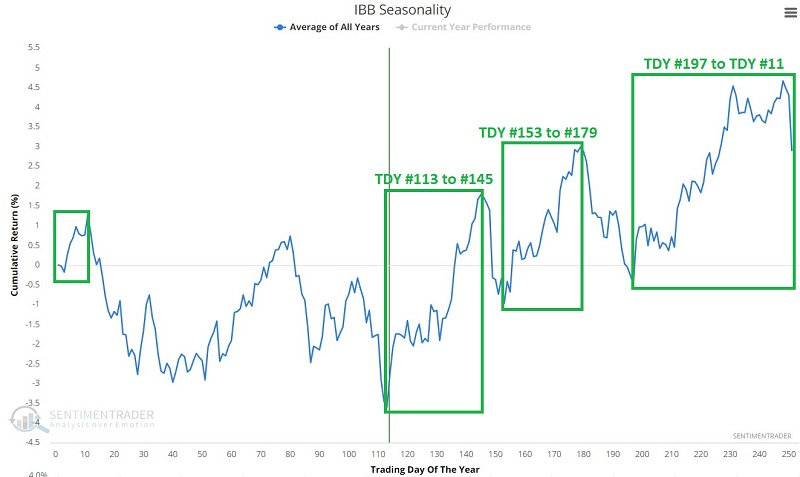
Note that there are three distinct favorable periods within the calendar year.
- TDY (Trading Day of Year) #113 through TDY #145
- TDY #153 to TDY #179
- TDY #197 to TDY #11 (of the next year)
For 2023, the current favorable period extends from the close on 2023-06-14 through the close on 2023-08-02. WIn Rates for these three periods range from 68% to 73%, so one never knows if a supposedly favorable period will show a gain in any given year.
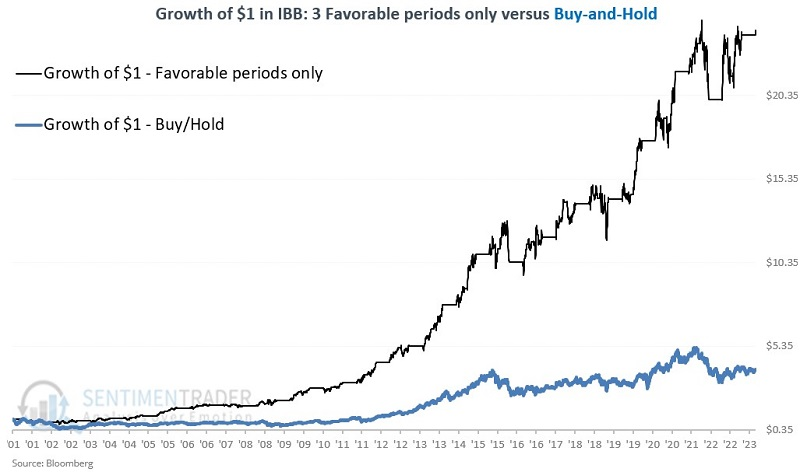
Still, the chart below assumes a trader held IBB only during the three favorable seasonal periods highlighted above every year since 2001. The cumulative hypothetical gain is +2,294% versus +286% for a buy-and-hold approach.
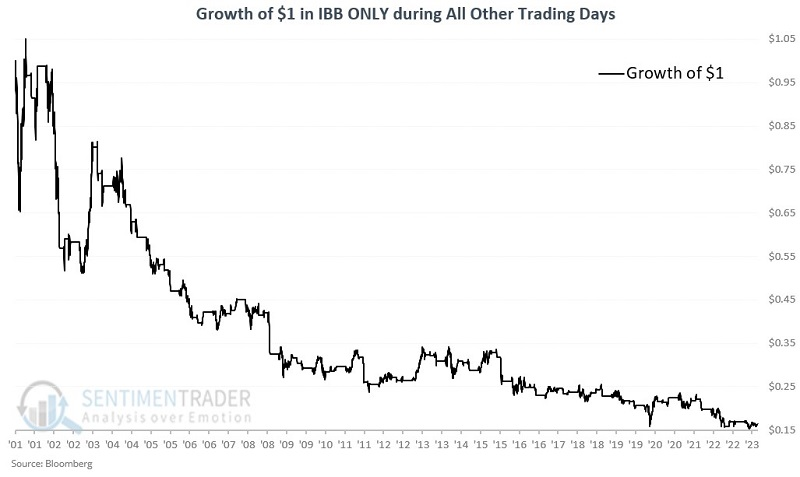
Let's focus solely on the non-favorable periods. The chart below assumes a trader held IBB during all trading days since 2001 that did not fall within one of the three favorable periods highlighted above. The long-term trend is unmistakable; the hypothetical cumulative return was -84%.
The real question is, "What to do with this information?" The abovementioned seasonal approach has vastly outperformed buy-and-hold as a hypothetical standalone trading model. There are two things to keep in mind:
- There is no guarantee whatsoever that future results will resemble past results
- There is a question of drawdowns
A systematic approach of holding IBB only during the three favorable seasonal periods each year witnessed a -32% maximum drawdown in the 2000-2002 bear market and three other separate drawdowns of over -19% since.
Whether you can - or even should - hold on through drawdowns of this magnitude is a question each trader must answer for themselves. One possibility is to allocate a relatively small portion of one's total trading capital. Another possibility for traders is to favor the long side of IBB during the favorable seasonal periods and the short side during all other periods.
Most gold miners are back in a bear market
Dean showed that the percentage of gold miners in a bear market cycled from fewer than 20% to greater than 50%. Similar reversals led to negative returns for miners over the next one to three months and while the impact on gold futures was limited, the situation differs significantly when it comes to silver.
The gold mining industry tends to encounter difficulties over a medium-term horizon when the percentage of miners in a bear market shifts from less than 20% to over 50%. The signal showed a loss at some point over the next three months in 24 out of 25 precedents. Even during the last major gold bull market between 2000 and 2007, the miners consistently experienced downturns over the subsequent two months.
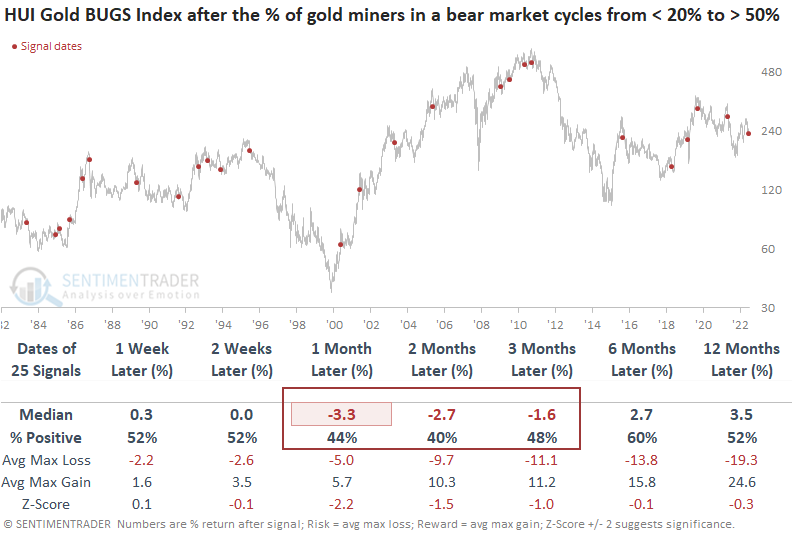
The reversal in the percentage of gold mining stocks in a bear market does not foreshadow an unfriendly environment for gold futures. Still, the outlook is not exactly inspiring because even though the metal rallied most of the time across all time frames, its median returns were not significantly above random.
Silver, the higher beta precious metal, exhibits a stronger correlation with mining stocks. Returns and win rates were consistently unfavorable over a more extended period. Silver rallied over the next three months only 32% of the time.
About TradingEdge Weekly...
The goal of TradingEdge Weekly is to summarize some of the research published to SentimenTrader over the past week. Sometimes there is a lot to digest, and this summary highlights the highest conviction or most compelling ideas we discussed. This is NOT the published research; rather, it pulls out some of the most relevant parts. It includes links to the published research for convenience, and if you don't subscribe to those products, it will present the options for access.