
TradingEdge Weekly for Jun 21 - Tech overbought with bad participation, global flip, rising unemployment

Key points:
- The tech sector is "bad overbought"
- There is a historically negative divergence in big tech
- A jump in new lows on the NYSE relative to new highs triggered a risk-off signal
- There has been a quick flip in uptrends among global indices
- Unemployment is now (arguably) rising, which signals trouble for stocks
- However, long-term models remain favorable
- And corporate insiders look like they're getting more interested in buying their shares
- The S&P 500 has enjoyed an abnormally long stretch of calm with a cluster of new highs
- Emerging markets see a sunny seasonal stretch
Bad overbought
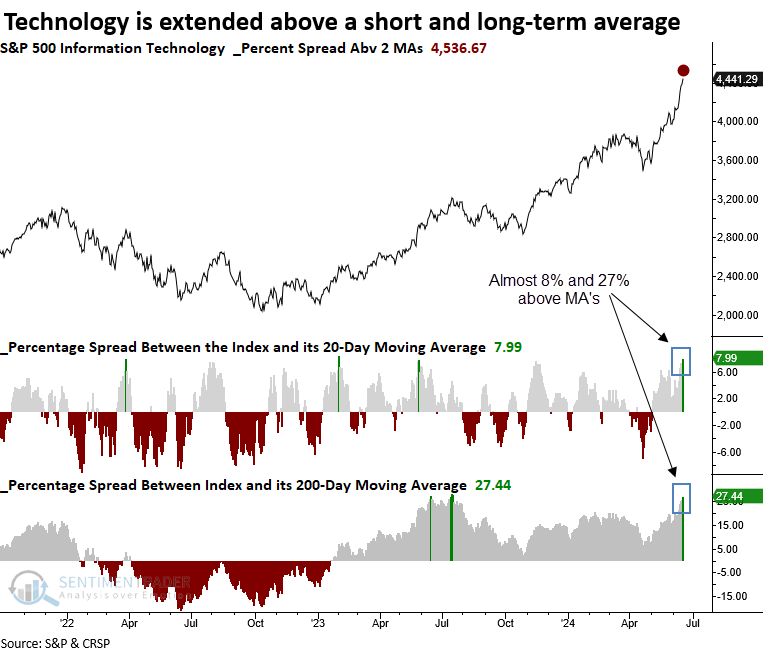
Momentum in Technology has pushed the sector significantly above a short and long-term average. Dean showed that similar overbought conditions preceded an unfavorable outlook for Technology over the subsequent month.
Over the past month, the S&P 500 Technology sector has surged, fueled by demand for AI stocks, especially in the semiconductor industry. This positive price momentum has propelled the sector well above its 20 and 200-day moving averages, a feat achieved only 13 other times in history when excluding repeat occurrences.
Whenever the S&P 500 Technology sector has simultaneously closed 7.75% above its 20-day average and 27% above its 200-day average, it tended to struggle over the following month, with 11 out of 13 instances showing a loss at some point during that period. The long-term results suggest a pause that refreshes a bullish trend.
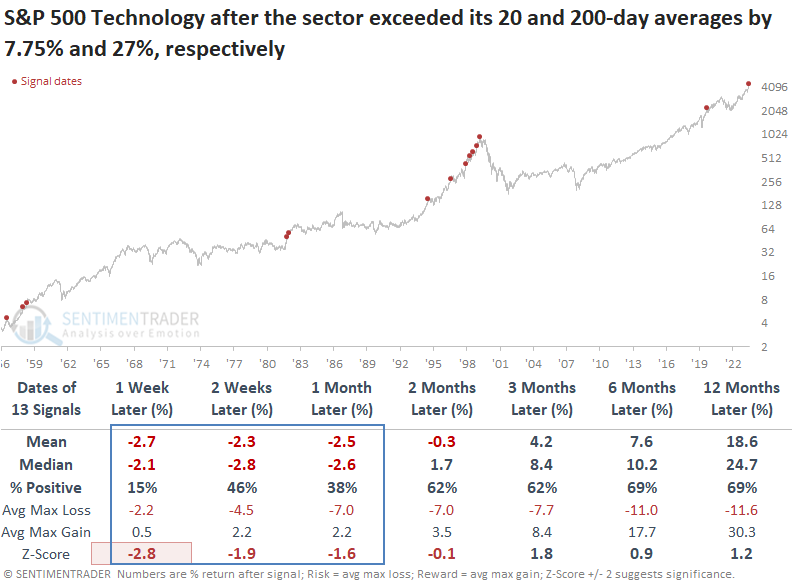
Applying these signals to the S&P 500 indicates that the world's most benchmarked index future might parallel the Technology sector's potential short-term difficulties. With the Technology sector currently holding a significant portion of the S&P 500's weighting, a deceleration in this sector would likely exert downward pressure on the broader market.
Historic divergence in big tech
The big-tech-dominated Nasdaq 100 (NDX) continues to notch record high after record high. However, many of its stocks are falling to monthly, quarterly, or even yearly lows.
This is not normal. In fact, it's never happened before to this degree.
More stocks in the NDX are falling to 1-month and 3-month lows than rising to 1-month and 3-month highs. There have only been two other distinct times when the NDX closed at a 3-year high, but more stocks fell to 3-month lows than rose to 3-month highs. Both preceded nearly immediate pullbacks. Even on a longer time frame, the trends are not healthy. As of last Friday, there were fewer than 3% more stocks at 52-week highs than lows. This exceptionally weak reading was last seen about 25 years ago.
We can also see weak breadth trends by observing the percentage of Nasdaq 100 stocks trading above their 10-day, 50-day, and 200-day moving averages. Across the board, the current numbers are flaccid.
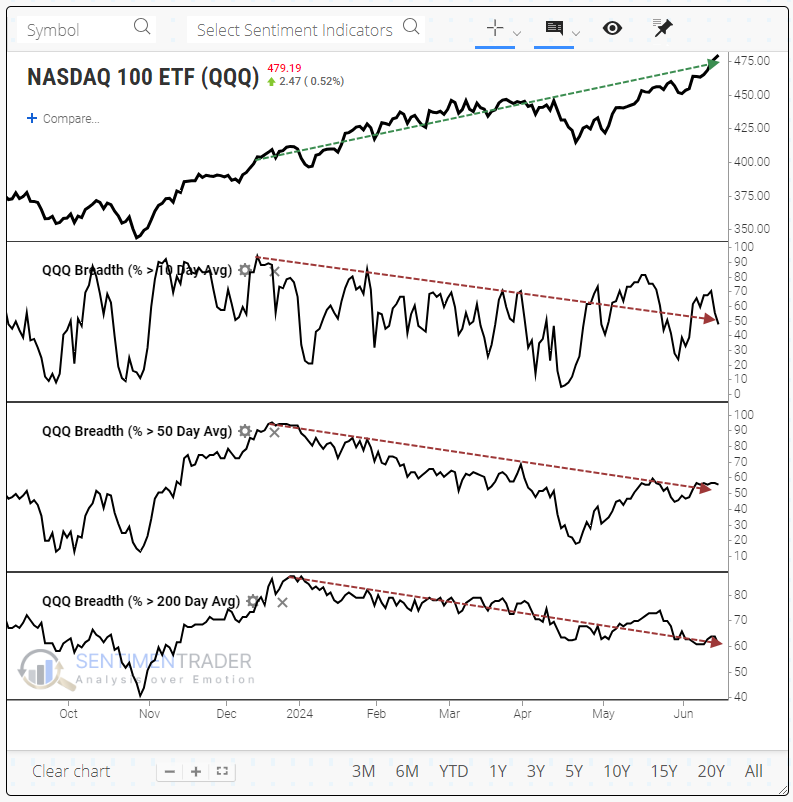
The only time in the past 20 years when so few members were above their moving averages was at the peak in October 2007. Every one of the prior dates witnessed weakness in the Nasdaq 100 between one and three months later.
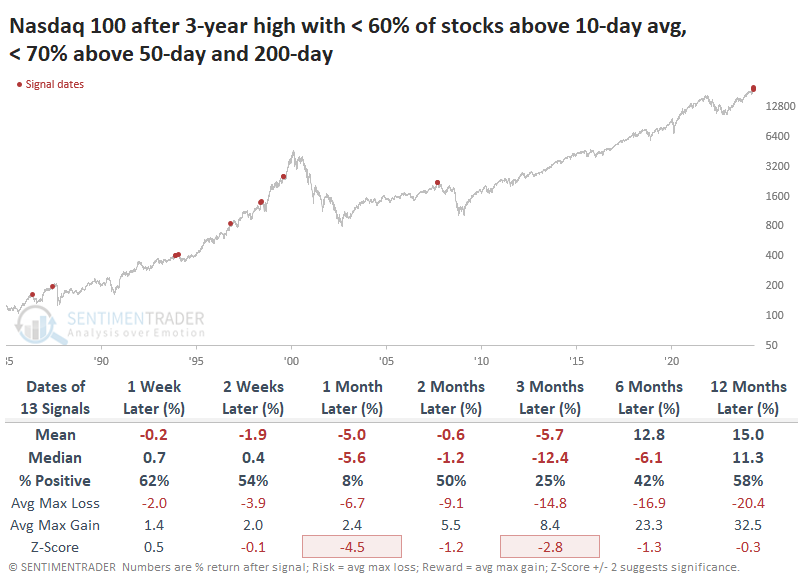
Even if we relax the parameters a bit and allow for more stocks trading above their 200-day moving average than we're seeing now, the sample size rises dramatically, but the results are still pretty horrid.
New lows trigger risk-off signal
The ratio between 52-week highs and lows on the NYSE exceeded -1.5 to 1, two sessions or fewer from a high. Dean showed that similar skews in highs versus lows preceded negative returns for the S&P 500 over the subsequent two months.
A model that monitors NYSE 52-week highs relative to lows exceeded a ratio of -1.5 to 1, with the S&P 500 two days or fewer from an annual high, triggering a risk-off signal from a member in the TCTM Composite Risk Warning Model.
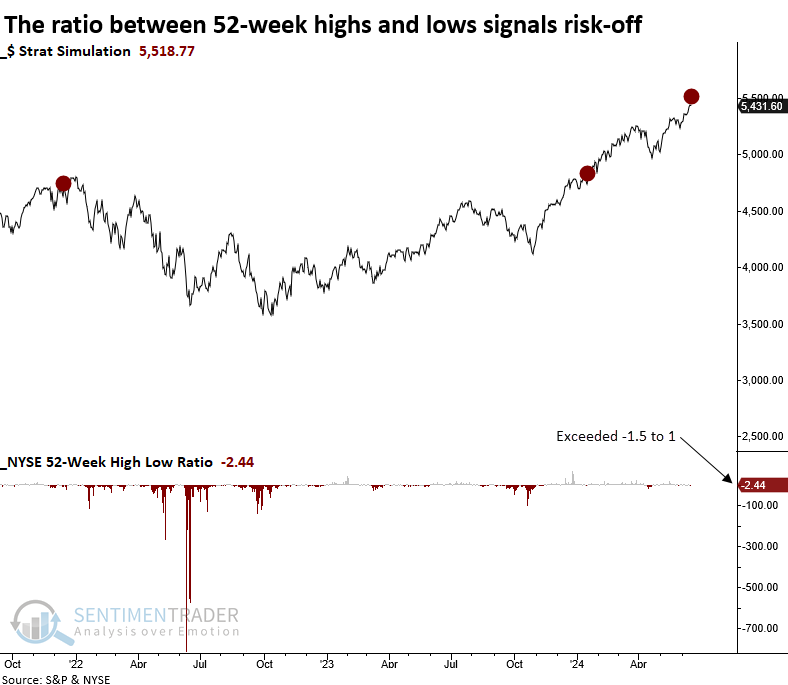
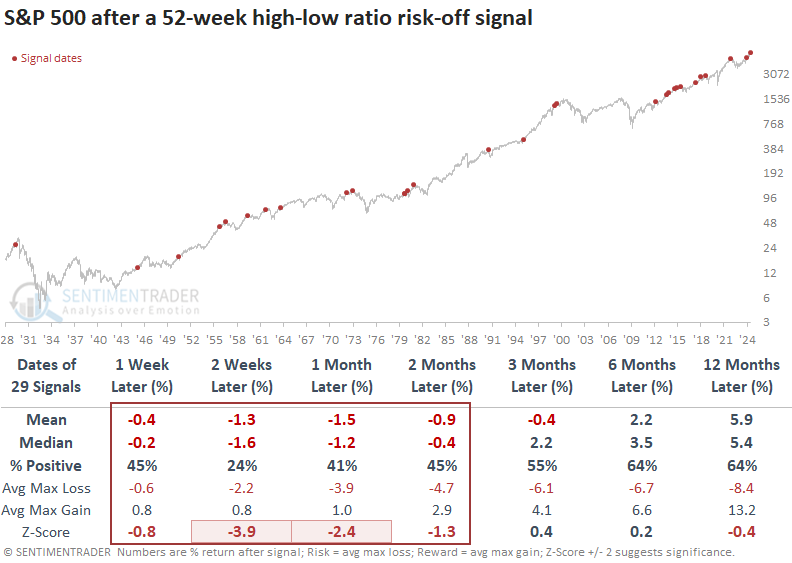
Should the NYSE 52-week high-to-low ratio exceed -1.5 to 1 in two days or fewer of the S&P 500 reaching an annual high, the world's most benchmarked index has historically shown negative returns and unfavorable win rates over the next two months. The first two weeks exhibited the highest risk, with the index declining 76% of the time.
The Composite Risk Warning Model requires a minimum composite signal count of 50% to activate an alert, a threshold that has yet to be achieved.
A quick flip in global uptrends
Dean also noted that global indexes saw medium-term uptrends decline sharply in just a few days, and similar breadth-based reversals suggest a global index could struggle over the next three months.
The participation problem has now spread globally, with the percentage of all country indexes trading above their respective 50-day average, cycling from above 70% to below 25% in only three sessions.
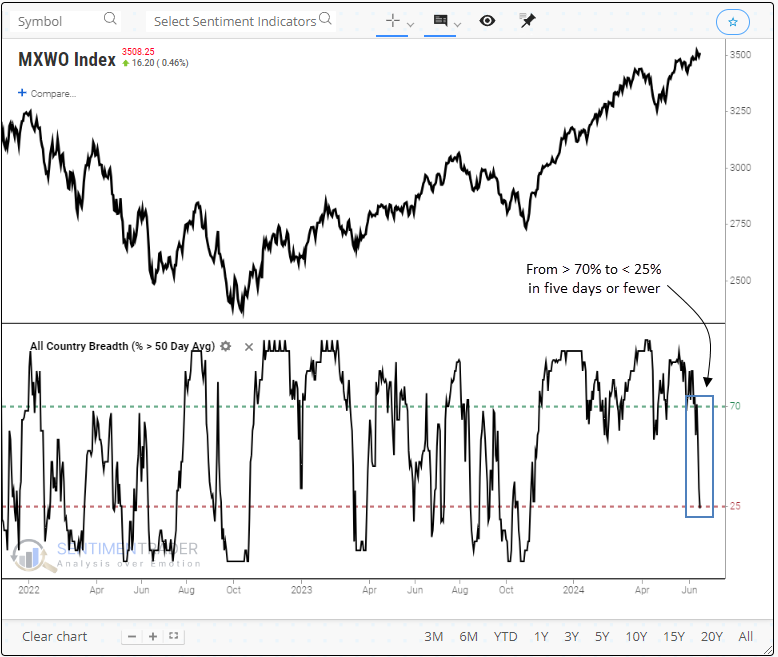
Whenever the percentage of country indexes above their 50-day average cycled from above 70% to under 25% in five days or fewer, the MSCI World Index struggled over the following three months. At some point over that same time frame, the global benchmark displayed a loss in 16 out of 19 instances.
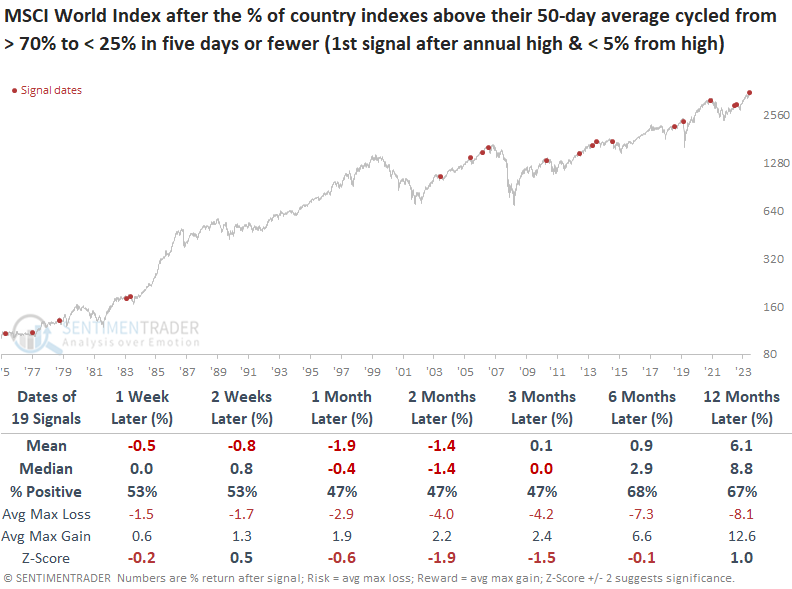
The World Minus U.S. index struggled even more after these signals, but even the S&P 500's returns and win rates tended to be lackluster in the following few months. This observation mirrors recent trends we've noted in domestic indexes.
Unemployment worries
By one measure, the trend in Unemployment will be up at the end of June. Jay showed that this has often been an early warning sign of impending recession.
An upturn in Unemployment is often a sign of impending recession. The chart below displays the monthly national unemployment rate and a 36-month simple moving average.
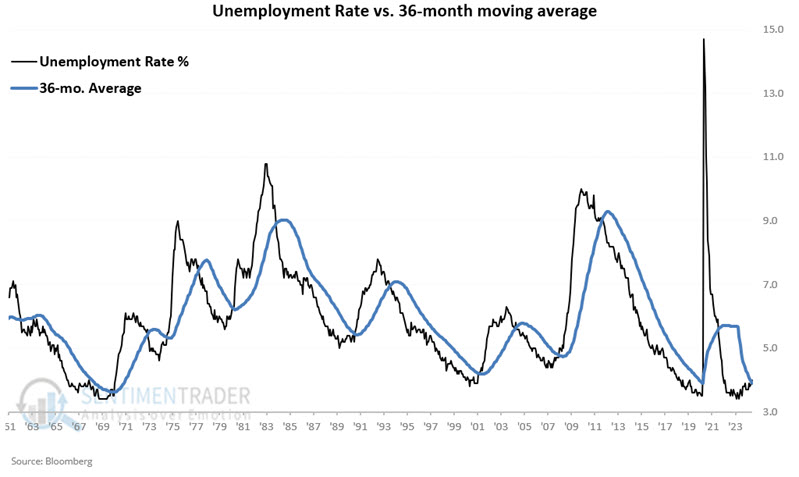
If the black line (unemployment rate) is above the blue line (36-month average), then Unemployment is in an uptrend. The latest reading closed back above the blue line, signaling that Unemployment will be in a rising trend at the end of June.
Jay measured economic performance using the monthly readings of the Coincident Economic Activity Index for the United States (CEI for short). It showed a drastic difference depending on the trend in the unemployment rate, which is not a good sign for economic activity in the months ahead.
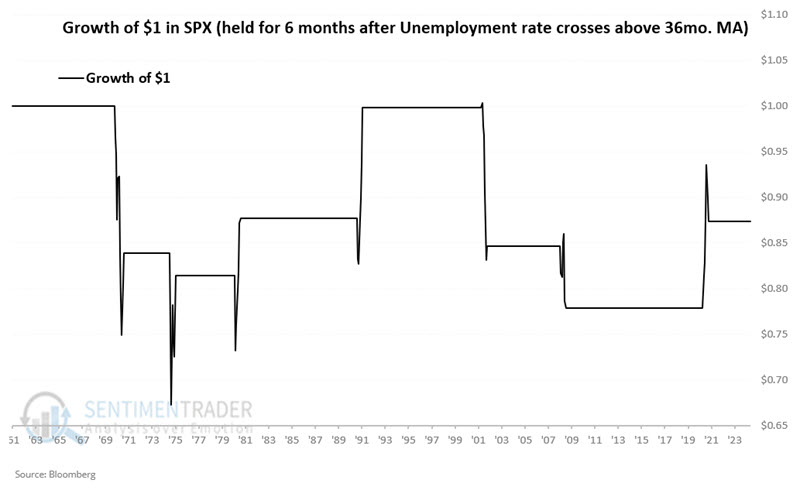
A more relevant question regarding unemployment trends is, "How does the stock market react when unemployment starts a new uptrend?"
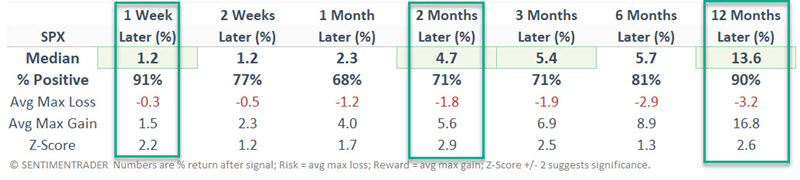
Using month-end closing prices, three and 6-month returns showed negative average and median returns, with Win Rates below 50%, drastically underperforming times when the unemployment rate was declining. To put it all into perspective, the chart below displays the growth of $1 invested in the S&P 500 for six months after the end of the month, during which the Unemployment Rate is recorded as crossing back above its 36-month moving average.
Long-term conditions remain favorable
Breadth and seasonality warnings continue to appear for stocks. Still, Jay noted several other signals suggest that long-term investors continue to avoid any urge to panic.
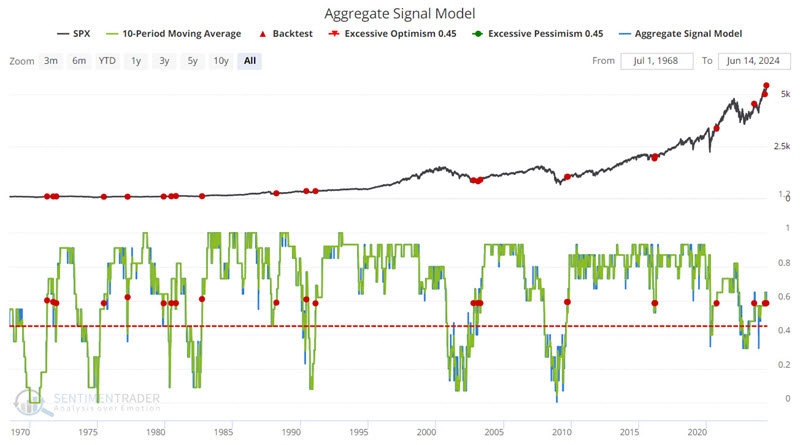
Our Aggregate Signal Model is an aggregate buy/sell signal based on all our buy/sell signals. In the simplest form of this model, the idea is to be 100% long when the model reading is > 45% (0.45), as shown in the chart below.
A variation involves using the model as a bullish "continuation" signal. The chart below highlights those dates when the 10-period moving average for our Aggregate Signal Model crossed above 0.58. The latest signal occurred on 2024-06-13.
Jay also showed that when the ratio of micro cap stocks to the S&P 500 falls to an exceptionally low level, it has preceded positive returns for stocks. It should be noted that this can be more of an "early alert" signal than an actual "buy" signal.
Insiders are getting more interested
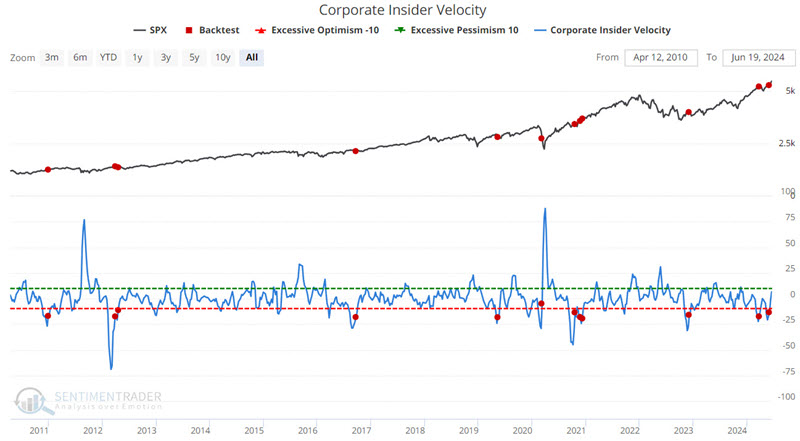
Our Corporate Insider Velocity indicator detects important "under the radar" shifts in corporate insider buying and selling. Jay noted several potential opportunities have recently surfaced in the S&P 500 and the industrial, healthcare, and consumer discretionary sectors.
The Corporate Insider Velocity indicator shows the velocity of corporate insider buying versus selling. It takes a 4-week rate of change for insider buys and subtracts a 4-week rate of change for insider sales.
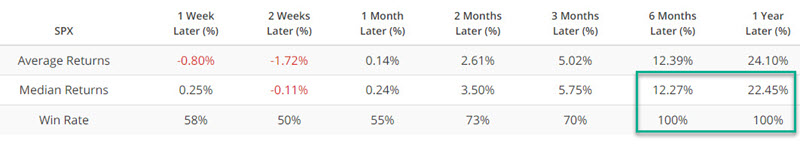
One thing to note is that there is no one best way to measure and use corporate insider velocity. The chart below highlights the dates when the Corporate Insider Velocity indicator crossed above -20. The S&P enjoyed a positive 6-12 month return after each signal.
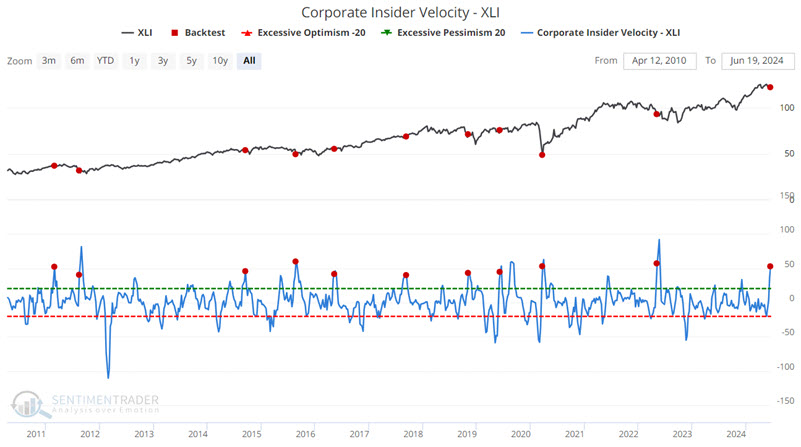
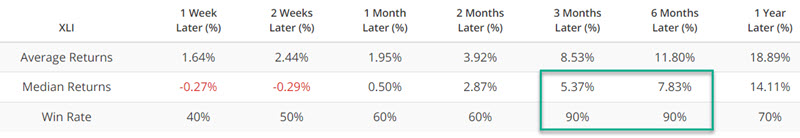
Now, let's focus on the industrial sector and a different approach to using insider velocity. The chart below highlights the dates when the Corporate Insider Velocity-XLI indicator crossed above 40 for the first time in three months.
Note that instead of looking for a reversal from a low level (which theoretically highlights a reversal from bearishness to bullishness among insiders), we are simply highlighting a burst in apparent bullishness among insiders.
Jay also looked at potential bullish implications from insiders in health care and discretionary stocks.
Historically calm new highs
The biggest factor in favor of riding the indexes is pure momentum. They keep rising because they keep rising; it's as simple as that. The S&P 500 has gone nearly a year and a half since it's even suffered a 2% daily decline.
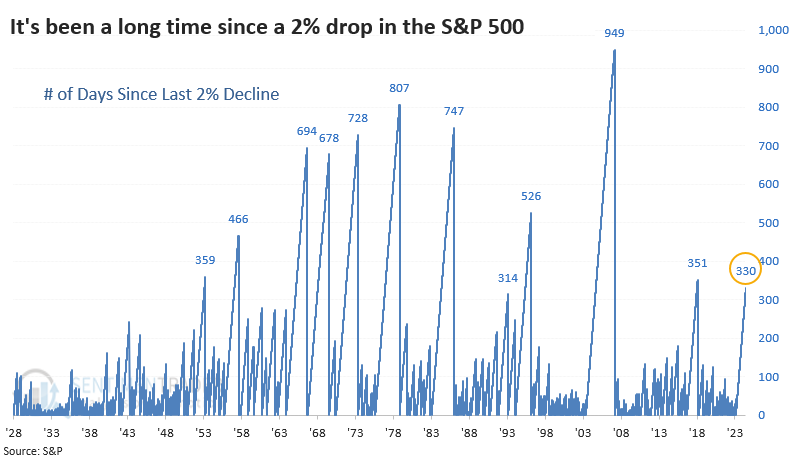
The chart shows that streaks without a big dip have gone on much, much longer-nearly three times as long in the mid-2000s. Still, by the time the streak reached this many days, the index started to sputter a bit. All but two of the streaks saw the S&P 500 trade lower either two or three months later.
Not only has volatility been subdued during the streak, but the S&P has managed to record 56 new highs as of last week. During any 330-day stretch, this is an impressive number, but again, it has been exceeded in the past.
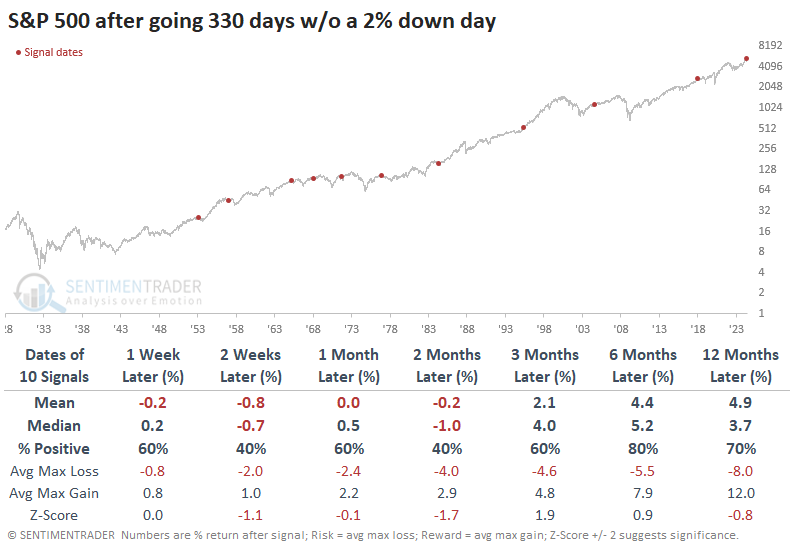
Now, let's combine both factors. There were a grand total of two instances when the S&P went 330 days without a 2% daily decline and recorded at least 50 new highs during that stretch.
Both signals preceded more gains over the next month or so and then fell into digestive periods. Neither one saw the S&P gain more than +9% at any point within the following year. In 1965, the S&P chopped around for a few weeks and then rallied hard for a few weeks into a more substantial peak.
Emerging opportunity
Emerging markets are entering their most favorable seasonal period of the year - and most favorable calendar month.
On a relative basis, performance has been disappointing. Since the October 2023 lows, EEM has gained over 17%, versus +33% for the S&P 500 Index.
Still, opportunity is where you find it, and EEM is entering a period of seasonal strength that extends from the close of trading day of the year (TDY) #119 through TDY #144. For 2024, this period extends from the close on 2024-06-21 through 2024-07-29.
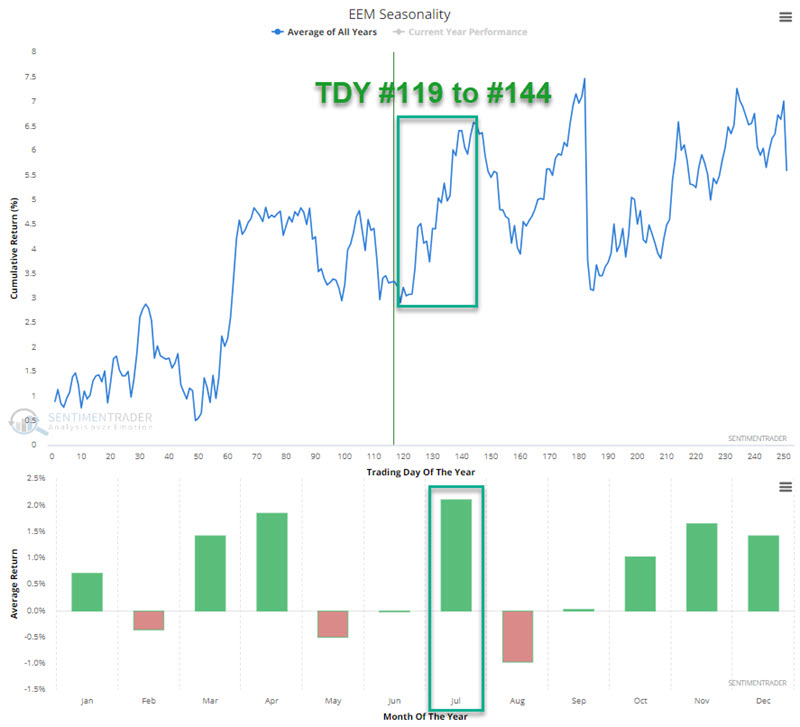
Note also in the chart above that historically, July has been the best calendar month for EEM. When combined with recent favorable price action, the seasonal tailwind may provide an edge for traders.
The chart below displays the hypothetical growth of $1 invested in ticker EEM only from TDY #119 through #144 each year since inception in 2004.
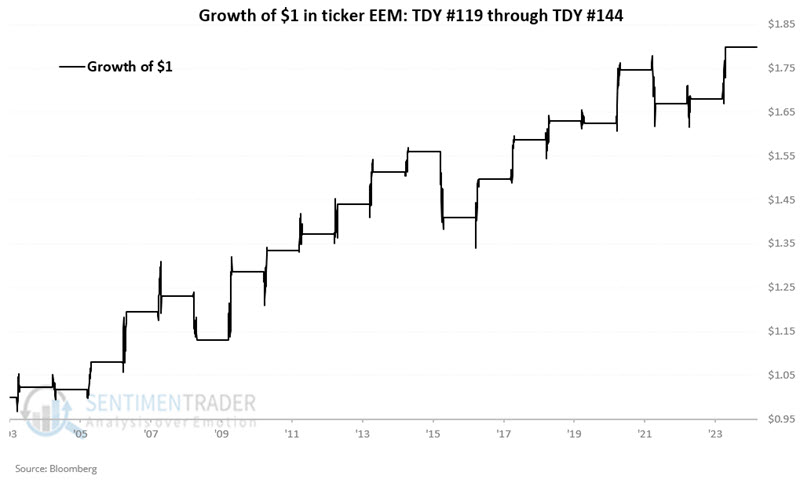
Historically, this period has seen EEM register a gain in three out of every four years. Also, 5% or more moves have skewed to the positive side by a factor of 8-to-2.
About TradingEdge Weekly...
The goal of TradingEdge Weekly is to summarize some of the research published to SentimenTrader over the past week. Sometimes there is a lot to digest, and this summary highlights the highest conviction or most compelling ideas we discussed. This is NOT the published research; rather, it pulls out some of the most relevant parts. It includes links to the published research for convenience, and if you don't subscribe to those products, it will present the options for access.