
TradingEdge Weekly for Jun 20 - Stocks vs bonds, risk-on behavior, AI stocks

Key points:
- More signs of risk-on behavior
- The relationship between stocks and bonds is stretched
- Options traders in SPY are coming back to calls
- AI stocks are showing impressive relative strength
- Semi stocks are triggering some trend following buy signals
- Energy stocks have jumped, improving sector breadth but insiders still aren't biting
- Corn is entering a seasonal soft spot
Another risk-on sign
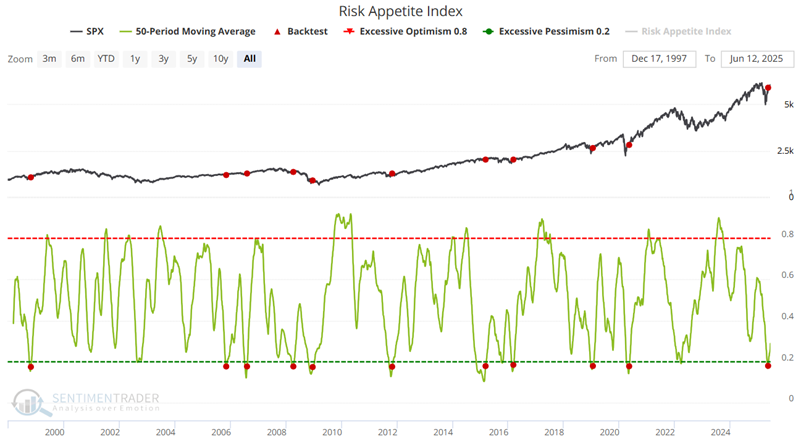
Our Risk Appetite Index and the relationship between high beta and high quality stocks recently flashed "risk on" signals.
Human nature never changes, especially regarding making and losing money. Jay noted that when the market falls, investors become more fearful and lose their risk appetite. This creates an opportunity for individuals who know what to look for.
The chart below highlights each date when the 50-day average of the Risk Appetite Index crossed above 0.175. A significant market sell-off typically plays out to push the 50-day average this low. However, instead of trying to pick the bottom, we simply wait for the 50-day average to reverse higher.
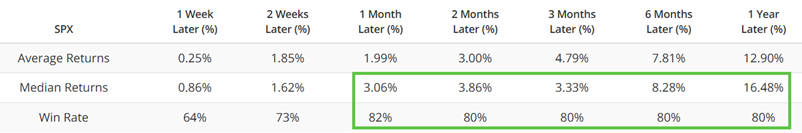
The S&P High Beta / S&P High Quality Relative Ratio Rank indicator shows where the ratio is relative to its range over the past four months. When the relative ratio is high, investors are showing risk-on behavior. When the ratio drops to a low level, they exhibit risk-off behavior.
The chart below highlights those dates when the indicator dropped below five and crossed above 75. The most recent signal occurred on 2025-06-09. For our test, we use a holding period of five months.
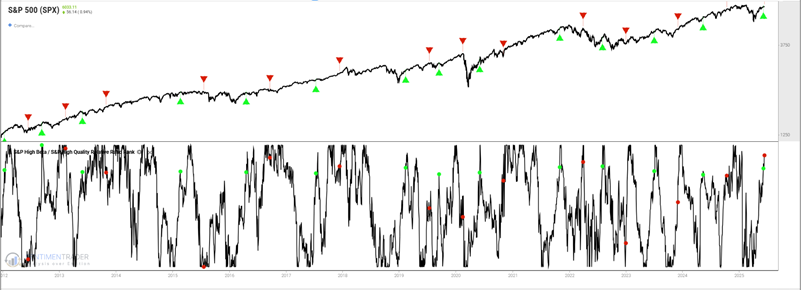
The chart below displays the hypothetical equity curve for the trades signaled in the chart above.
There was a 92% Win Rate for positions held for five months. The largest intra-trade decline was -12.57% in 2022, and the second largest was -9.26% in 2021, with the median drawdown being less than -4%.
Getting a bit stretched, though
Unlike most past instances of impressive momentum and risk-on behavior, there is now a major competing asset. And asset allocation is the most important factor for the average investor.
The Equity Risk Premium (ERP) subtracts the yield on 10-year Treasuries from the earnings yield on the S&P 500. The chart shown on the site is among its most extreme levels since 2000. The scale on the chart is inverted to better line up with overbought/oversold conditions in stocks.
Dating back to 1962, the annualized return in the S&P 500 at this level was only +5.5%, while on 10-year Treasury futures it was +1.2%. That is significantly worse for the S&P than under other ERP regimes, and markedly better for Treasuries.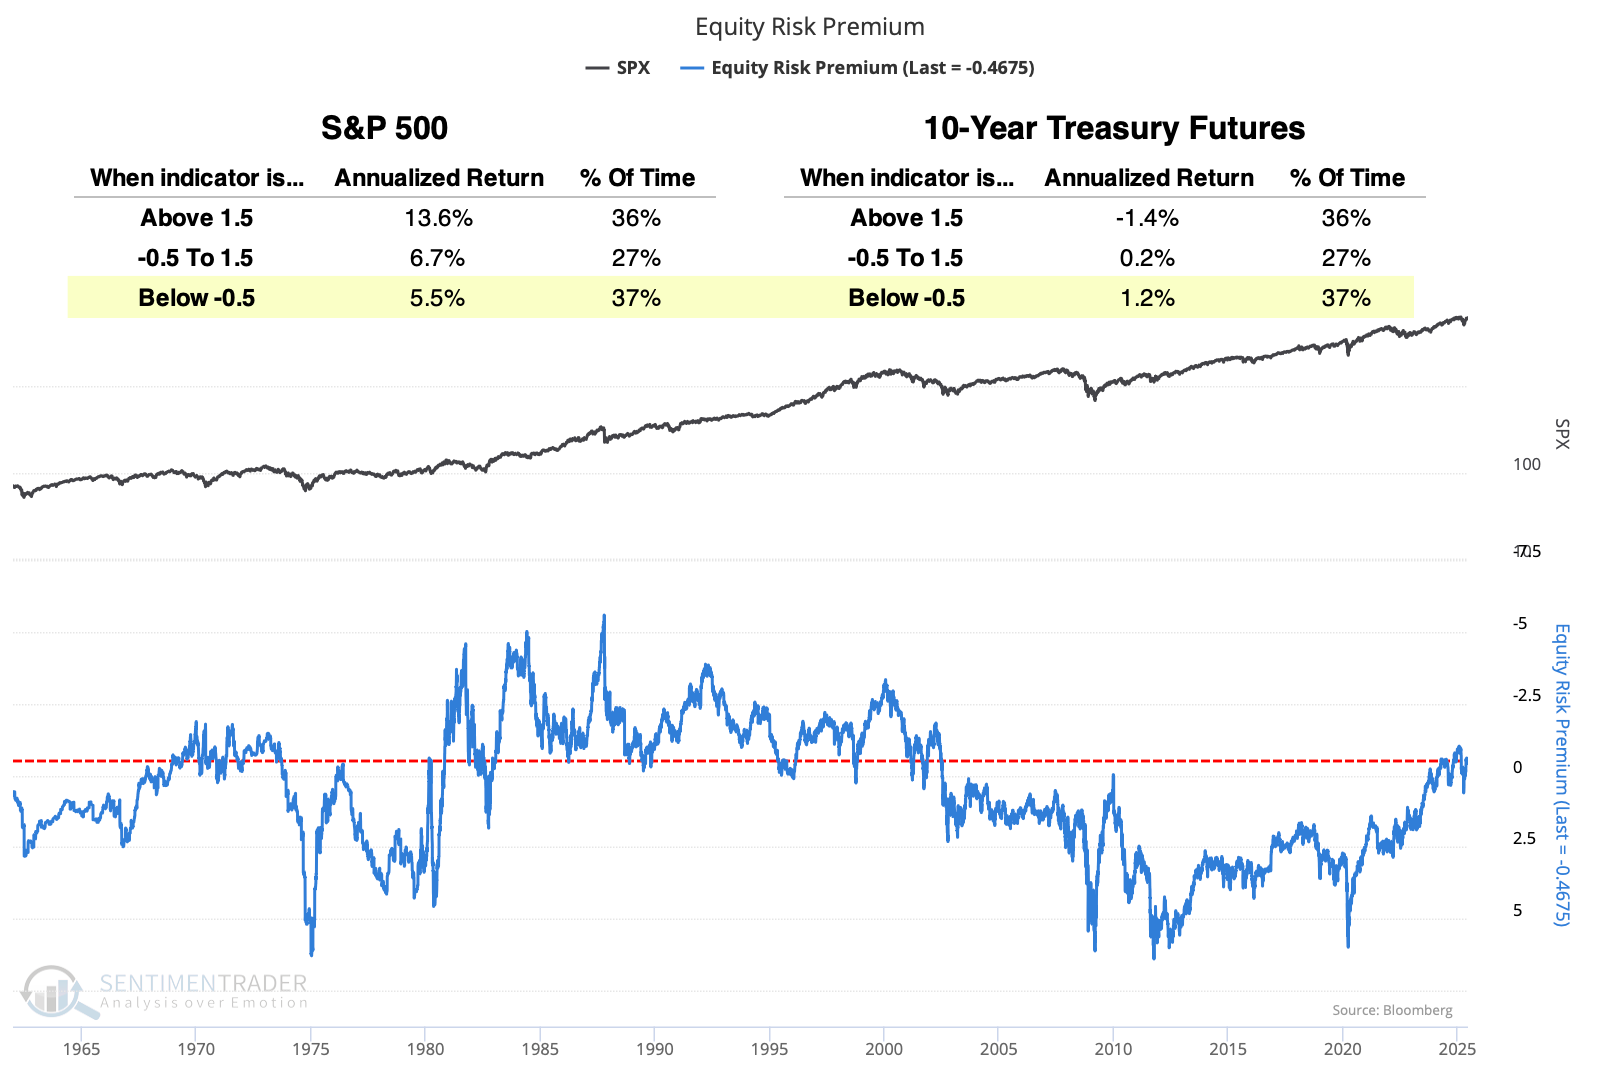
Not only is the ERP at an extreme, but on a shorter-term basis, the Stock/Bond Ratio has gotten out of whack, trading at the upper end of its typical range.
When we combine a negative ERP with an overvalued Stock/Bond Ratio, the return in the S&P 500 over the next three months was underwhelming. Its median return was negative, with more risk than reward. Even during the 1980s-90s, the S&P was negative about as often as positive over that time frame.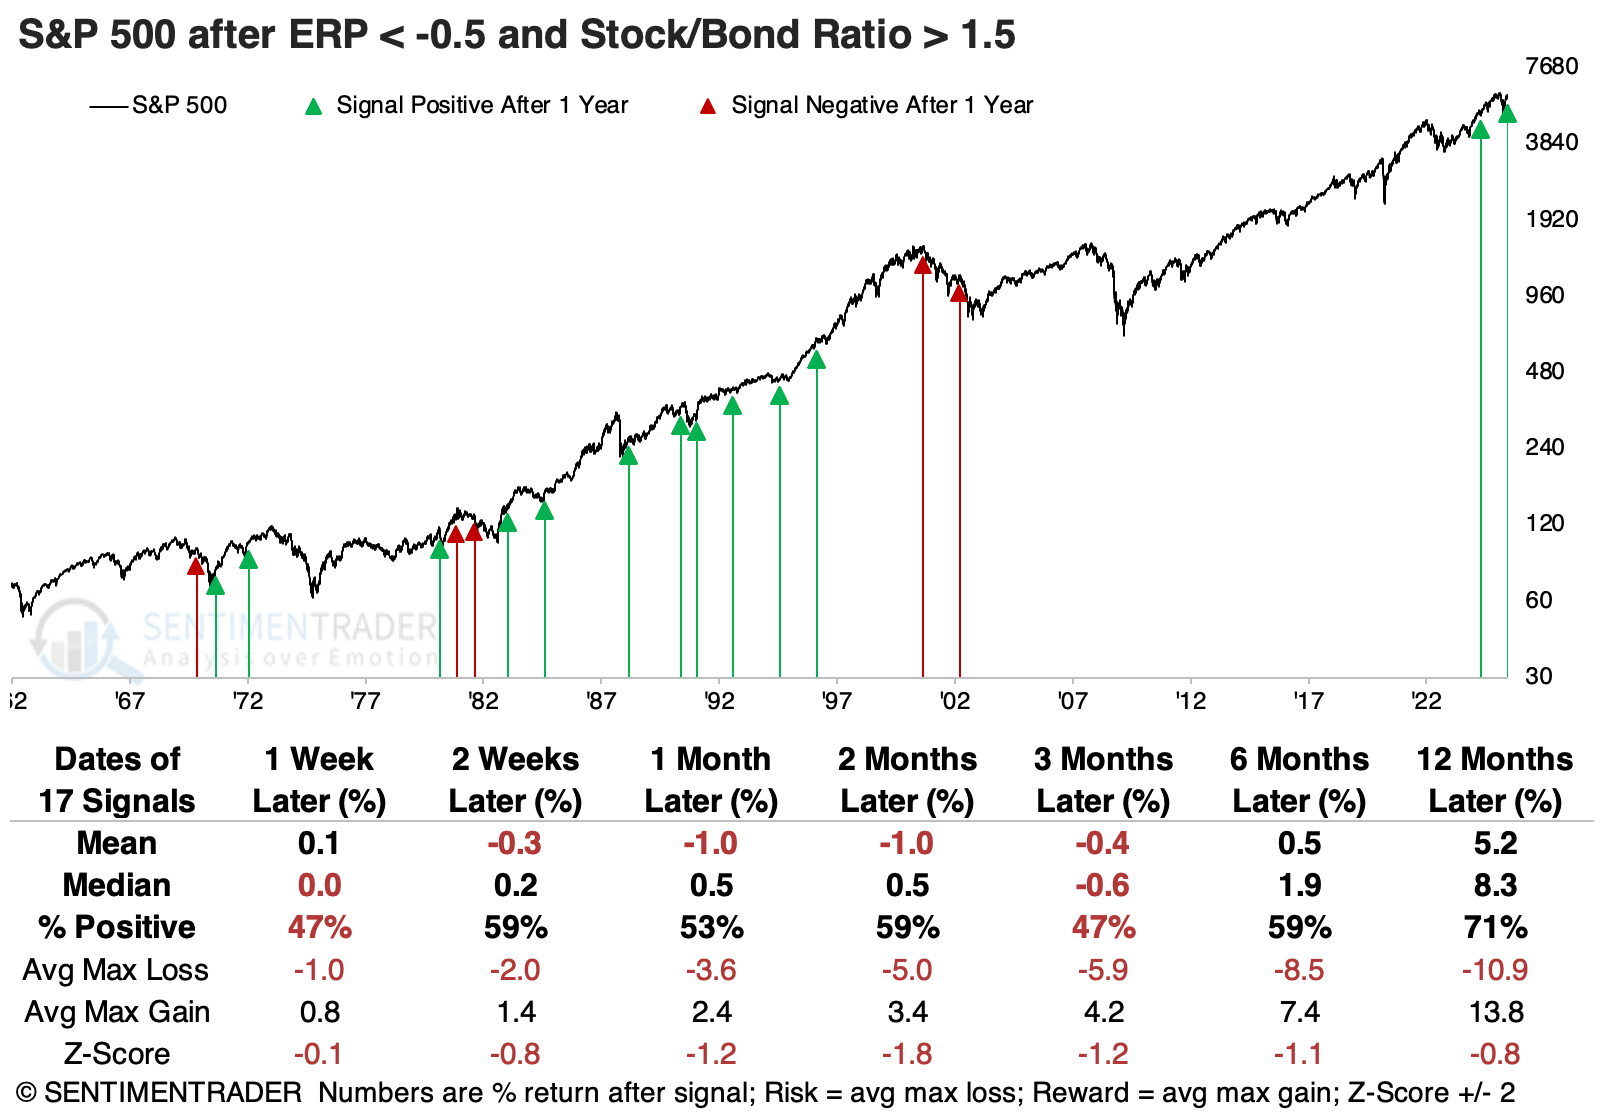
Bond futures suffered terribly before 1982, and their returns over the next month were poor. Beyond that, returns turned positive on average, though not compellingly so.
Stocks still tended to outperform bonds, but this was not a given. In fact, the three-month arithmetic average return for the ratio of the S&P 500 to 10-year Treasury futures was negative, thanks to a few heavy losses.
After these stock versus bond valuation extremes, the value factor showed the highest average one-year returns. Defensive stocks were the most consistent winners, with the highest probability of a positive return across time frames.
More interest in open interest
Jay showed that trading in SPY options recently reversed from an extreme, which historically has suggested higher prices going forward.
The SPY Open Interest Ratio shows the number of outstanding put options divided by the number of outstanding call options. The daily data can be spiky due to option expiration, so it's best to ignore extreme one-day moves and look at the trend over the past 10 or 20 days. When traders have been holding many more puts relative to calls in these ETFs, they have tended to struggle going forward. The market tended to rise when there were few puts relative to calls.
The chart below highlights all dates when this indicator's 20-day moving average crossed above 1.80, including overlapping signals.
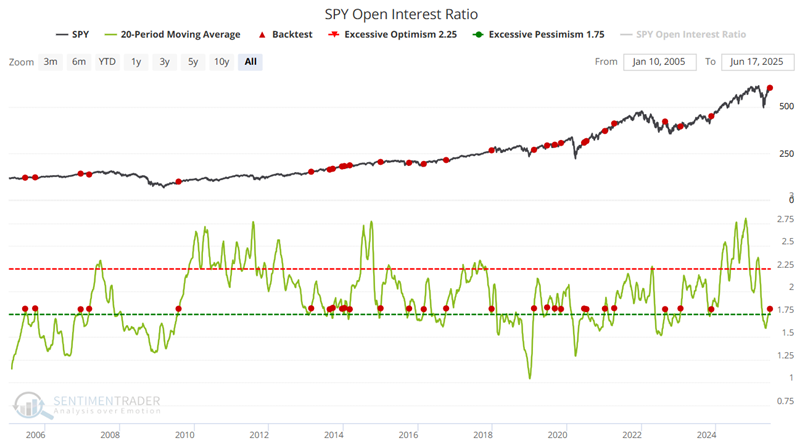
Given the consistently high Win Rates historically, the recent signal on 2025-06-16 places this indicator on the favorable side of the weight of the evidence ledger.
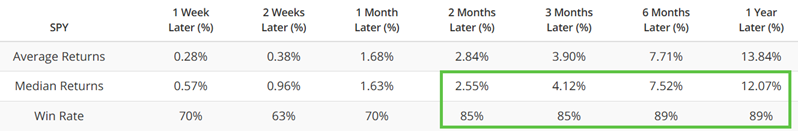
Jay then examined how to turn this signal into a systematic approach in Backtest Engine 2. It used the moving average to create a trade in SPY and hold for one year after these signals. The equity curve shows a clear up-and-to-the-right shape, suggesting an upside edge for the system.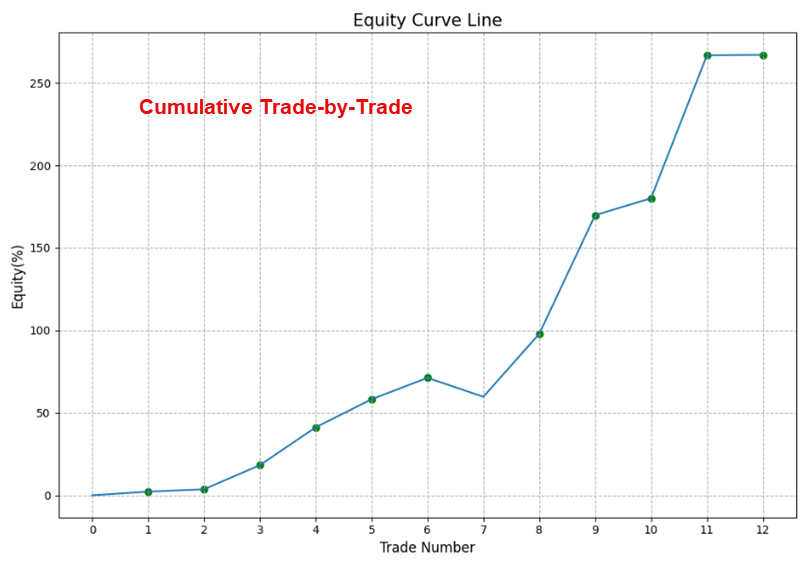
Relative strength in growth
Relative strength continues to lean toward risk-on areas, particularly growth-oriented groups. Dean showed that stocks within the artificial intelligence ecosystem are consistently yielding new opportunities.
As shown in the table below, relative strength timing systems, featured on the strategies page of the website, currently favor growth ETFs over value across large, mid-, and small-cap market capitalizations.
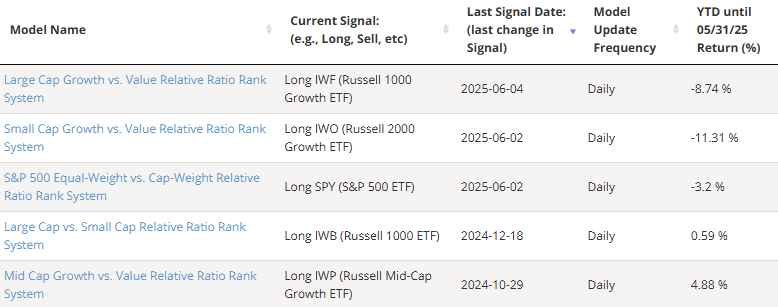
Drilling down into sectors, we find that offensive growth-focused areas, such as communication services, consumer discretionary, and technology, maintain relative strength buy signals. Industrials remain the only value/cyclical sector with a constructive setup.
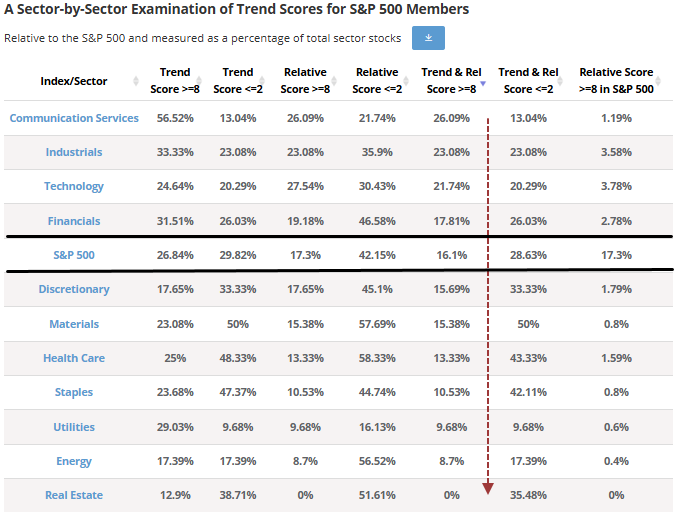
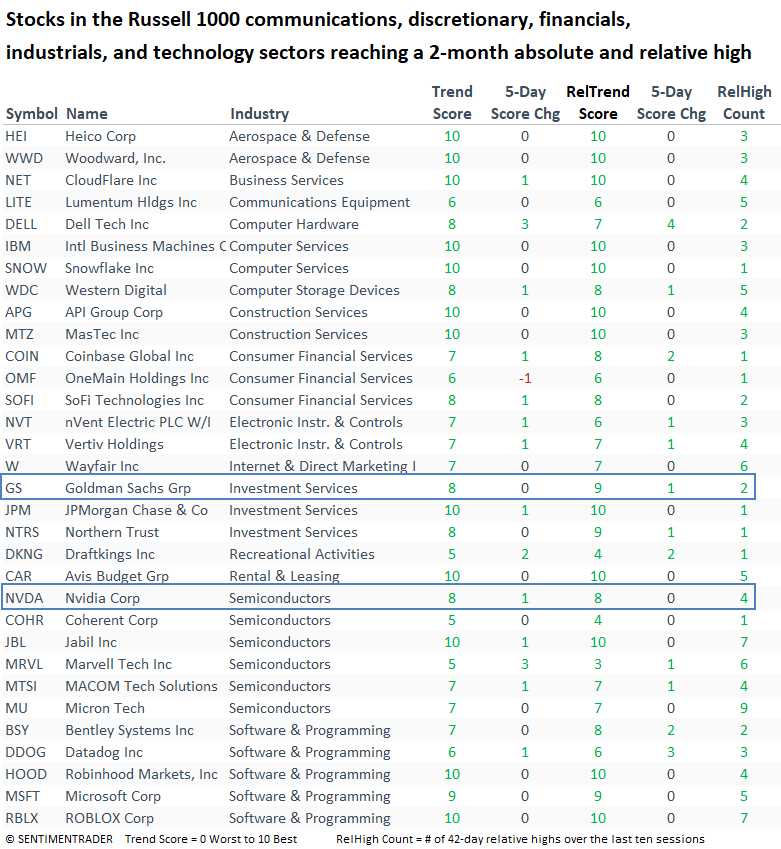
On the website's sector summary page, the highest concentration of stocks with trend and relative trend scores of eight or higher is found in the communications services, industrials, technology, and financial sectors, reinforcing the relative strength timing system's exposure to these groups. Furthermore, technology has shown notable improvement recently.
On Monday, a cyclical sector breakouts list revealed a clear and accelerating trend toward companies tied to AI infrastructure and data center expansion.
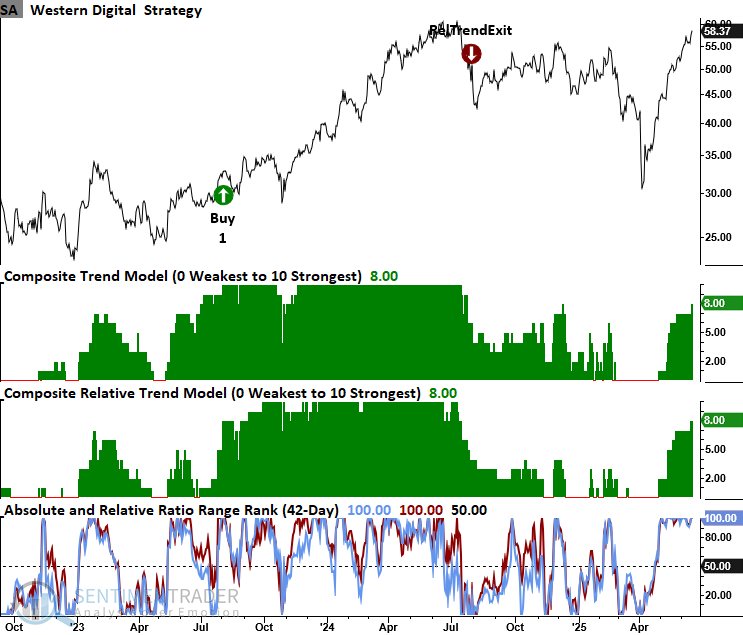
Western Digital (WDC), a key player in data storage solutions and a beneficiary of accelerating data center demand, is on the cusp of triggering a trend score buy signal. The potential addition of Western Digital underscores the growing momentum in the storage hardware sector as investments in cloud and AI infrastructure expand.
Eaton Corp (ETN), which supplies power solutions for data center cooling and backup, has traded sideways for a year. An alert could be triggered if trend scores improve by one more point and the stock reaches a 2-month high in both absolute and relative terms. There is a similar setup in Vertiv Holdings (VRT), a competitor to Eaton.
Previously, Dean highlighted several stocks in the housing industry that displayed unfavorable trend conditions, suggesting this was an area investors should avoid. Lowe's, a bellwether in the home improvement retail sector, holds a trend and relative trend score of zero as it sinks to multi-month absolute and relative lows.
Semis are trucking
Nvidia (NVDA), the world's largest semiconductor company, triggered a trend score buy signal. Dean noted that not only semis, but also some investment banks like Goldman Sachs (GS) have triggered trend score buys.
Earlier, Dean highlighted a resurgence in favorable absolute and relative trends among stocks within the AI ecosystem, signaling renewed leadership in this critical growth theme. This positive momentum has now gained further validation as Nvidia, the bellwether for AI, has triggered a trend score buy signal.
Given Nvidia's outsized influence on the group, this confirmation adds significant weight to the view that AI-related stocks are reasserting themselves as market leaders.
Nvidia generated a trend score signal on Wednesday when it registered a 42-day absolute and relative high as both its trend and relative trend scores maintained a level of eight or higher.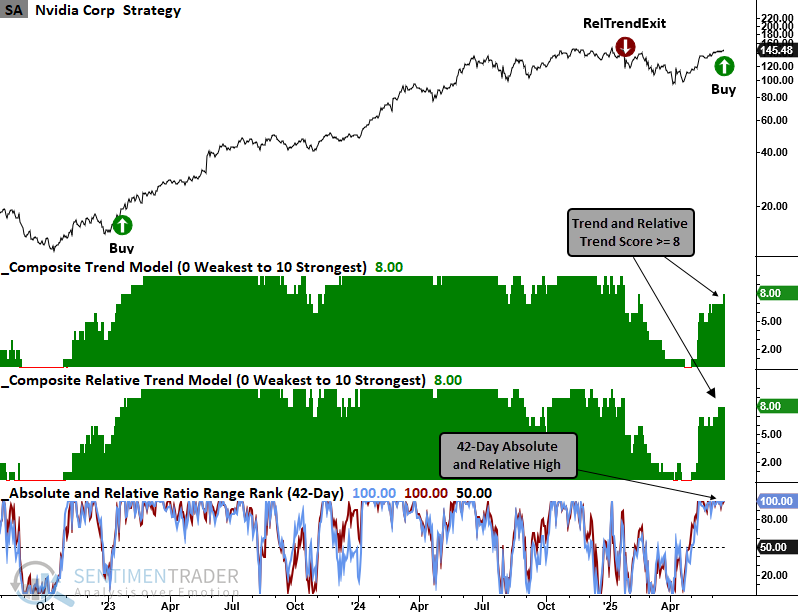
The following table shows that the technology sector has the highest proportion of stocks with a rank of 80% or higher across most horizons.
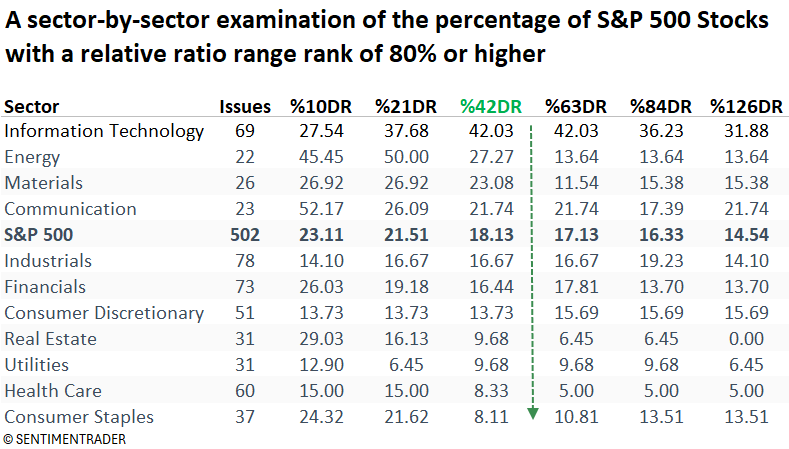
The programming team constructed a time series for these indicators using 10, 42, and 126-day horizons to capture short-, medium-, and long-term relative strength trends for stocks within each sector. The following chart contains the percentage of S&P 500 Technology sector stocks with a 42-day relative strength range rank of 80% or higher.
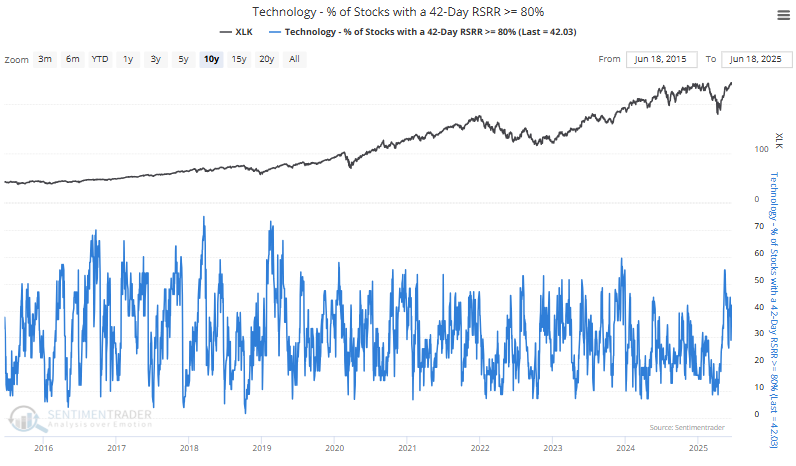
Momentum investors can apply these new indicators in two key ways. First, watch for a strong surge that may signal the beginning of a fresh leg of relative outperformance. Second, evaluate how a sector stacks up against others, aiming to overweight those with the highest percentage of stocks exceeding the 80% threshold.
Energy surge
Given geopolitics and a general increase in interest in commodities, traders have streamed back to energy contracts, and by extension, energy stocks have enjoyed a reflexive bounce.
Over a 10-day span, there were twice as many advancing stocks as declining stocks among those in the XLE fund. That's a stark change from when the opposite condition existed a few weeks ago.The Backtest Engine 2.0 shows that the fund continued to rise about three-quarters of the time over the next couple of weeks, but many of those failed.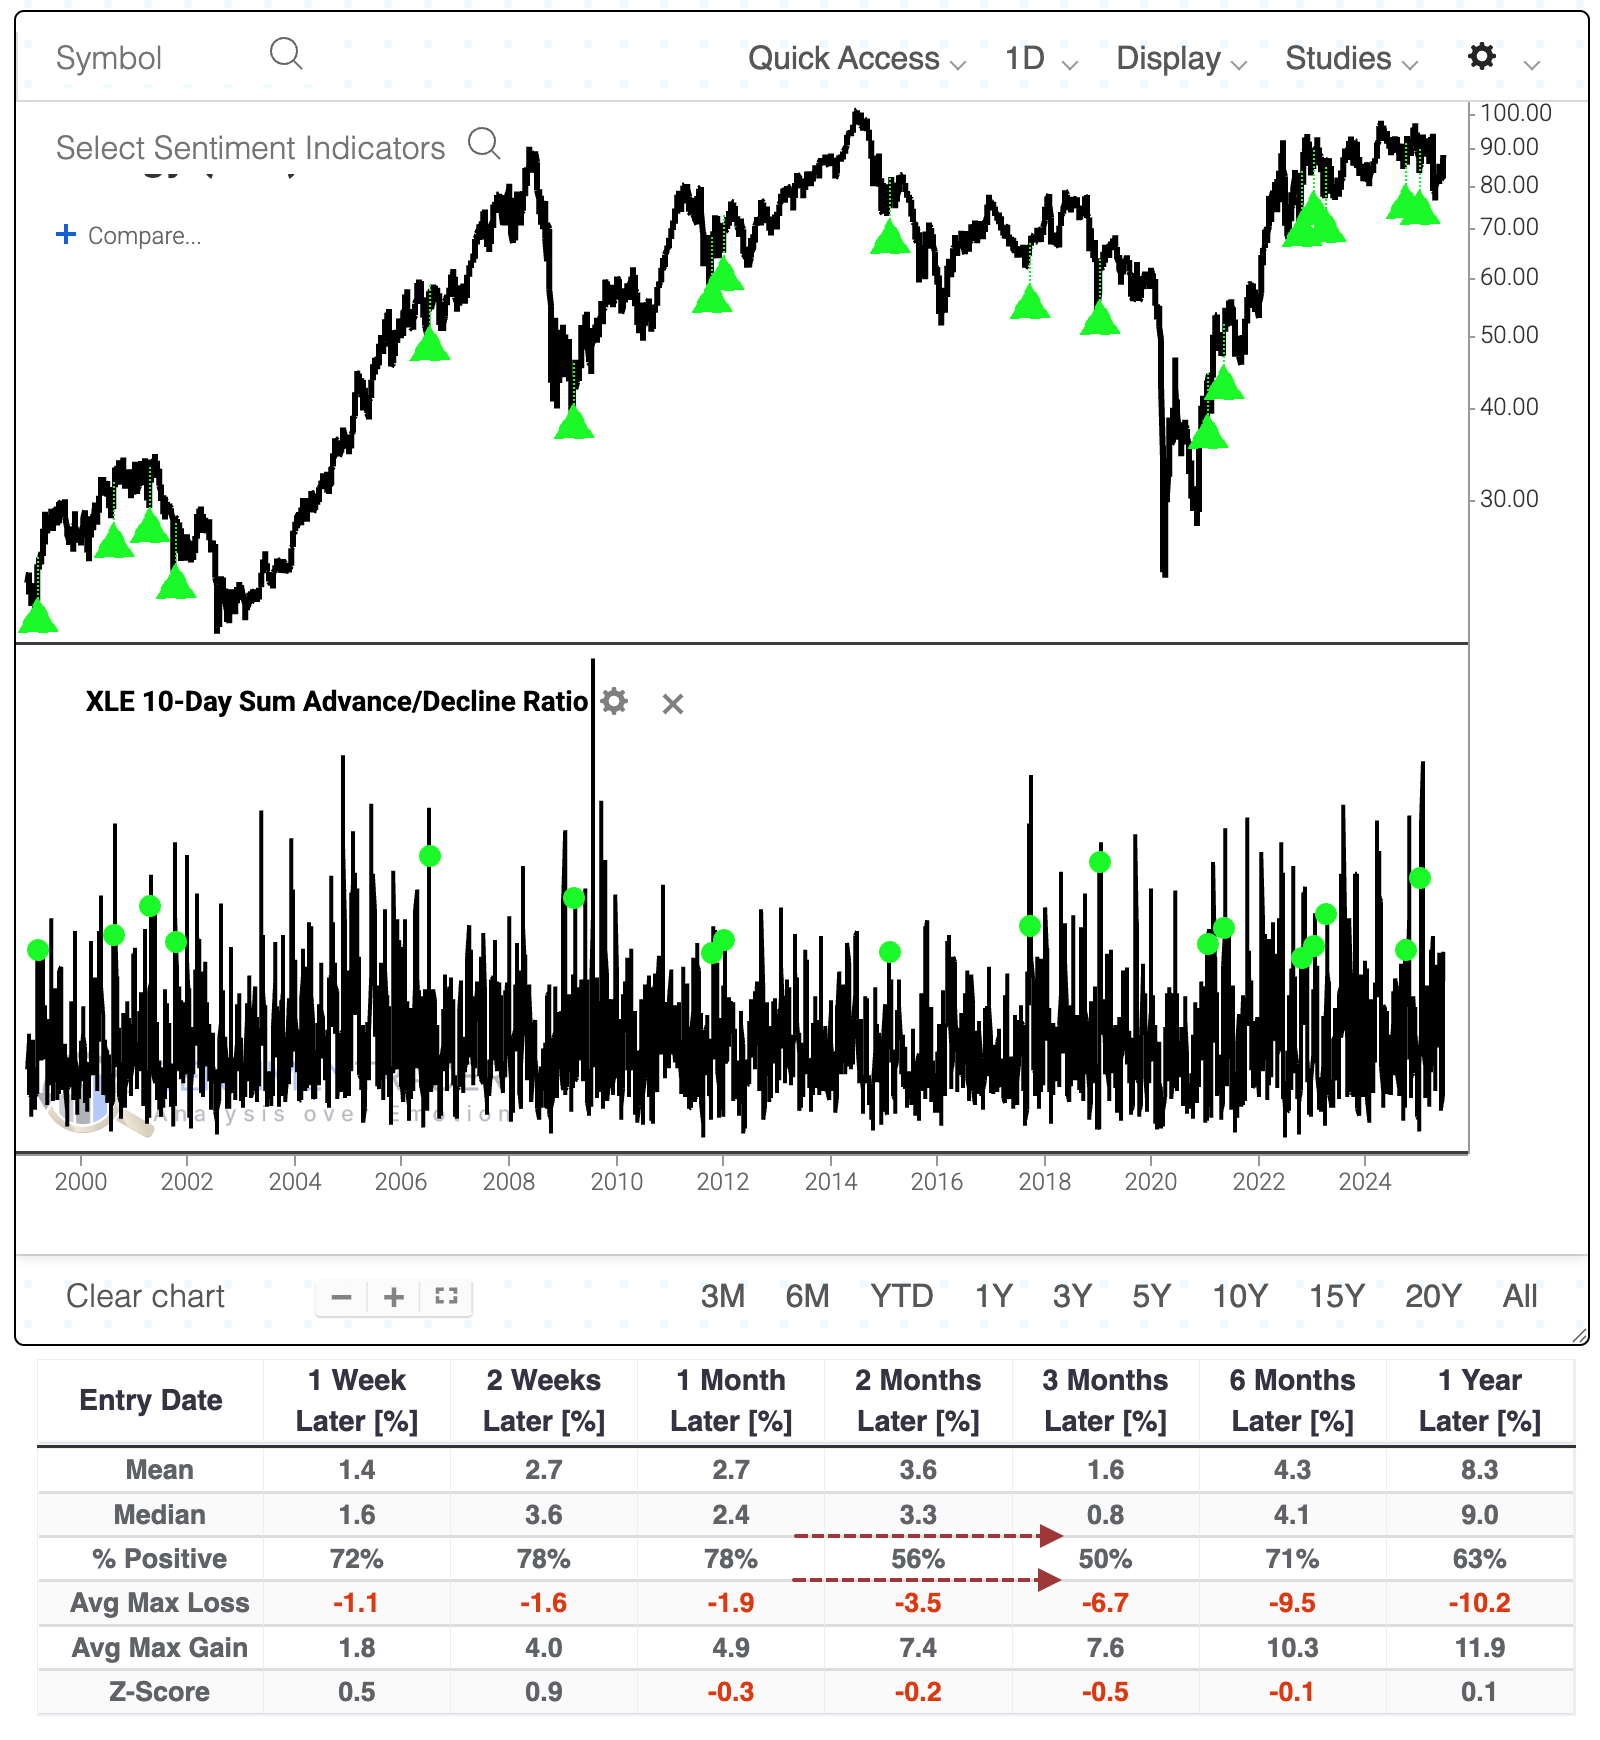
The rally pushed many more stocks above their 50-day Moving Average. After fewer than 5% were trading above their medium-term averages in April, now more than 95% have climbed above. The fund struggled to add to its gains after similar moves.
The gains have been enough to push more than 45% of stocks in XLE above their 200-day Moving Average. This is the first time in months that at least 45% of stocks climbed above their average, and again after similar moves, XLE had trouble adding to gains.
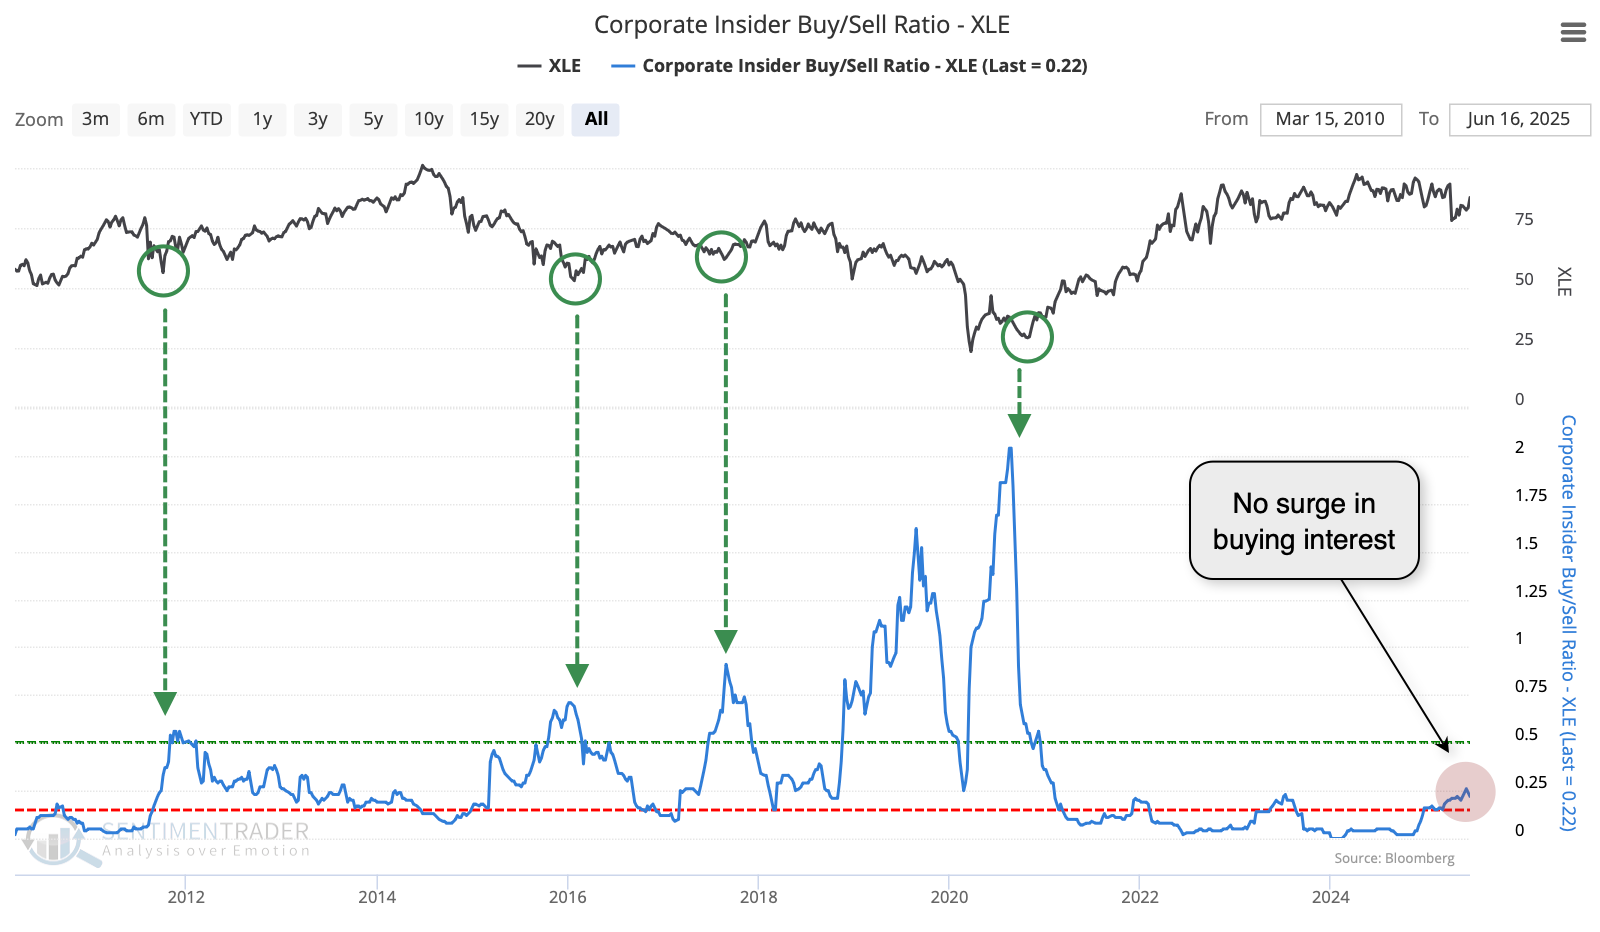
Furthering some concerns, corporate insiders among energy companies don't seem eager to snap up shares. The Insider Buy/Sell Ratio is creeping up, but only out of a depressed zone. Major lows in XLE over the past 14 years were preceded by a Buy/Sell Ratio above 0.5, while right now it is only half that.
Seasonally, XLE has tended to suffer through a poor seasonal window during the summer months. Its weakest time of the year has been from June through September. XLE's performance was egregiously bad relative to the broader S&P 500 index during this time of year.
There are some positives, such as a recent spike in put activity in energy stocks, and a significant jump in correlation among stocks, showing panic among investors. And trend scores among energy shares are picking up, and just turning positive.
The sector does not have a good track record of following through on moves like it's seen in recent weeks. Typically, the failures happened right away. If bulls continued to bid up the sector, then XLE had a better track record of sustaining its gains longer-term. Bulls should be watching the coming week(s) closely.
Corn concerns
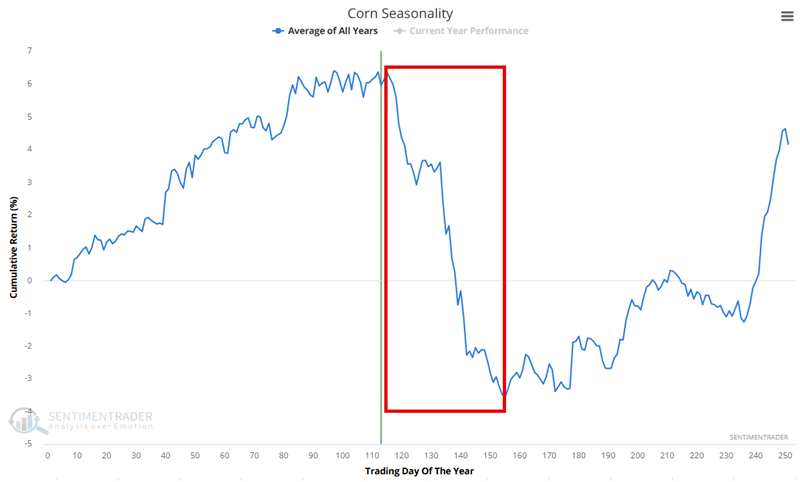
Corn prices declined roughly 50% from April 2022 then rallied almost 40% into February 2025, but have been trending lower ever since. Jay noted that this price weakness, combined with the impending weakest seasonal period of the year, suggests trouble.
As always, an annual seasonal chart is simply an average of what has happened in the past and is NOT a roadmap to what will happen this time. That said, note in the annual seasonal chart below that corn futures are entering a period of seasonal weakness that extends from the close of trading day of the year (TDY) #115 through TDY #155. For 2025, this period extends from the close on 2025-06-17 through 2025-08-14.
Each one whole point of movement in the price of corn futures is worth $50. The chart below displays the hypothetical cumulative $ +(-) achieved by holding a long position in corn futures during the TDY #115 through #155 period since 1976.
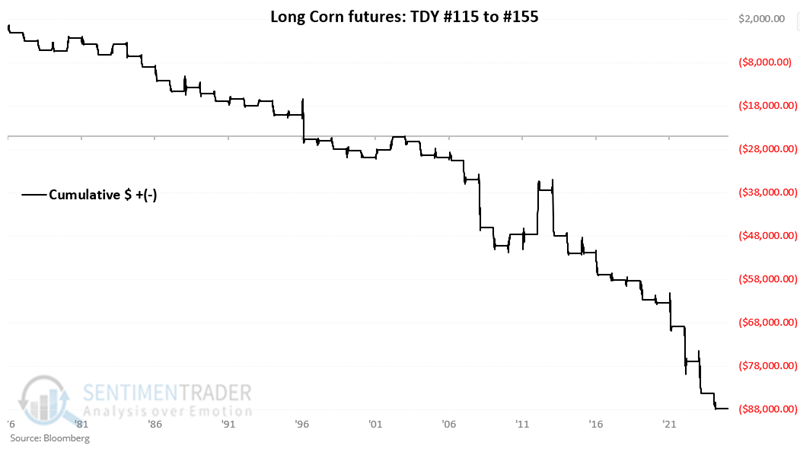 A 25% Win Rate tells us that corn has declined three out of every four years during this period. Probably the key thing to note is that there have been 15 declines of $3,000 or more during this period, but 1 one gain of $3,000 or more.
About TradingEdge Weekly...
The goal of TradingEdge Weekly is to summarize some of the research published to SentimenTrader over the past week. Sometimes there is a lot to digest, and this summary highlights the highest conviction or most compelling ideas we discussed. This is NOT the published research; rather, it pulls out some of the most relevant parts. It includes links to the published research for convenience, and if you don't subscribe to those products, it will present the options for access.