
TradingEdge Weekly for Jun 2 - Positive long-term trends, cap-weight dominance, hard to beat the S&P 500

Key points:
- A long-term trend model turned positive for the S&P 500 but with some caveats
- The average stock in the S&P 500 has plunged relative to the capitalization-weighted version of the index
- Investors don't seem to be buying into the latest rally
- Buying climaxes in big tech stocks are rising from a historically low level
- Stocks are still in a very long-term positive seasonal window
- Every European country ETF is underperforming the S&P 500
- Multi-month lows are rising among Discretionary stocks
- Corn has entered a seasonal no-go zone
Long-term trends turn positive for the world's most benchmarked index, but...
Dean noted that the Long-Term Trend Model shifted to a positive status. Similar trend change signals preceded excellent results for the S&P 500 across all time frames. One worry is that a few Composite Risk Warning Model components triggered new alerts around the same time.
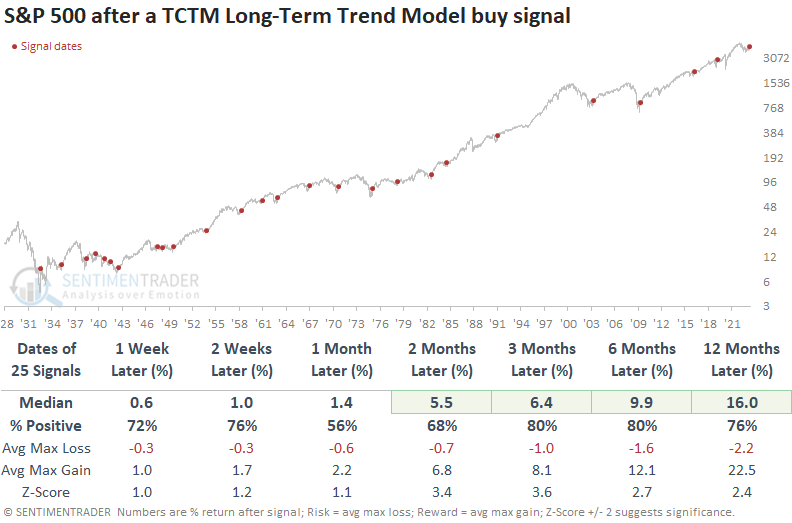
The Long-Term Trend Model, one of seven components in the broader Tactical Composite Trend Model (TCTM), reversed from bearish to bullish for the 26th time since 1932. The model combines price momentum ranging from two to twelve months with the slope of the 180-day moving average to measure the trend for the S&P 500.
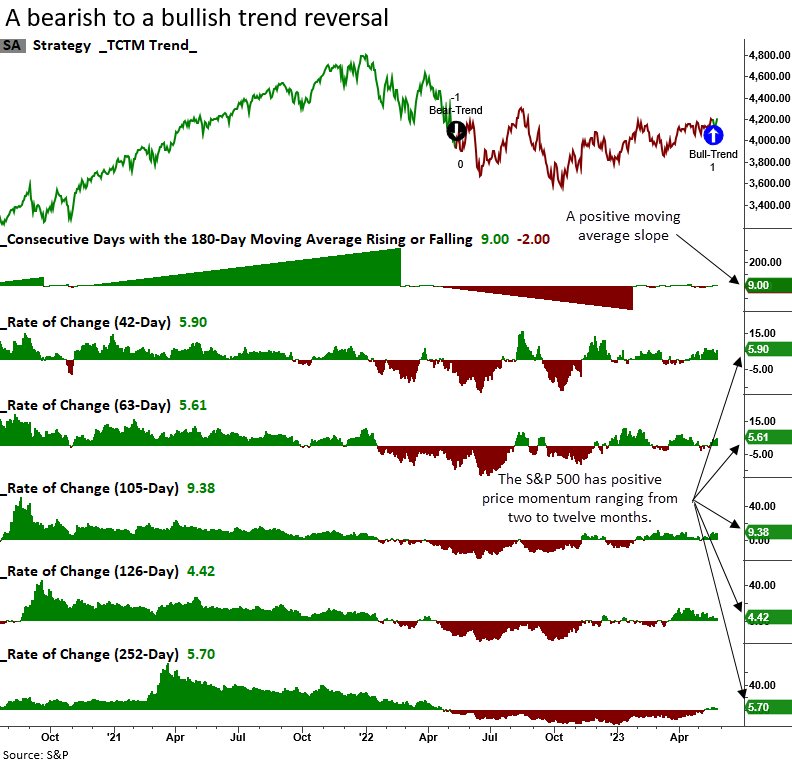
When the Long-Term Trend Model reverses to a bullish status, the S&P 500 tends to rise consistently over the next twelve months. Since 1948, the model has shown a gain in the three and six-month time horizons for 17 consecutive signals.
While this has clearly been a positive development, a worry is that some TCTM Composite Risk Warning Model components triggered a few risk-off signals. One of the Risk Warning Model components identifies when the S&P 500 Financial sector registers a significant number of 1-year relative lows versus the S&P 500. Historically, when financials are out of gear, the broad market struggles.
Abysmal performance by the Financials sector tends to bode poorly for the overall market. Typically, alerts occur before major bear market peaks. Also, NYSE 52-week lows as a percentage of highs and lows increased as the number of common stocks trading above their respective 200-day moving average fell below 50%, triggering a risk-off warning. The S&P 500 tends to struggle when news lows outnumber new highs, and long-term participation trends for NYSE common stocks are weak like now.
The average stock has (relatively) plunged
So far in 2023, the S&P 500 index that everyone watches is showing a respectable gain. The equal-weighted version of the index, which weights each of the 500+ stocks equally, is struggling to hold any year-to-date gains at all.
The indexes were tracking closely until the last few months. Since then, the surge in Tech stocks pushed the ratio between the two versions of the index out of whack. The 3-month rate of change in the ratio of the equal-weight to cap-weight versions plunged 8%, among the worst declines since the 1990 inception of the equal-weight index.
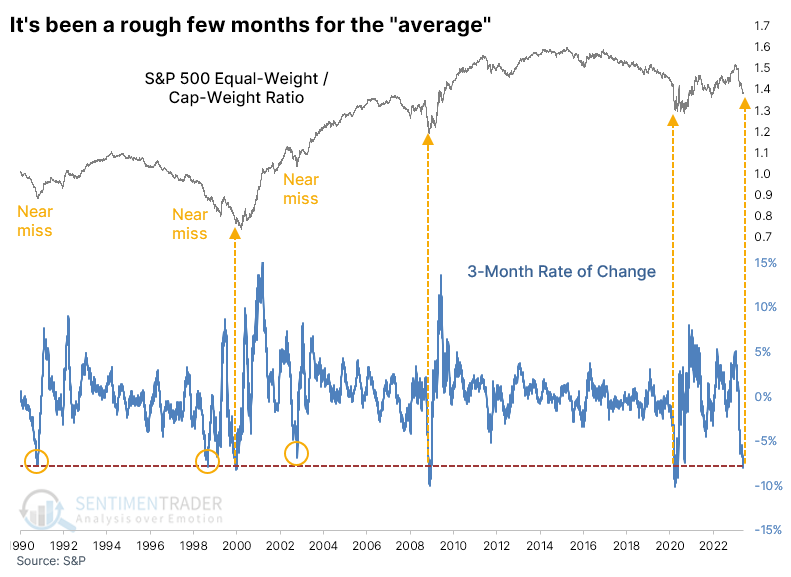
A few times, the decline didn't quite reach the -8% threshold. Two coincided with an imminent turn in the ratio, with the equal-weight version outperforming the cap-weight version for a couple of years afterward.
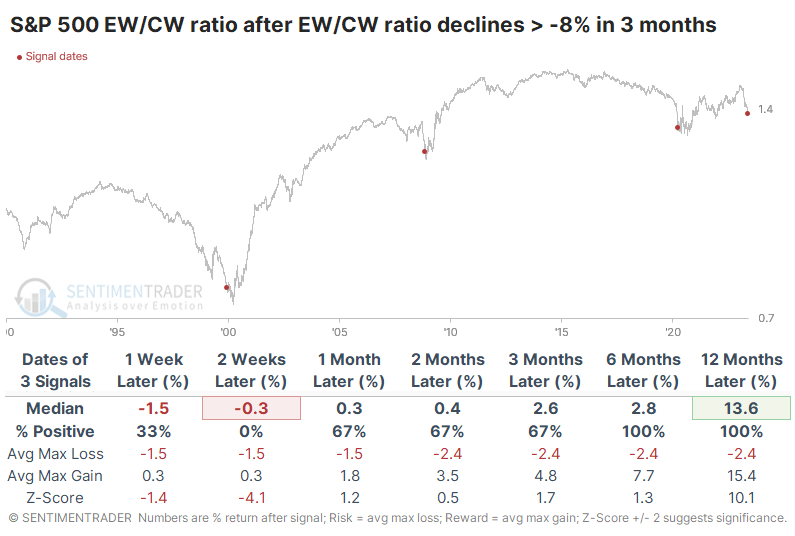
Returns in the cap-weight version (the standard one that everyone watches) after the few times the ratio declined at least 8% over three months preceded mediocre returns over the next few months, and one was at the low during the pandemic. The equal-weight version of the index performed better after these signals.
Because the equal-weight returns were mostly better than the cap-weight returns, the ratio between the indexes mostly showed gains after the first couple of weeks. Over the following year, the equal-weight version of the S&P 500 outperformed by more than 10% after each signal.
There are other ways to view the performance of the two indexes. One preferred way we look at data similar to this is cycles, like seeing what happens when the ratio cycles from a 1-year high to 1-year low. This triggered in late April, and the ratio has continued lower, which isn't unusual. There wasn't a strong bias in the returns, though there was a modest tendency to see the equal-weight version of the index resume its leadership after similar cycles.
Investors don't seem to be doing what they usually do
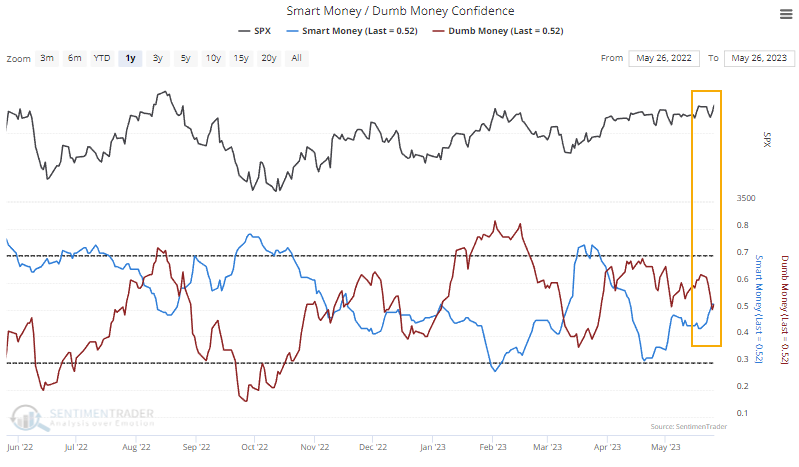
Even though the S&P 500 has ripped higher over nearly two weeks, investors don't seem to be buying it. In an unusual twist, Smart Money Confidence rose while Dumb Money Confidence declined.
Typically, Smart Money fades a trend. That's not very "smart," but that's not the point - these traders are typically the most confident in a rally after a prolonged decline, and stocks often soon trough. Dumb Money mainly reflects trend followers, and it's correct during the meat of a move. But they're also the most confident just as stocks tend to peak.
Even though stocks have rallied for nearly two weeks, these models have gone in the opposite direction of what they would typically do.
To see if the recent oddity between market performance and Smart/Dumb Confidence has meant anything consistent in the past, the table below shows the S&P's returns after similar behavior. These are times when the index rallied heartily over a nearly two-week stretch, yet Smart Money Confidence improved at the same time Dumb Money Confidence declined.
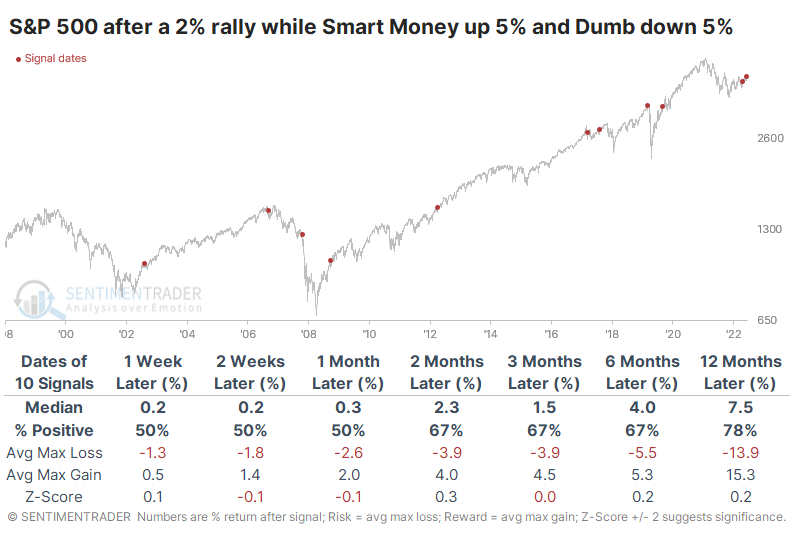
There doesn't seem to be a super compelling conclusion from similar instances. Returns up to a month later were a crapshoot, and while they improved after that, they were still about in line with random. While the S&P rose across most time frames, then exceptions were prominent. The index showed modest gains from two months and beyond, but the few times it showed losses, they were significant.
It's tough to make dramatic pronouncements from such a small sample, but it suggests that if the index is going to continue higher, we could expect modest gains at best over the next few months. But if it doesn't, the precedents aren't great, with double-digit drawdowns. There was a slight suggestion that if stocks rose over the next two weeks, they would also be higher six months later, but again the sample is too small to make that a blanket statement.
While we prefer to focus on data that compels a firm conclusion, the behavior of these models over the last couple of weeks has generated quite a few questions about whether it's bull market behavior. There isn't enough here to suggest it is (or isn't), with the most we could uncomfortably suggest being that it was asymmetric because gains were relatively limited after similar behavior while losses were large.
Buying climaxes are rising, and that's...a good thing?
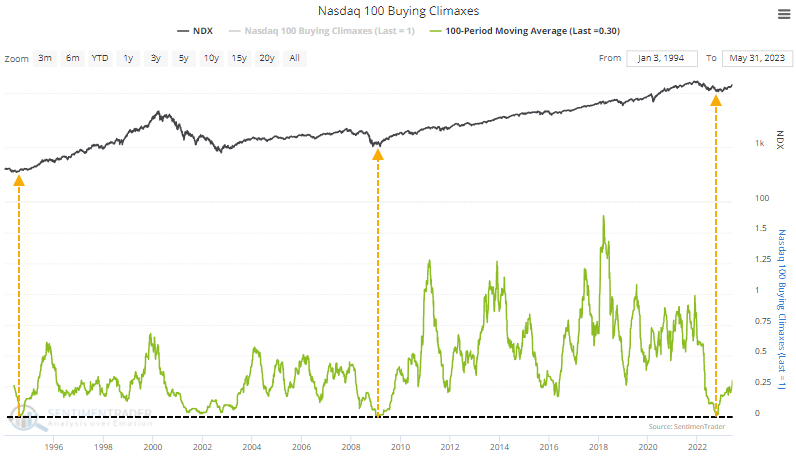
Jay noted that the Nasdaq 100 Buying Climaxes indicator is designed to identify exhaustion among buyers. A long-term version of this indicator just gave a signal that has typically been quite favorable in the past.
According to our site:
This chart shows the number of stocks in the Nasdaq 100 that reached a 52-week high during the week and then closed below the prior week's close. It suggests a climax in buying interest among investors, which is a sign of exhaustion. When the number of buying climaxes reaches an extreme, it indicates a large amount of buying exhaustion in the market, likely leading to poor returns in the medium term.
So by definition, this indicator is ostensibly designed to identify an impending period of unfavorable stock market action. But as it turns out, there is more than one way to use this indicator.
A bullish reading occurs when the 100-period average crosses above 0.25. In other words, we look for an extended period when there are few buying climaxes. When the moving average pops back above 0.25, it indicates a renewed enthusiasm for buying among Nasdaq 100 companies, even if there was some weekly exhaustion.
Interestingly, the 100-day average is emerging from one of the lowest levels in nearly 30 years, after a disastrous 2022. The fall of 1994 and early 2009 are the only other periods that match this low level, exceeding even the tech bust in 2001-02.
To increase the sample size, the red dots in the chart below highlight those times when the 100-day moving average crossed above 0.25, and the table summarizes subsequent Nasdaq 100 Index performance.
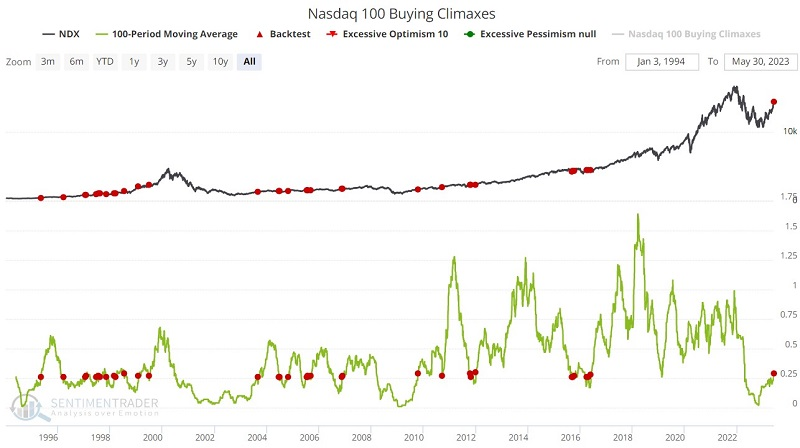
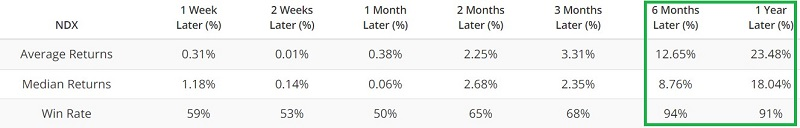
Note that results for 1-week to 3-months are fairly pedestrian. This should not be too surprising since it takes a lot of persistent buying pressure to generate a signal in the first place - which raises the odds of a near-term pullback. But 6-month and 12-month results are pretty robust, with Win Rates over 90% and strong median returns. The most recent signal just occurred on 2023-05-30.
We're still in a long-term sweet spot
Jay suggested that a reliable seasonal trend merely tells you when to look where. One of the most ignored - and powerful - combinations is a bullish seasonal trend combined with bullish price action.
As outlandish as it may seem at first, the trend is that every 20 years, the 39-month period that extends from September 30th of the Year ending in 2 (1902, 1922, 1942, etc.) through December 31st of the Year ending in 5 (1905, 1925, 1945, etc.) has been bullish for the stock market.
First, the obvious implication based on this trend is that the stock market will continue to be in a bull market through 2025-12-31. Truth be told, based on the current state of affairs in the market and economy, it seems foolhardy to follow this notion blindly and remain fully invested based solely on one seasonal trend.
Still...the chart below displays an equity curve showing the growth of $1 invested in the Dow Jones Industrial Average only during the 39 months from the end of September of Year "2" through the end of Year "5" every 20 years starting in 1902, including the months since September 2022.
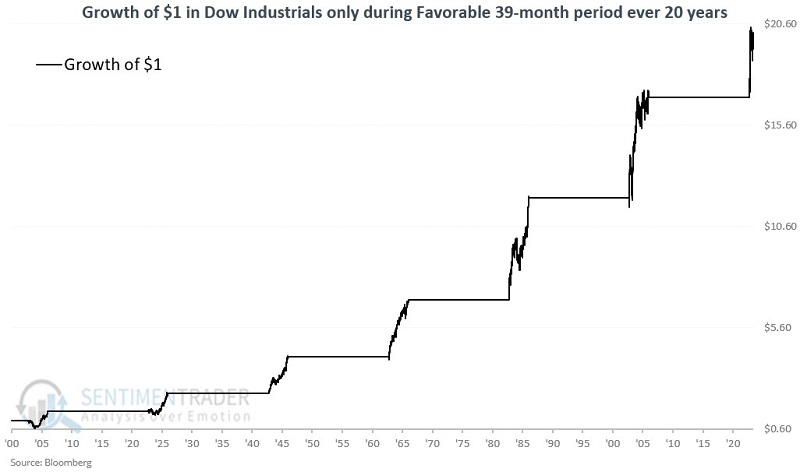
During these windows, the Dow rallied every time, averaging +60.6%. The minimum return was +41.2%, with a median drawdown from any peak being a relatively mild -15.7%.
Seasonal trends should rarely, if ever, be used as a standalone trading method. Particularly one that lasts for 39 months - a lot can happen in 39 months. The real lesson from the information above is this - as long as the major indexes are acting well, it may be best to ignore gloom and doom predictions and give the bullish case the benefit of the doubt.
The U.S. is outperforming all of Europe
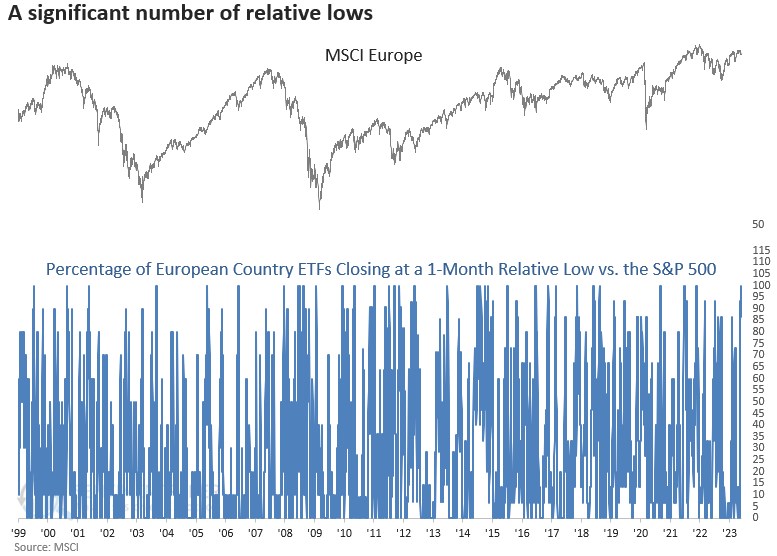
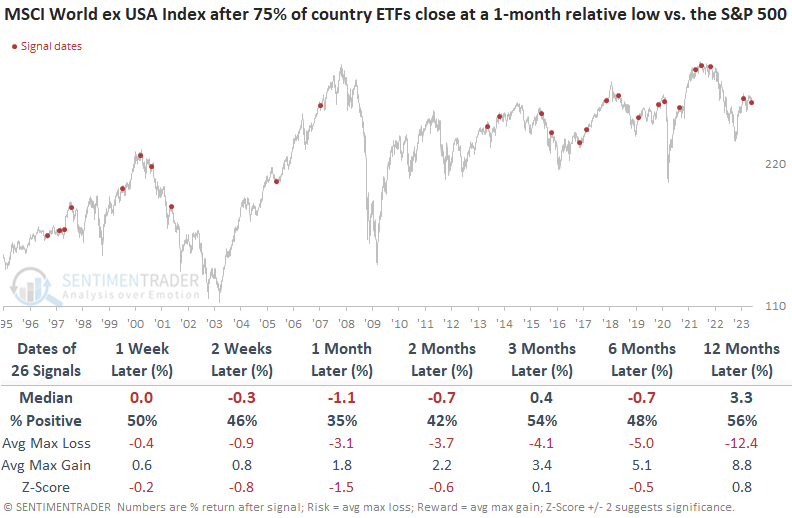
Dean showed that every European country ETF closed at a 1-month relative low versus the S&P 500. Similar comparative breakdowns led to a near-term bounce that eventually failed. Also, relative lows across the globe have surged to a level that suggests unfavorable returns.
On Tuesday, every European country ETF closed at a 1-month relative low versus the S&P 500. The surge in relative lows occurred with the MSCI Europe Index down less than 5% from a multi-month high. The previous surge in relative lows near a high occurred in November 2021, which was an ominous sign.
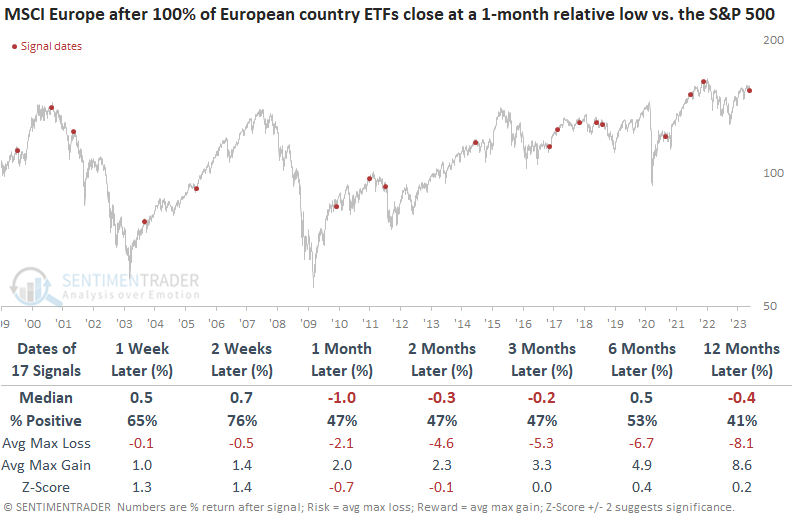
When every European country ETF registers a 1-month relative low versus the S&P 500 near a high, the MSCI Europe Index tends to bounce soon. However, after a few weeks, the rally falters, with negative returns over the next one to three months.
In addition, more than 75% of country ETFs closed at a 1-month relative low, with the MSCI World ex USA Index within 5% of a multi-month high. The severe relative breakdown for country ETFs near a high does not bode well for the MSCI World ex USA Index over the next six months.
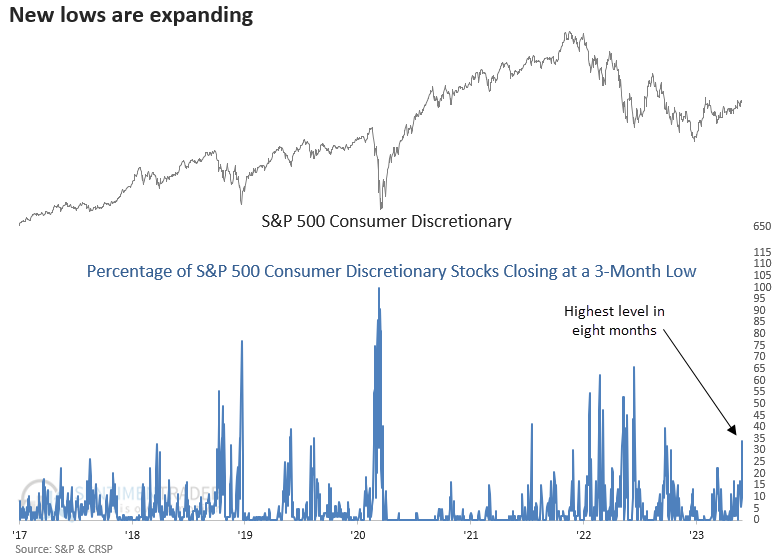
Multi-month lows are rising among Discretionary stocks
Dean showed that the percentage of 3-month lows in the Discretionary sector exceeded 30% within ten days of a high. Similar expansions in 3-month lows near a high preceded negative returns a month later.
The expansion in new lows so close to a high provides additional evidence of a split market whereby cap-weighted indexes say one thing, as stocks within the index say something else. Sometimes the divergence leads to a corrective phase, while other times, it resolves itself via a catch-up trade by the laggards.
To capture a larger sample size, Dean lowered the threshold for new lows from 33% to 30% and increased the days since high condition to ten sessions.
When the percentage of 3-month lows expands above 30% within ten days of a high, the S&P 500 Consumer Discretionary sector struggles. Over the next month, the sector rallied only 29% of the time. The two and three-month horizons suggest a stagnant environment over the summer.
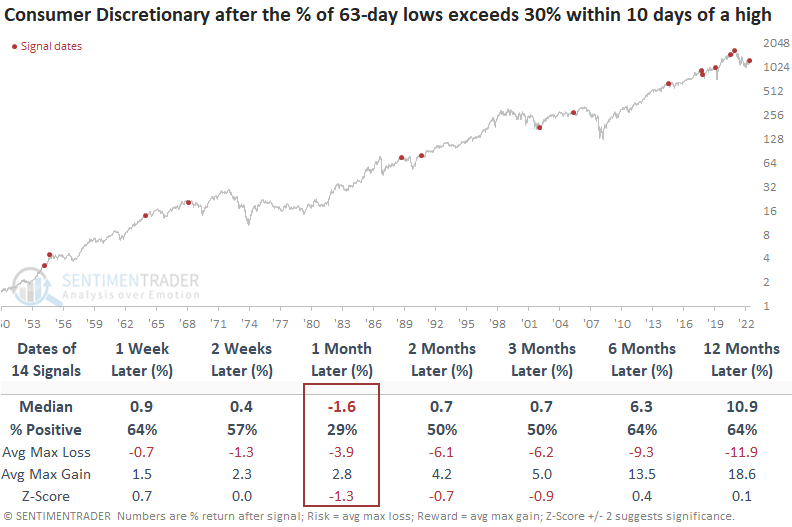
The max loss exceeds the max gain in six out of the last eight precedents. And the median max loss exceeds the median max gain from one to three months later.
The average stock within the Consumer Discretionary sector is doing much worse than the cap-weighted index would have you believe. Suppose we measure the difference between the 3-month range rank for the cap and equal-weighted Discretionary indexes. In that case, the spread exceeded 76%, the highest level in history.
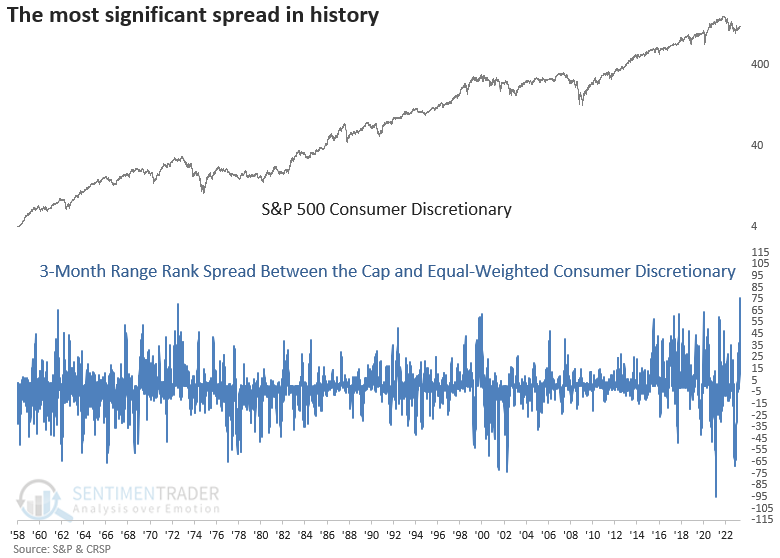
We get a mixed message when the range rank spread exceeds 55%. In the near term, the cap-weighted index could rally over the next few weeks. However, a month later, it was negative. Most divergences have occurred since 2015, capturing the impact of Telsa and Amazon.
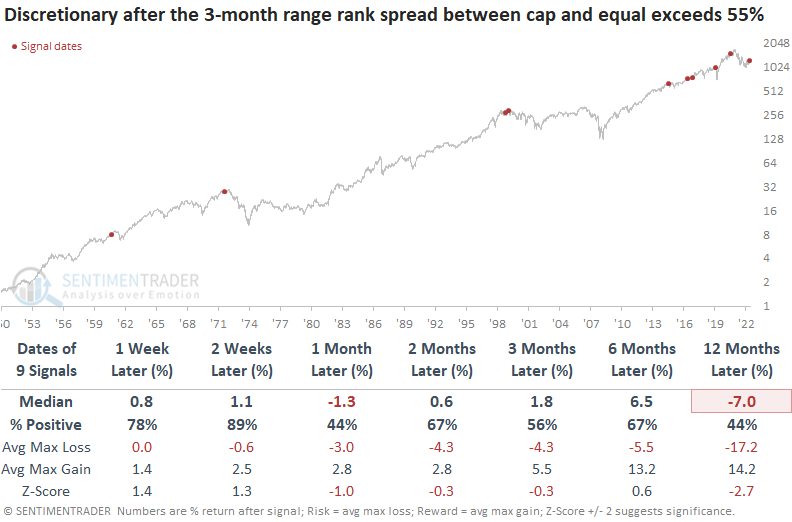
The equal-weighted Consumer Discretionary sector shows somewhat similar results - a near-term rally followed by lackluster results over a medium-term horizon.
Corn has entered a seasonal no-go zone
Jay noted that the phrase "sell in May and go away" may be most appropriate for the corn market. Corn has had a dreadful year so far in 2023 and the most unfavorable time of year begins June 1st.
The chart below displays the annual seasonal trend and the average monthly returns for corn futures. Note that December through May tend to be good performers, while June through November tends to show weakness. This is due primarily to the planting cycle in the Midwest, where much corn is grown.
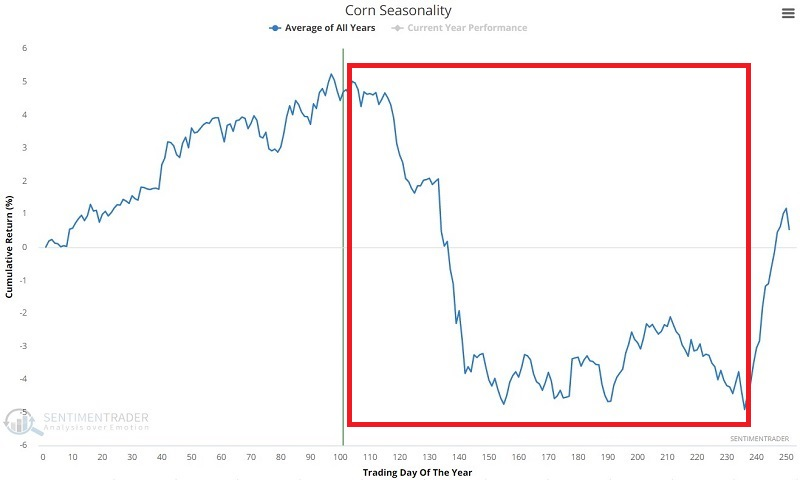
From December through May, corn futures rallied 75% of the time, with a larger average gain than average loss and a higher probability of enjoying a large gain than suffering a large loss.
Conversely, the chart below displays the hypothetical cumulative $ +(-) achieved by holding a long position in a corn futures contract only during June through November every year starting in 1901.
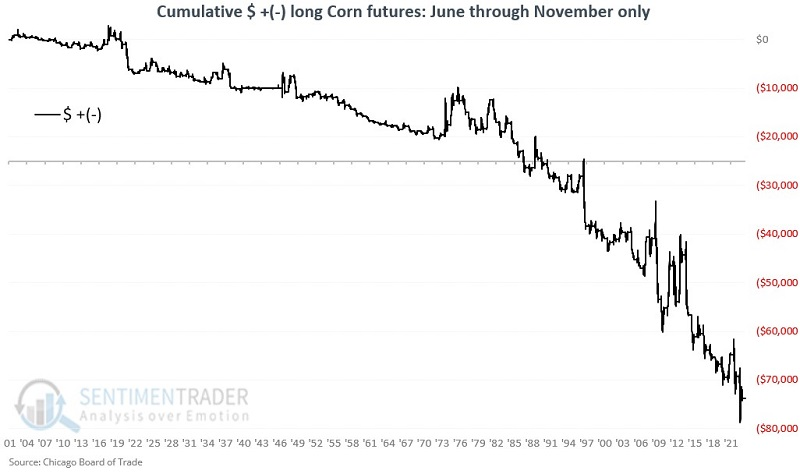
The long-term trend is clearly negative, but there are no guarantees from year-to-year and extremely sharp counter-trend rallies are fairly common.
From June through November, corn rallied only 35% of the time, with a larger average loss than average gain and higher probability of suffering a large decline than enjoying a large rally.
The hypothetical gain on a 1-lot combining long and short positions exceeds $173,000, compared to a gain of roughly $28,500 from simply buying and holding a long position in corn futures since 1901. Traders need to note that while the long/short strategy may improve the long-term odds of success, it has limitations as a standalone strategy and does not relieve a trader of the responsibility of managing risk.
About TradingEdge Weekly...
The goal of TradingEdge Weekly is to summarize some of the research published to SentimenTrader over the past week. Sometimes there is a lot to digest, and this summary highlights the highest conviction or most compelling ideas we discussed. This is NOT the published research; rather, it pulls out some of the most relevant parts. It includes links to the published research for convenience, and if you don't subscribe to those products, it will present the options for access.