
TradingEdge Weekly for Jul 7 - Falling correlations, surging junk bonds, improving macro conditions

Key points:
- Investors have been trading stocks on their merits, and selling few calls against them
- The Discretionary and Industrial sectors have perfect trend scores, as does the Nasdaq
- Investors are betting on economic growth; corporate managers aren't so sure about that
- When the PMI is low, future stock returns tend to be high
- A surge in 52-week highs compared to lows in high-yield bonds
- Our Macro Index Model has turned higher - repercussions for crude and copper
- Looking at a long-term switching strategy between stocks and commodities
Correlations are dropping as investors (don't) sell call options
Investors have become overconfident, trading stocks on their own merits, and they expect volatility to remain subdued. That sentiment has helped to push volatility lower, but it likely won't last. At least, that's the assumption by investment banks and other analysts.
The Wall Street Journal noted that investors have become more comfortable with stocks, and their correlation has dropped. Since Jay noted the spike in correlations last September, they have, indeed, fallen significantly.
Over the past 40 years, the current level of correlation between stocks in the S&P 500 is only average, however. It hasn't declined to a level indicating extreme overconfidence, nor is it still signaling panic, with investors buying and selling everything simultaneously regardless of individual merit. This isn't anywhere near a level that would suggest a warning sign.
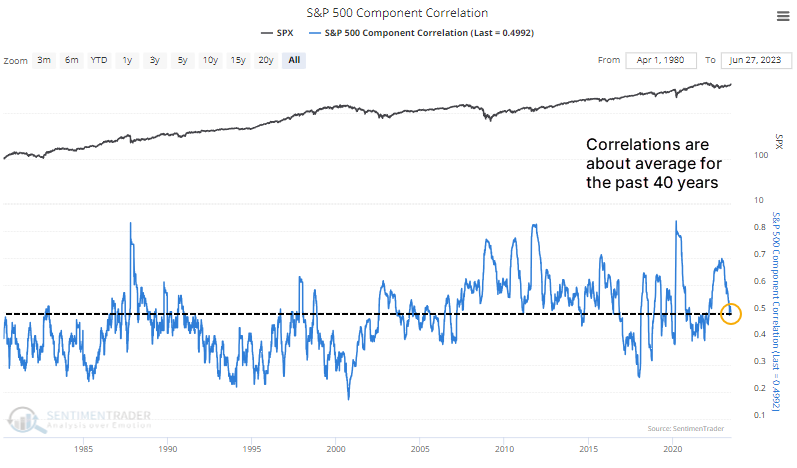
Even though correlations have been higher over the past 20 years, the current level is still above what it was at recent major market peaks. Typically, it got to 0.40 or below. Out of the various sector correlations that we track, only that for Health Care (XLV) is barely in extreme territory relative to its history.
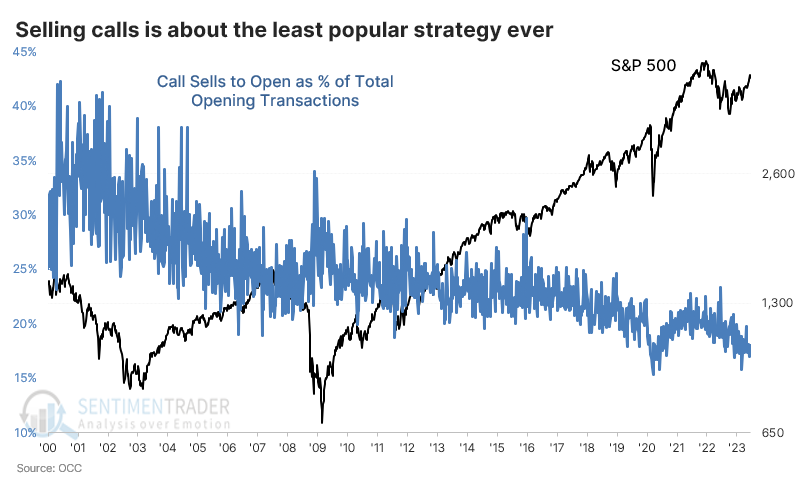
The Journal also noted that volatility is being driven lower by traders selling call options to open. This one is tough to verify, given the available data.
Looking at trades across all U.S. exchanges, the strategy of selling calls to open is about as unpopular as it has ever been. Call selling to open recently accounted for about 17% of all opening transactions. It got slightly lower during bouts of investor panic over the past few years but remains on the bottom end of its range over the past 23 years.
Among the smallest options traders, the strategy accounted for only 16% of total open transactions. That's the 3rd-lowest percentage next to March and June 2020.
When it comes to sentiment, investors seem to have a strong desire to consider everything to be a contrary indicator. That seems to be the case with the idea that investors should be cautious because correlations are falling and traders are writing too many calls. Even if that data is accurate (not really), it doesn't have much support historically for being a reliable sell signal.
Trend-following indicators are lining up
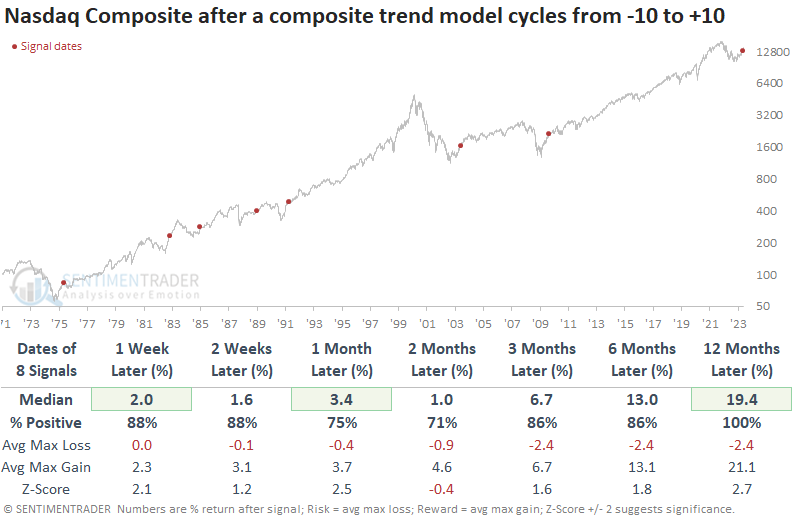
Dean showed that a trend-following composite cycled from -10 to +10, triggering a bullish signal for the Discretionary and Industrials sectors, as well as the Nasdaq Composite.
With June coming to a close, a trend composite that assesses monthly data for the Consumer Discretionary and Industrials sectors completed a trend reversal signal when their respective scores cycled from -10 to +10, joining the bullish alert from S&P 500 that occurred in April.
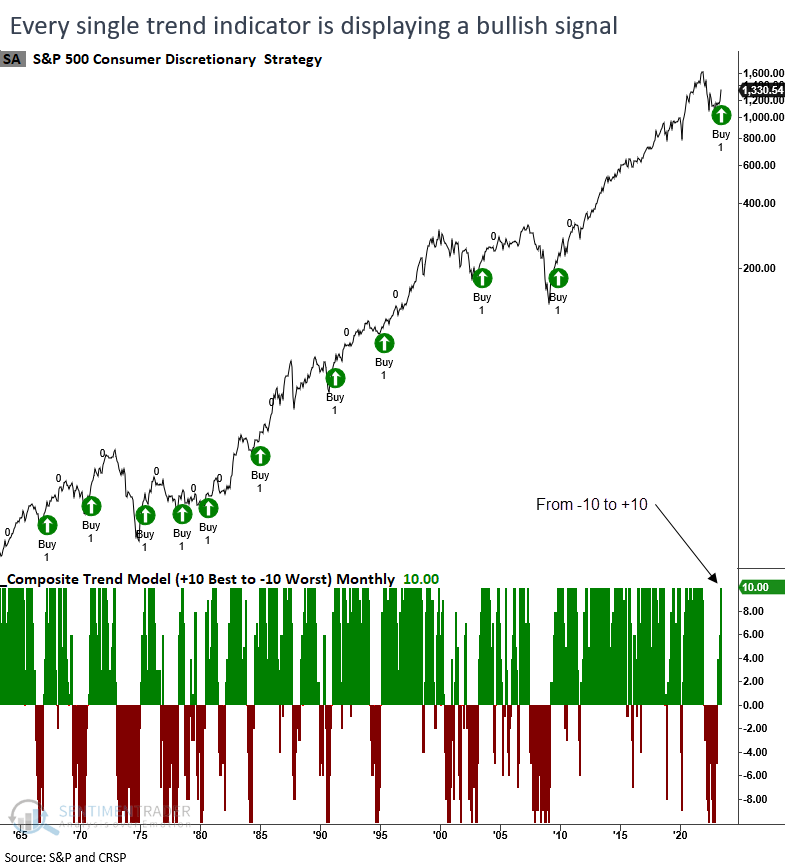
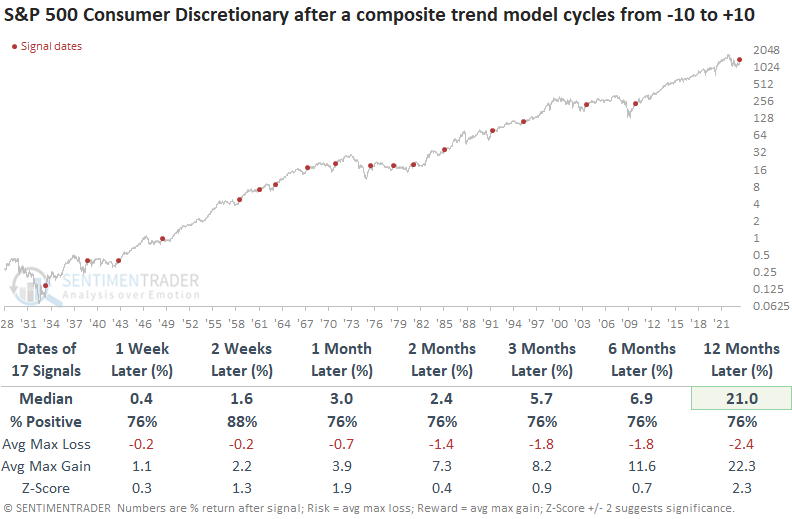
When the trend-following composite cycles from -10 to +10, the Consumer Discretionary sector rallies consistently across all time frames. And despite employing monthly data, which is less timely, the results consistently outperform average historical returns over all horizons.
Like the Discretionary sector, the Industrials tend to trend upward across all time frames consistently after similar reversals in trend indicators. Although the sector outperformed historical averages in terms of returns, it experienced slightly more substantial drawdowns compared to the Discretionary group.
The Nasdaq Composite triggered its 9th composite reversal signal since 1975 at the end of May. Up to this point, that alert demonstrates the highest return after one month when evaluating results relative to historical outcomes. After similar precedents, the Nasdaq Composite was higher a year later every time.
Investors are looking for economic growth while corporate managers aren't so confident
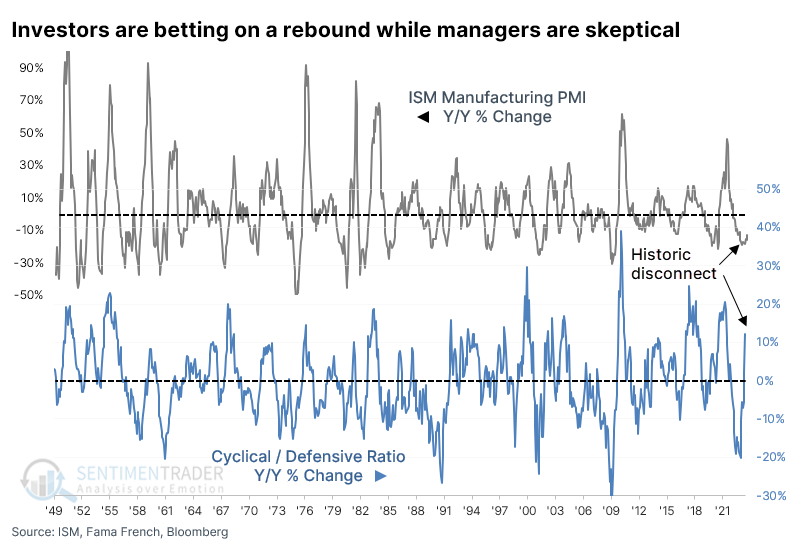
The last year and a half has been populated by a lot of "never seen before" phenomena. To those, we can add a historic disconnect between the sentiment of investors and corporate managers.
Investors have bid up the price of cyclical stocks versus defensive ones, while managers in the ISM Manufacturing survey have a poor outlook. This suggests that investors have become overly confident in a soft landing in the U.S. because they've bidded up shares of cyclical stocks while ignoring defensive ones, even though the outlook for manufacturing activity is abysmal.
This is an unusual situation - since 1948, it has never happened before. There has never been another month, other than June, when the year-over-year growth of the ratio between Cyclical and Defensive stocks was greater than +10% while the growth in the ISM survey was less than -10%.
Over the past 75 years, there has been a correlation of +0.54 (out of a scale of -1.0 to +1.0) between the year-over-year change in the two data series, so a relatively strong positive relationship.
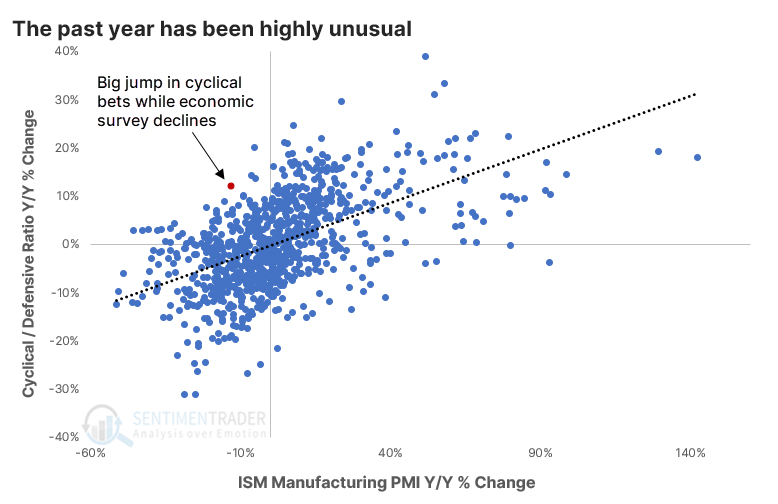
The relationship has gotten even stronger in recent years, making the past year an outlier. The 5-year rolling correlation between the two series is +0.74, but the correlation is barely positive over the past year.
As always, we're more concerned about the implications of this behavior for investors moving forward based on how they've reacted in the past. This triggered in May, and the S&P 500 had a fabulous June. After the other signals, the S&P kept going, showing a positive one-year return after 11 out of 13 signals.
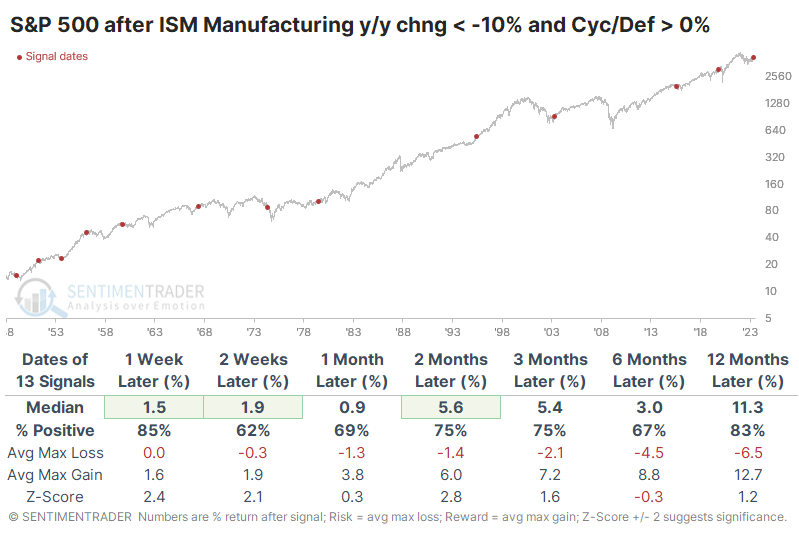
It was less of a consistently good sign for the ratio between the two sectors. While Cyclicals tended to keep outperforming Defensives in the first few months after the signals, only four signals kept it up over the next six months.
Due to the extreme nature of the current signal, let's look at some of the more egregious precedents. These are the few times when the ISM year-over-year change was still below -10%, but the Cyclicals/Defensive ratio rose by at least +5%. For what it's worth, the S&P 500 was lower most of the time six months later but higher every time but once twelve months later.
About that negative outlook...
The recent trend in the PMI Manufacturing Index (PMI) is setting off narrative alarms of gloom and doom for the economy and the stock market. Jay showed that historical stock market performance is sending a different message.
According to the general narrative, sharp declines and/or low readings in the PMI indicate economic weakness and, in many cases, recession. And there is some truth to this. However - and more importantly for investors - the stock market is a discounting mechanism that looks about nine months down the road.
The chart below shows a red dot every time the 3-month PMI moving average was at or below 47. The table summarizes S&P 500 Index performance following all readings below 47.
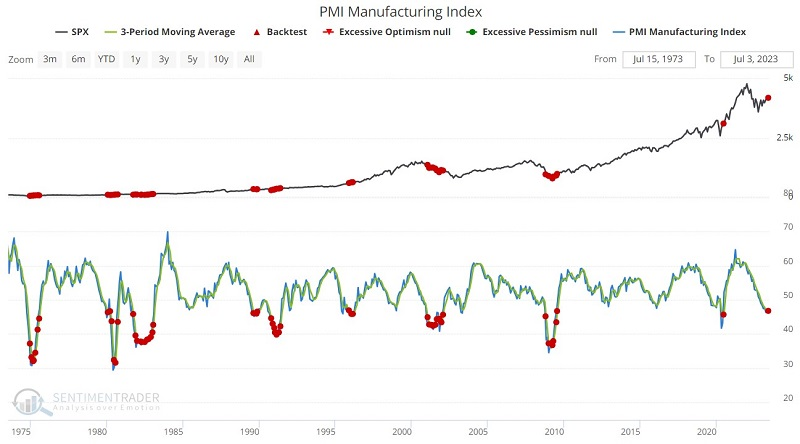
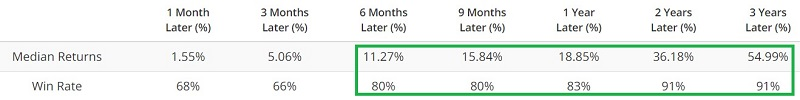
The obvious - and counterintuitive - thing to note is that stock market performance has been better following low readings than following higher readings. One-year returns improve from 11.94% to 18.85%, and the one-year Win Rate improves from 75% to 83%.
The primary point is to highlight the danger of falling for the standard "Oh my God; the PMI is falling/low, all hope is lost" narrative that typically accompanies such readings.
NOTE: Catch a recent interview with Jay here.
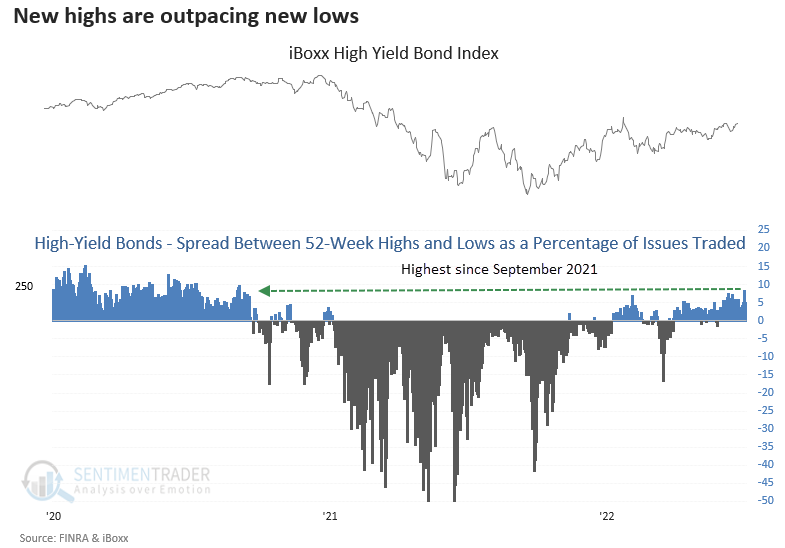
Surge in high-yield bonds at highs versus lows
Dean showed that the spread between 52-week highs and lows as a percentage of issues for high-yield bonds exceeded 8%. Similar spread levels produced excellent returns for a high-yield bond index and the S&P 500.
The recent surge in the spread to an 18th-month high is an interesting development, especially in light of rising Treasury yields and the growing chorus of recession and credit crunch predictions.
When the spread between 52-week highs and lows as a percentage of issues traded exceeds 8%, the iBoxx high-yield bond index has risen in the months ahead every time. Although the study takes into account only a few recessions and bear markets, the spread has never reached the current level during those volatile periods.
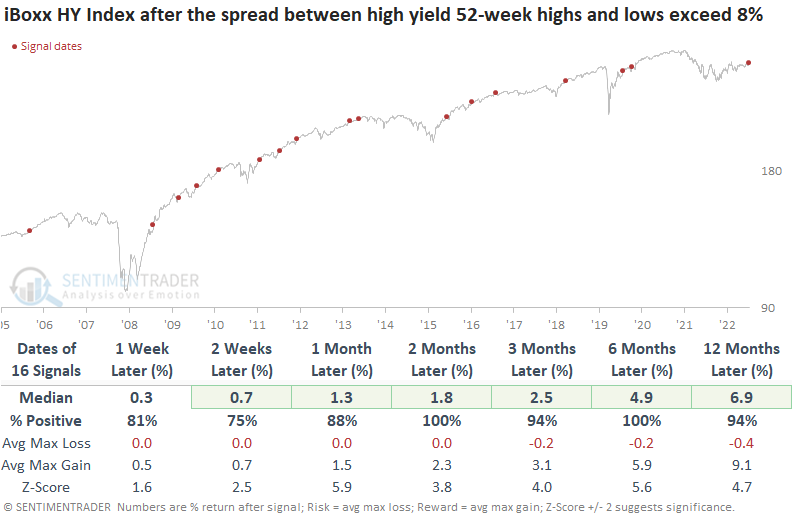
Over the past 17 years, the spread has never approached this level during either recessions or bear markets, suggesting we're not currently in that type of environment.
High-yield bonds are known for their correlation with stocks, meaning they tend to rise and fall together. So, when market breadth indicators such as the 52-week high-low spread signal a bullish trend for high-yield bonds, it also suggests a bullish outlook for stocks. The S&P 500 showed a positive return every time two months after these high-yield bond signals.
An uptick in macro conditions
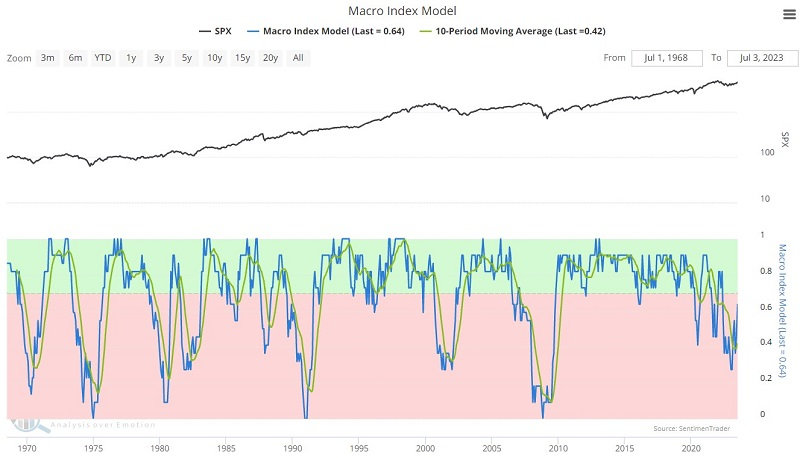
Jay noted that our Macro Index Model continues to improve, and crude oil and copper have shown a tendency to react in a particular manner to improvements in this model.
Our Macro Index Model combines 11 diverse economic indicators to determine the state of the U.S. economy right now. The good news is that - despite the steady drumbeat of economic gloom and doom among many pundits - the index has improved considerably in recent months. The bad news is that the latest reading remains below 0.70, our cutoff for "favorable" versus "unfavorable" readings for the economy and the stock market.
The chart below displays the Macro Index Model (MIM) and its 10-month moving average. The latest reading is 0.636, up from its recent low of 0.273 five months ago. The 10-month moving average just crossed back above 0.40 and stands at 0.42.
Following those rare occasions when the MIM 10-month average crossed up from below 0.40, crude oil has tended to struggle mightily one to six months after a signal. The problem is that there have only been three previous signals before the most recent one.
The chart and table below display copper following those occasions when the MIM 10-month average crossed from below 0.40 to above 0.40.
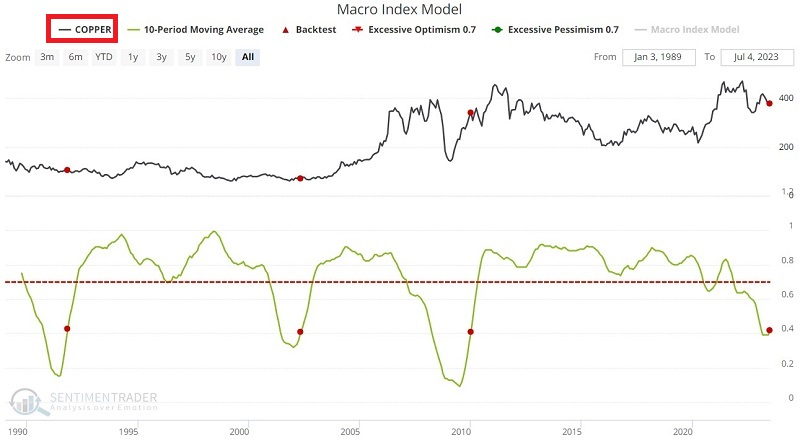
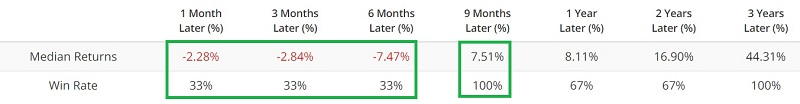
Copper has also tended to struggle mightily one to six months after a signal. It also has experienced another weird quirk between 6 and nine months after previous alerts. The same caveat of a small sample size applies here. That said, following the last three signals, copper experienced some notable declines during the first six months.
Does this mean that copper is doomed to struggle between now and 2024-01-03? And then rally sharply from there until 2024-04-03? Not at all. But history suggests that traders look for potential opportunities that follow those trends. Like crude oil, copper has shown significant seasonal weakness during the second half of the calendar year - and seasonal strength during the first part of a new year.
A long-term switching strategy between stocks and commodities
Last week, Jay outlined a 15-year cycle that alternated between stocks and commodities outperforming. He continued the series this week, considering a strategy that switches between commodities and stocks every 15 years.
The test begins on 1933-06-30. We will hold commodities for 15 years and then stocks for 15 years, and so on. The chart below displays the growth of $1 using this Switching Strategy (black line) versus the growth of $1 using a 50/50 strategy (blue line) that will buy-and-hold commodities and stocks on a 50/50 basis and rebalance to 50/50 at the end of each calendar year.
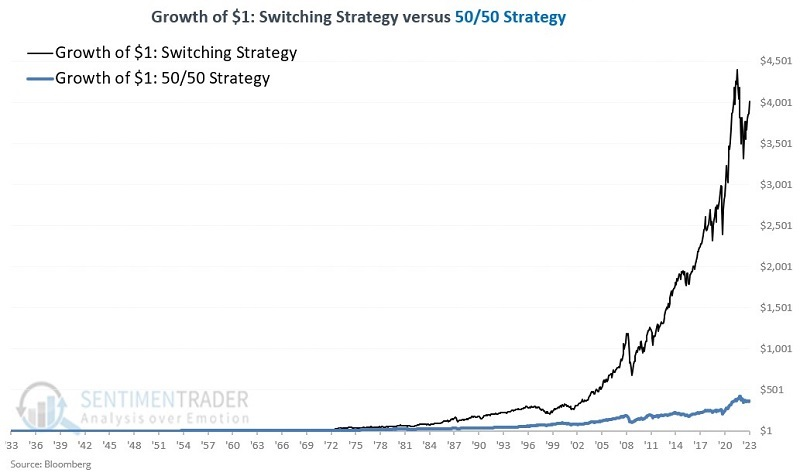
From 1933 through June 2023, the hypothetical value of $1 invested using the Switching Strategy is $4,113. The hypothetical value of $1 invested using the 50/50 Strategy is $371.
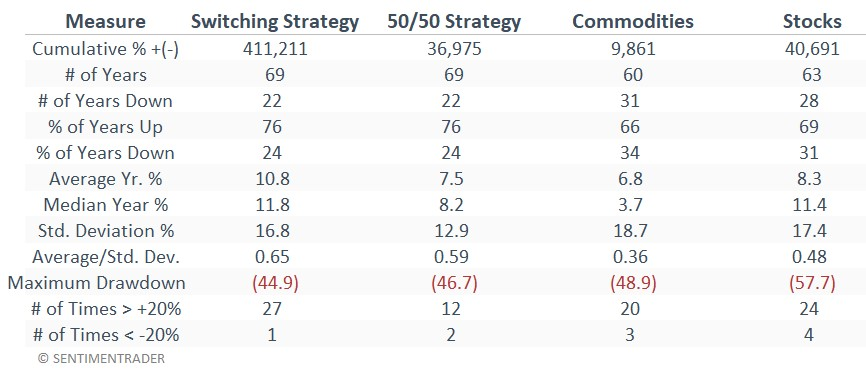
The table below displays a variety of relevant facts and figures for:
- The Switching Strategy
- The 50/50 Strategy
- Buying and holding commodities
- Buying and holding stocks
All results are based on monthly data. Intra-month fluctuations may be more significant than what is reflected here.
A straightforward alternative to trading futures is to buy an ETF or ETN that tracks a basket of commodities. Many choices include PDBC, DBC, GSG, GCC, and others. Of those Jay tested, the Invesco Optimum Yield Diversified Commodity Strategy No K-1 ETF (ticker PDBC) has a few advantages. It has a higher correlation to the Bloomberg Spot Commodity Index used in testing, it is heavily traded, it has a lower expense ratio than most of the others, and it does not issue a K-1 form at tax time. It should be noted that PDBC does not track a particular index but rather is actively managed.
About TradingEdge Weekly...
The goal of TradingEdge Weekly is to summarize some of the research published to SentimenTrader over the past week. Sometimes there is a lot to digest, and this summary highlights the highest conviction or most compelling ideas we discussed. This is NOT the published research; rather, it pulls out some of the most relevant parts. It includes links to the published research for convenience, and if you don't subscribe to those products, it will present the options for access.