
TradingEdge Weekly for Jul 18 - Index momentum, equal weight laggard, soybean seasonals

Key points:
- The S&P 500 (and tech sector) have held about its 20-day average for 55 days
- Some sectors like discretionary and small-cap stocks are lagging
- The equal-weighted S&P 500 hasn't closed at a new high for more than 150 sessions
- Asset managers are showing new uptrends
- Soybeans are entering a seasonal soft spot
A nice winning streak
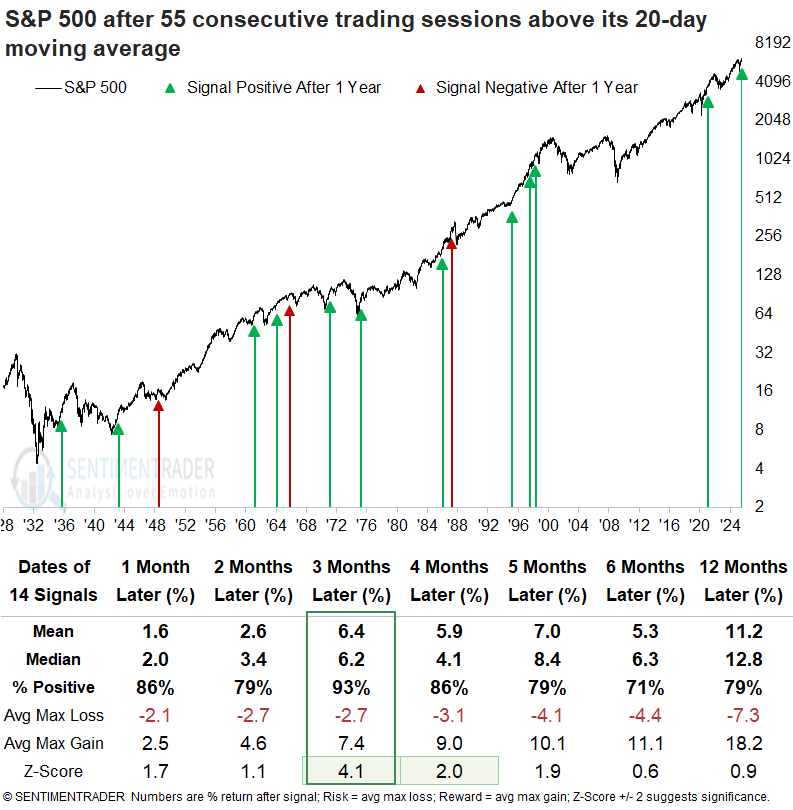
The S&P 500 has sustained above its 20-day average for 55 consecutive trading sessions. Dean showed that similar win streaks saw the benchmark index rise 93% of the time over the following three months.
The impressive streak reflects the kind of persistent buying pressure typically associated with strong bull market trends, rather than sideways or bearish conditions.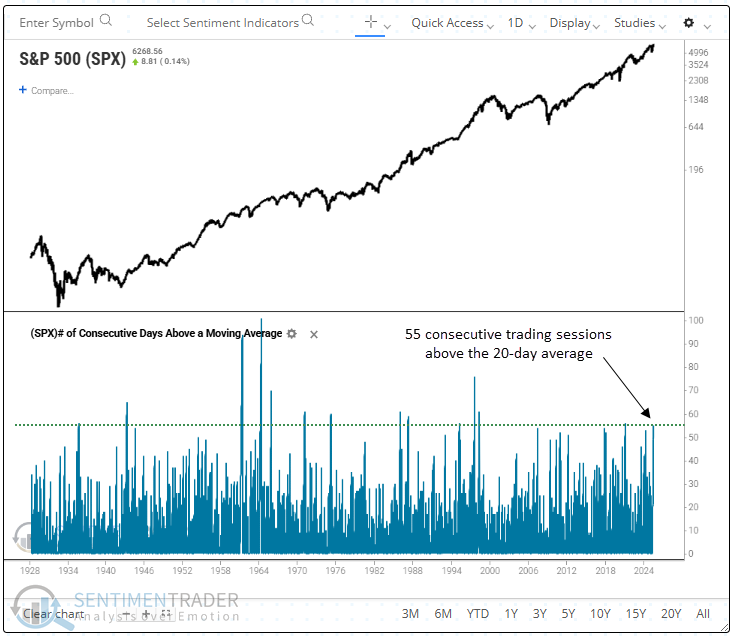
Whenever the S&P 500 closed above its 20-day average for 55 consecutive trading sessions, the world's most benchmarked index exhibited a strong bullish bias, advancing in all but one instance over the following three months. It's worth noting that three signals appeared during the Dot-com boom of the 1990s, a period frequently cited as a parallel to today's AI cycle.
Indexes tied to technology and industrials have consistently remained above their 20-day averages for an extended period, reflecting the momentum driven by themes such as artificial intelligence and data center expansion. For only the 11th time since 1954, the S&P 500 Technology sector persisted above its 20-day average for 55 straight sessions, a remarkable feat for a volatile sector. Similar signals saw the large-cap tech sector steadily rise over the subsequent twelve months.
But some sectors are lagging
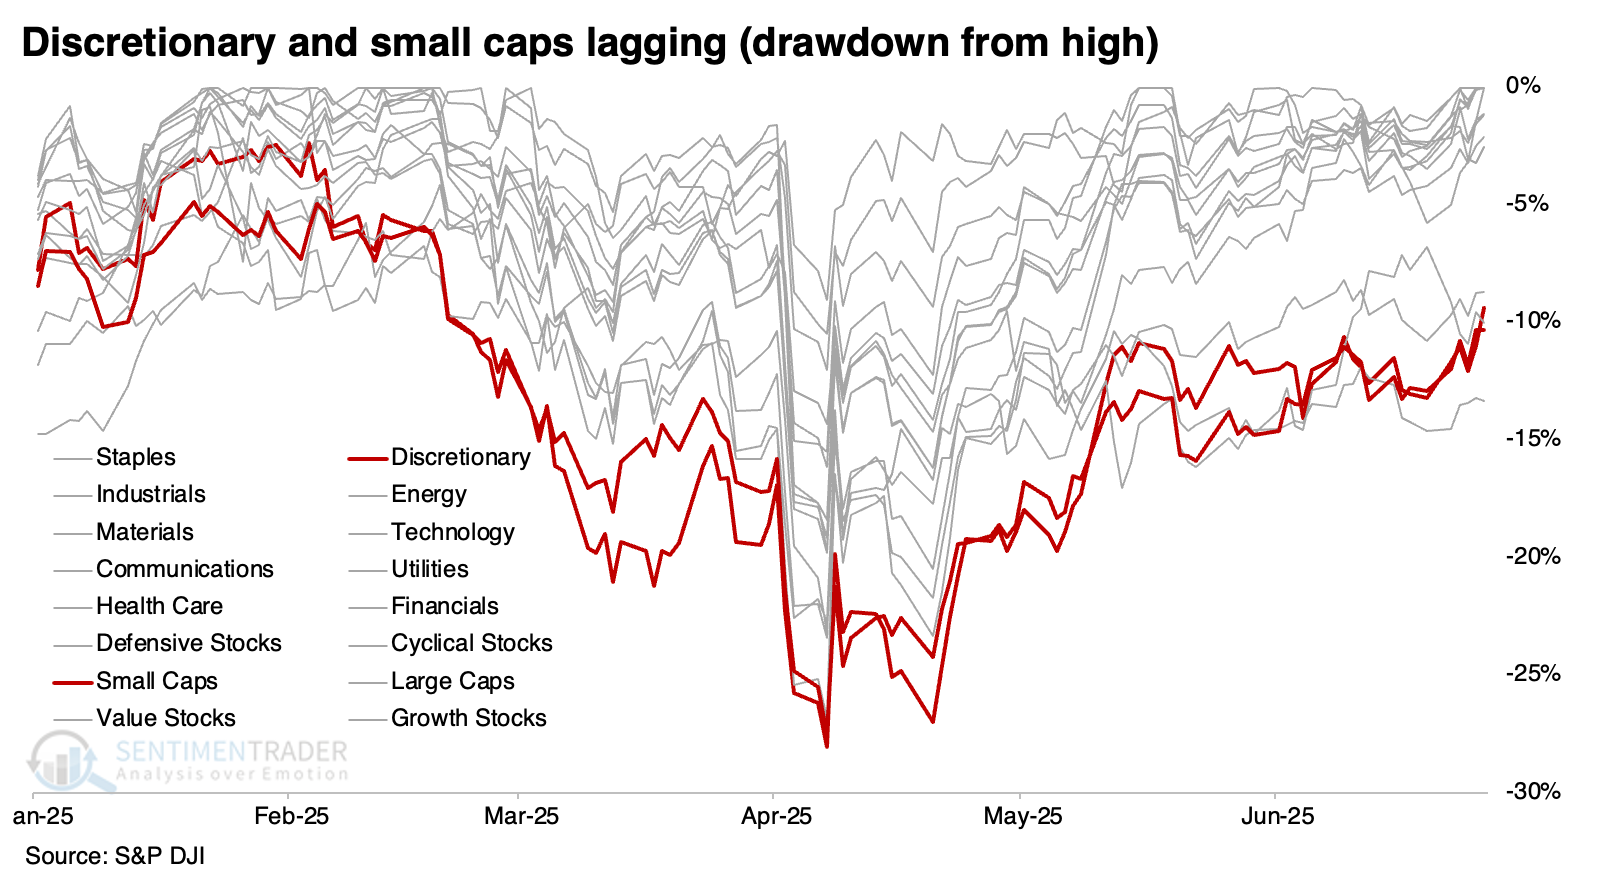
According to The Wall Street Journal, the rally isn't being led by what it should be. A recent article noted that discretionary and small-cap stocks have held back, which is not traditional bull-market leadership.
The statement itself is undoubtedly true, with only health care in a worse drawdown than discretionary and small-cap stocks. Note that this was as of the S&P 500's initial breakout to new highs near the end of June, but it still holds true today.
This is a very unusual setup, with few precedents even going all the way back to 1926. It has only happened three times, making it impossible to form any firm conclusion.
We have to relax the parameters to generate a larger sample size, so the table below shows what happened after any time the S&P 500 recovered from more than a -10% drawdown. At the time of its recovery, both small caps and discretionary stocks were at least -3% off their own highs.
This triggered right before the 1990 recession and coincident correction in the S&P, with a fairly vicious drop over the next four months. But that was it for that decline and was also the only instance that preceded any notable drop in stocks. The S&P sported a healthy average return across time frames, with a decent risk/reward ratio over the following year.
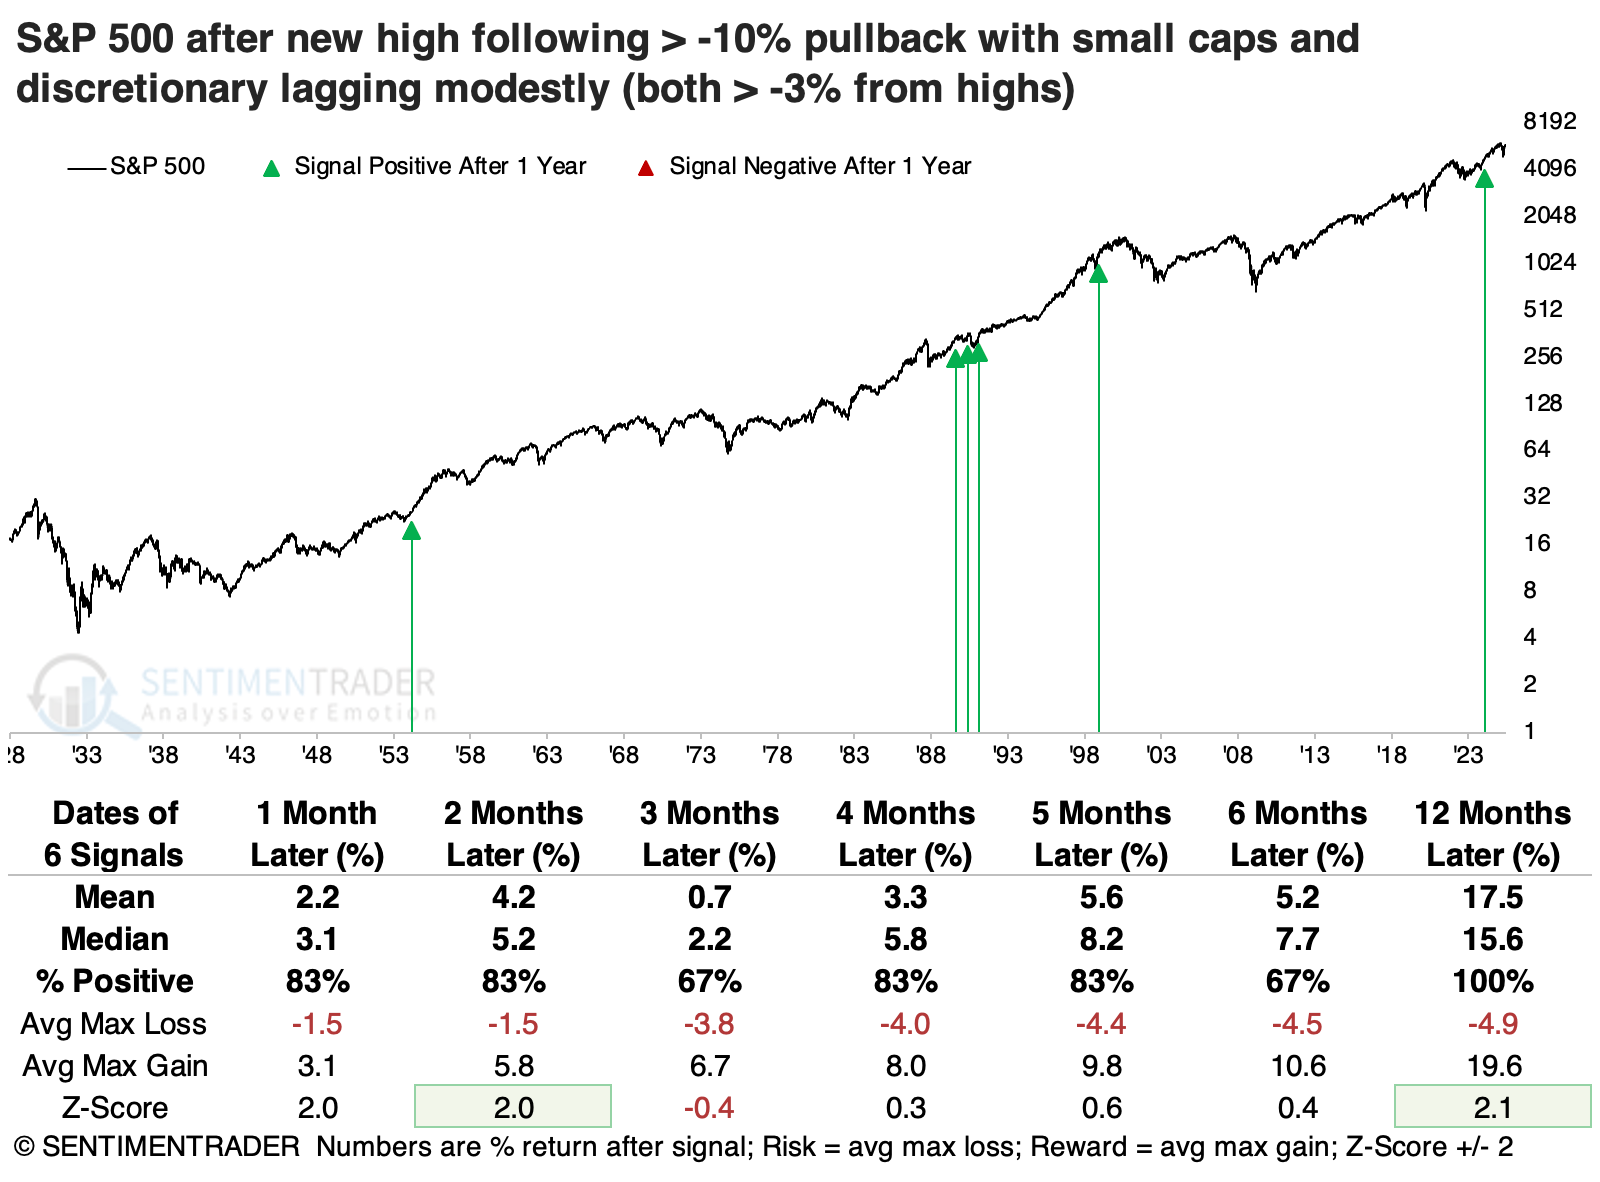
The 1990 exception was painful, no doubt. But across the other signals, the maximum drawdown up to a year later was only -4.5%. All the other signals lost no more than that at any point.
A year later, the growth factor averaged a return north of +30%, far outpacing the other factors. Discretionary stocks showed among the best returns over the following four to twelve months, suggesting some tendency for mean reversion.
The average stock is lagging, too
While the breadth of the market has been okay as indices like the S&P 500 reach record highs, it's not exemplary.
That has been evident for anyone betting on the average stock in the index. The S&P 500, which virtually everyone follows, is weighted by market capitalization. The version of the index that weights every stock the same is still waiting. It's been over 150 days since it closed at a new high.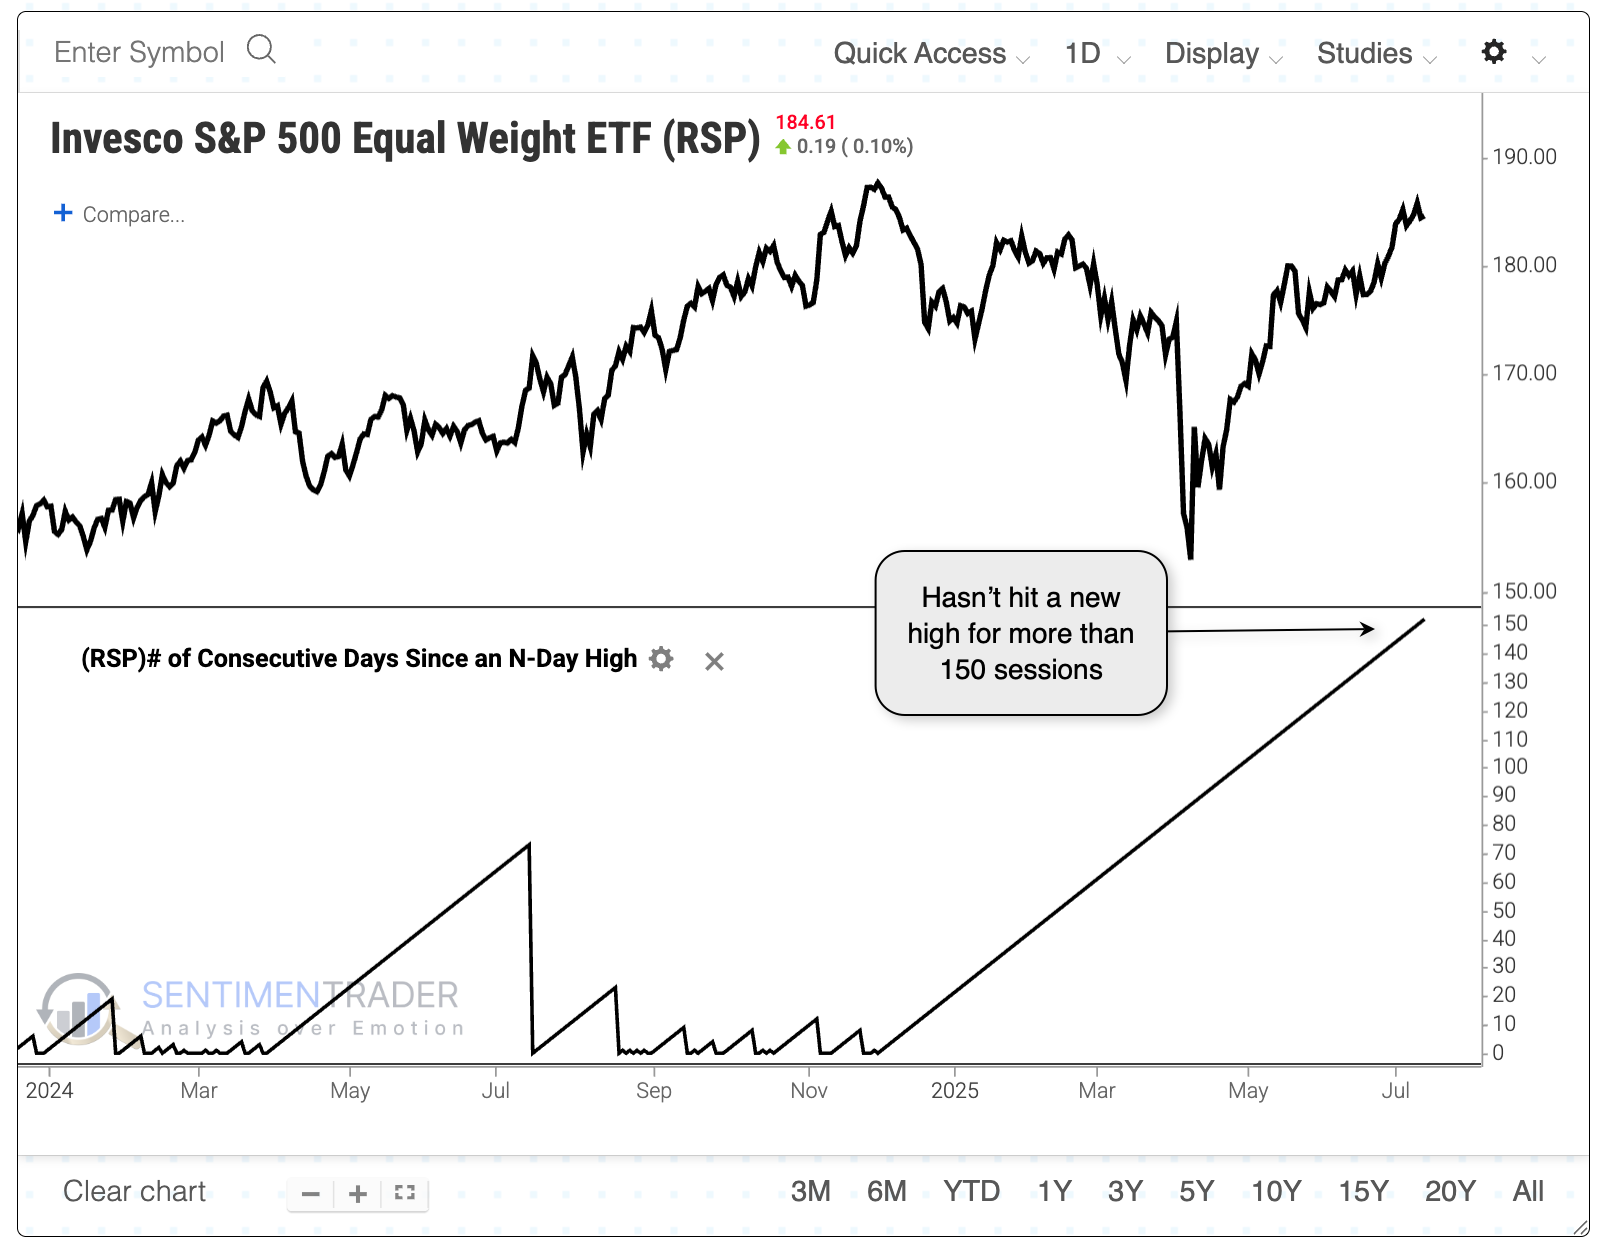
When the S&P reached a new high but the equal-weight version of the index hadn't for at least 150 days, it preceded a few significant declines for the index. Only two preceded sustained bear markets (in 1972 and 2000), while the others were temporary and soon led to even more new highs.
The equal-weight version of the S&P took bigger hits during the 1972 and 1990 declines, but its declines were moderated outside of those two. That was especially the case in 2000, when this version of the S&P held up much better than the cap-weighted version with a gain of +2.5% compared to a loss of -24.9% for the cap-weighted version. Over the past 30 years, each of these conditions preceded rallies.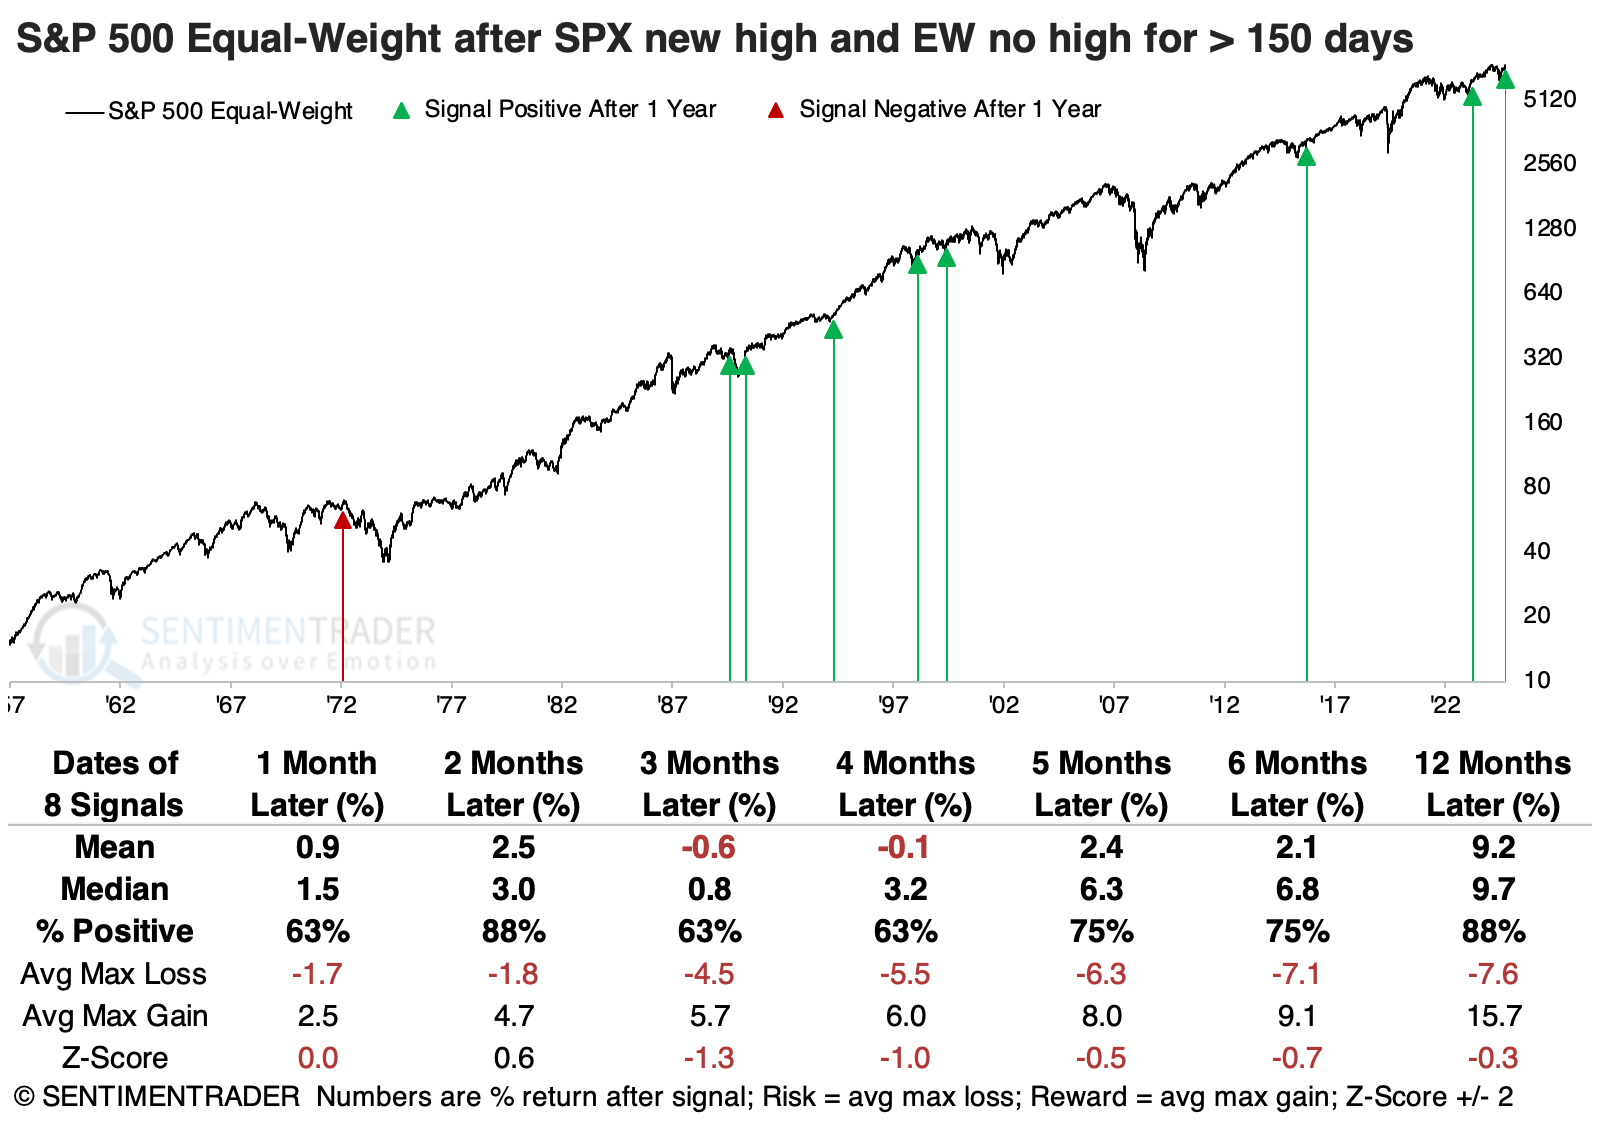
We can also see the mediocre participation from the relative paucity of new highs among S&P 500 stocks. No more than 10% of stocks have reached a new high throughout the latest breakout. That's far below the prior bull move when it was a regular occurrence.
When the S&P 500 reached a new high for the first time in at least four months, but with fewer than 7% of its stocks also hitting new highs, the 1999-2000 period shows up again, as did 1990. The equal-weight version of the index showed slightly more consistent gains, though that's hard to argue given the small sample size. A year later, it suffered only a single, slight loss.
Asset managers' new uptrends
The S&P 1500 Asset Management sub-industry group triggered a new trend score buy alert. Dean showed that alternative asset managers have shown notable improvement, with KKR triggering a buy signal.
With alternative asset managers, who invest and lend across a wide range of industries, now joining investment banks, brokers, and exchanges in showing favorable trends, the growing strength across the capital markets complex reinforces a bullish message for the broader market.
The S&P 1500 Asset Management sub-industry group generated a trend score signal on Wednesday when it registered a 42-day absolute and relative high as both its trend and relative trend scores maintained a level of eight or higher.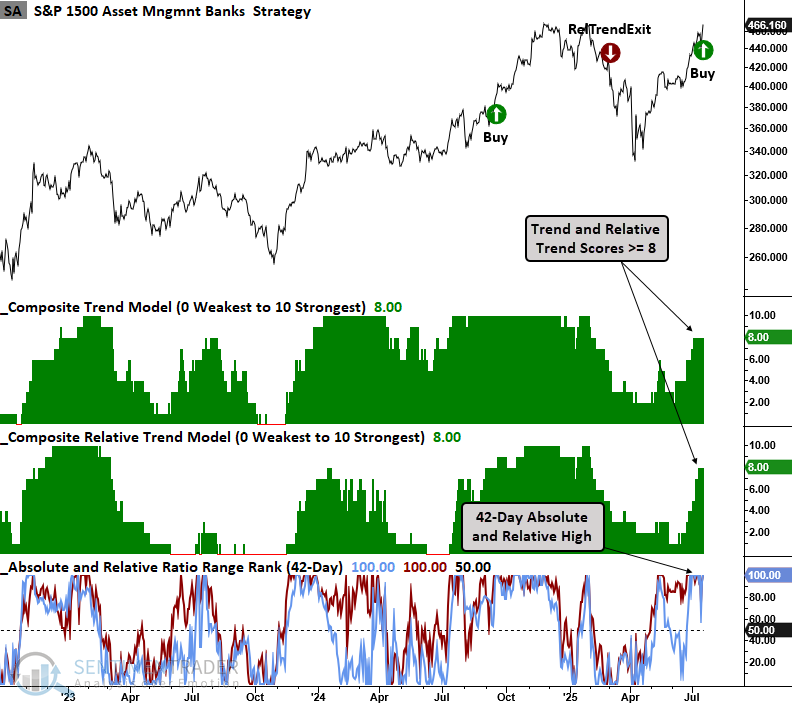
KKR & Co., which has expanded beyond private equity to real estate, credit, hedge funds, insurance, and other capital markets dealmaking, triggered a trend score alert when it registered a 42-day absolute and relative high as both its trend and relative trend scores maintained a level of eight or higher.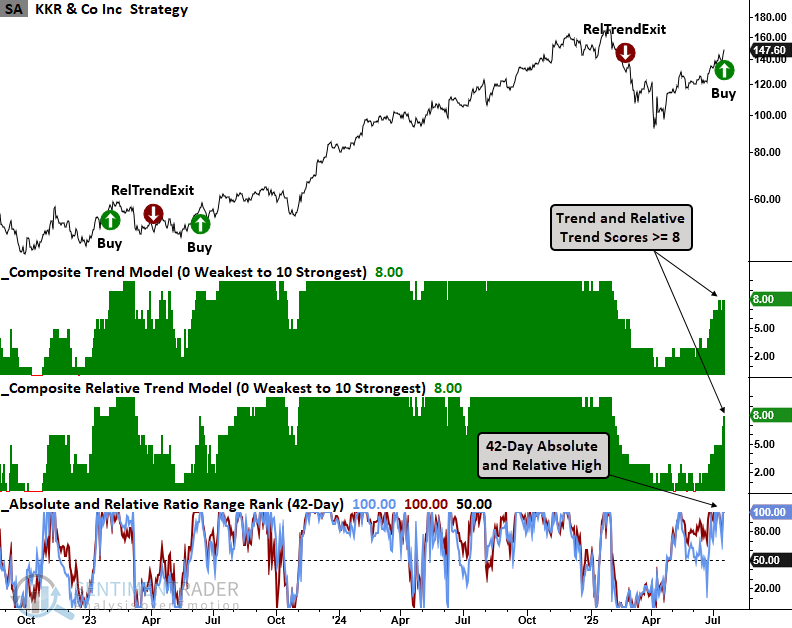
The S&P 500 Financials sector exhibits the third-highest percentage of stocks with a trend and relative trend score of eight or higher, suggesting a favorable backdrop when compared to other sectors and the S&P 500.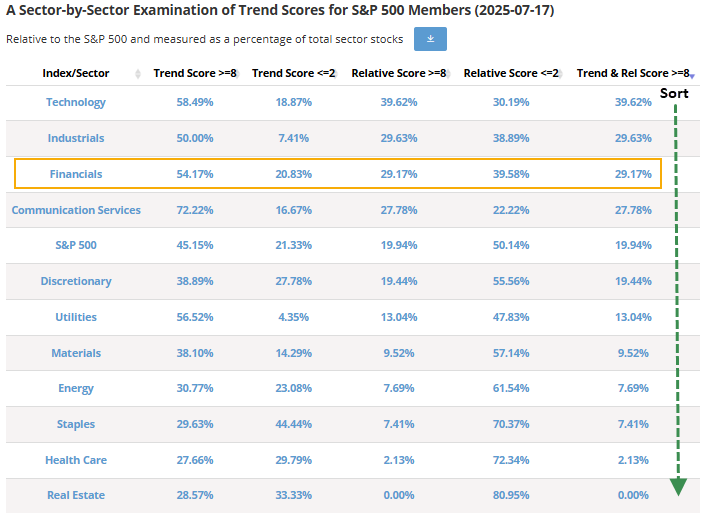
Soybeans souring
Soybeans have shown themselves to be one of the most consistently cyclical commodity markets. Due to the planting cycle in the U.S., the risk to the current year's crop is typically well known by mid-July. Jay noted that prices have resumed a price downtrend with weak seasonality.
Because soybeans are a highly cyclical market, some pundits expect the next big price move to be up. Perhaps they will ultimately be proven correct. Nevertheless, history strongly suggests that caution.
The Annual Seasonal Trend chart for soybeans reveals that July, August, and September are typically the weakest months of the year for beans.
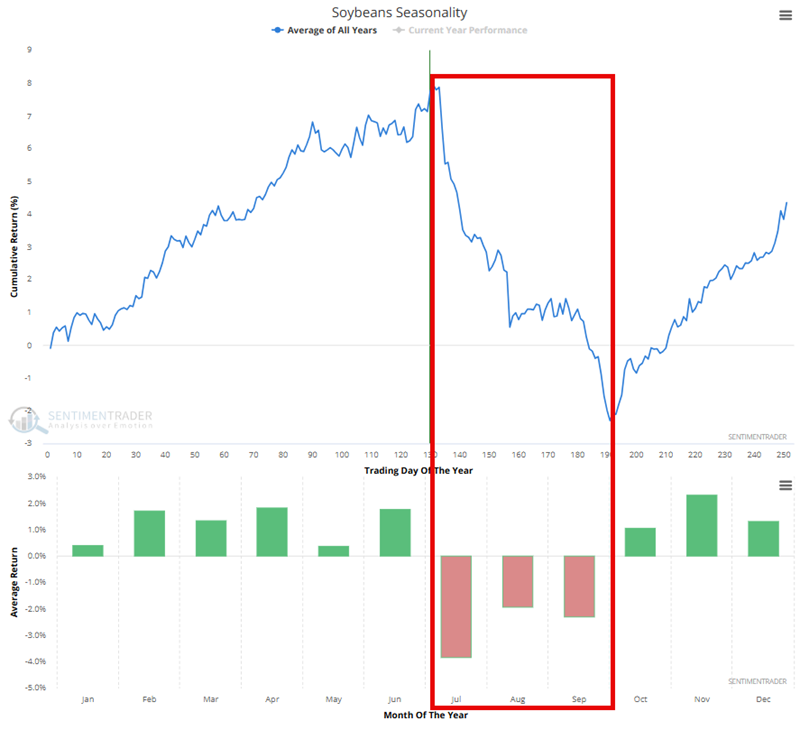
Specifically, the weakest seasonal time of year for beans extends from the close on Trading Day of the Year (TDY) #131 through the close of TDY #191. For 2024, this period extends from the close on 2025-07-14 through 2025-10-07.
The chart below displays the hypothetical return from holding long one soybean futures contract only during this period every year since 1937.
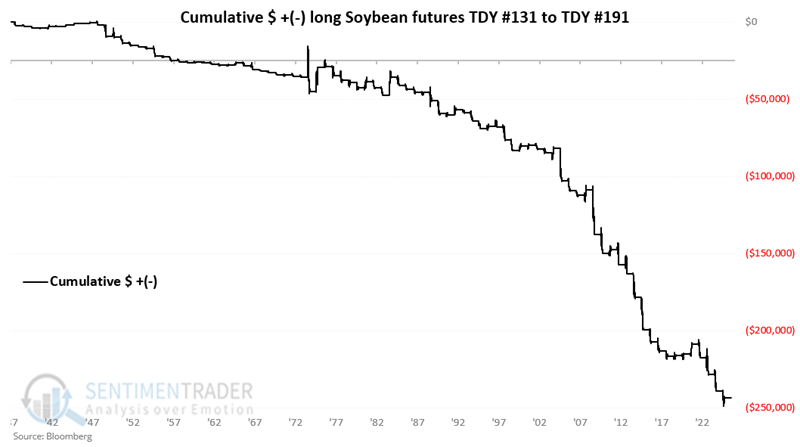
These periods showed a positive return only 25% of the time, with a median gain only about half the median loss. The contract gained more than +$5,000 only 3 years, while losing more than -$5,000 during 23 years.
About TradingEdge Weekly...
The goal of TradingEdge Weekly is to summarize some of the research published to SentimenTrader over the past week. Sometimes there is a lot to digest, and this summary highlights the highest conviction or most compelling ideas we discussed. This is NOT the published research; rather, it pulls out some of the most relevant parts. It includes links to the published research for convenience, and if you don't subscribe to those products, it will present the options for access.