
TradingEdge Weekly for Jul 17 - Seasonal tailwinds, Brazil breadth thrust, crude-energy divergence, term structure warning, daily routine, speculative leadership fade

Key points:
- Gold, Natural Gas, Wheat, and the Japanese Yen are all entering historically favorable seasonal windows - Gold's best period has produced a cumulative 154% gain since 1985, while Natural Gas's 'power zone' turned $1 into $44.86.
- Ibovespa McClellan Oscillator surges above +100 after a 52-day streak of poor participation - historically triggers a 100% win rate with zero drawdowns exceeding 5% over the 1-5 month window, signaling a structural recovery for local investors.
- Crude's 9% one-day surge pushed the XLE-crude spread to a rare trigger at -5.77, but with 90%+ of energy stocks already above their 10-day average, historical results flip negative - the edge disappears when the sector is already fully participated.
- The Crude Oil Term Structure crossed above 1.05 (extreme backwardation) - over the last 15 years, this signal has produced a dismal 15% win rate and double-digit average drawdowns over six months, with collateral damage spreading to unleaded gas, heating oil, and natural gas.
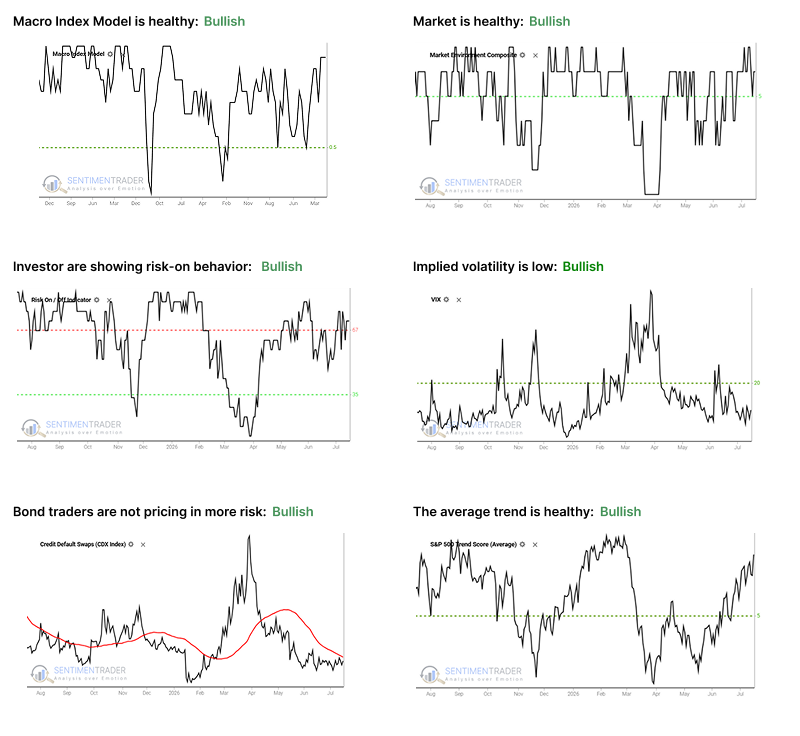
- A systematic workflow using the Aggregate Signal Model (long-term trend above 0.45 = favorable), Risk On/Risk Off Indicator (cross above 67 = intermediate bullish), and Market Environment Composite (readings above 5 = short-term favorable) navigates markets across multiple timeframes.
- A composite of micro cap, small cap, and IPO relative strength vs the S&P 500 plunged from 100 to 56 in under a month - the fast version (11 instances) shows 80%