
TradingEdge Weekly for Jul 15 - Wall Street panics, smart money buys, fundamentals plunge

Key points:
- Wall Street analysts have been busy downgrading price targets and earnings estimates
- Some smart money indicators are showing that good market timers are not heeding that advice
- Bulls would like to see a "bear killer" thrust, but it remains elusive
- Partly, that's because fundamentals continue to deteriorate, and quickly
- Economic sentiment is dropping fast, raising the probability of recession
- About the only positive for stocks is that things have been so bad that they might be good
- Gold is entering its 2nd window of seasonal tailwinds
- Corn and gas, however, are not
- The surging dollar will have a big say in whether those seasonal trends continue
Investors keep getting a chance to buy the (big) dip
Main Street has been pessimistic about stocks for a while. Now Wall Street is following in their footsteps...and in a hurry.
Over the past five days, analysts have issued a net of more than 500 price target and earnings downgrades on S&P 500 stocks. This is a rolling 5-day sum of (price target upgrades minus downgrades) + (earnings upgrades minus downgrades).
They've been downgrading stocks' prospects for months, but not to this degree, likely because of the looming earnings season. Analysts want to get out in front of what is widely assumed to be bruising earnings reports starting this week.
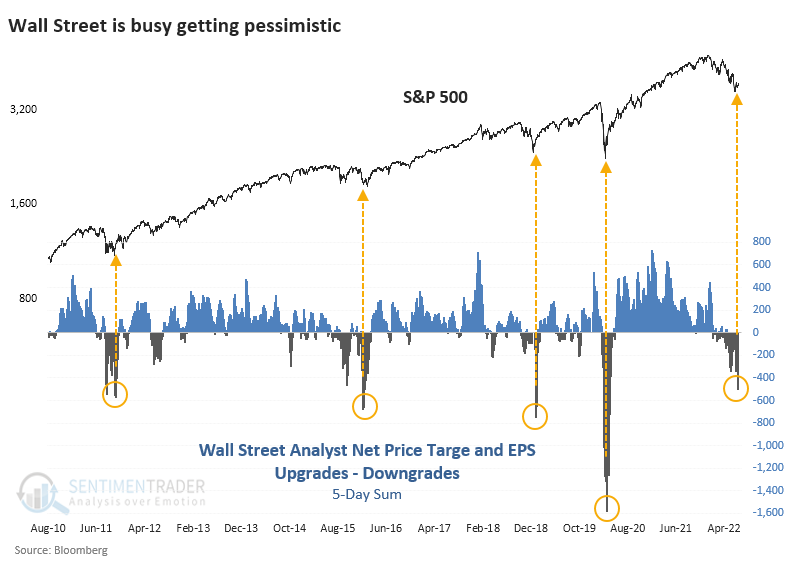
With limited data history and an extreme reading, the sample size is painfully small, which carries the usual caveats. But it's worth noting that analysts were fearing earnings misses after Q3 2011, Q4 2015, and Q4 2018, then again during the pandemic. All the fears were overstated and stocks rebounded strongly.
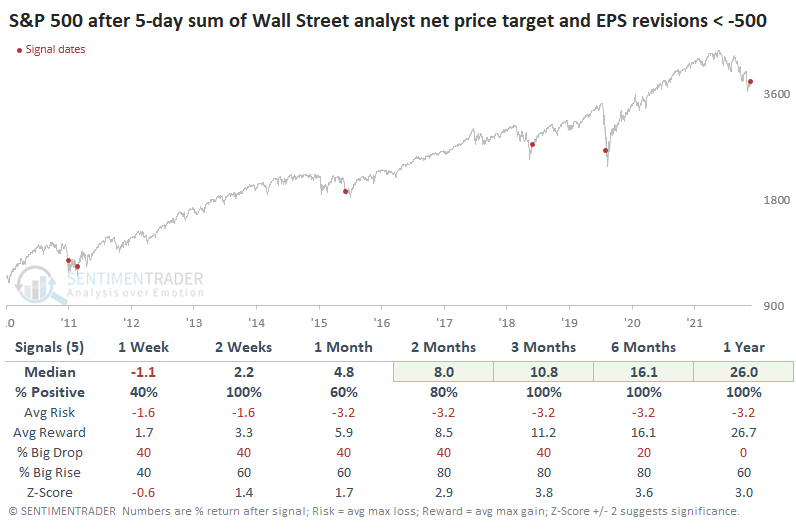
Since the downgrades have been so widespread, it would make sense to expect the equal-weight version of the index to perform well, which it did. Returns were moderately improved from the cap-weighted version of the index over the medium-term.
The smart money isn't buying their advice
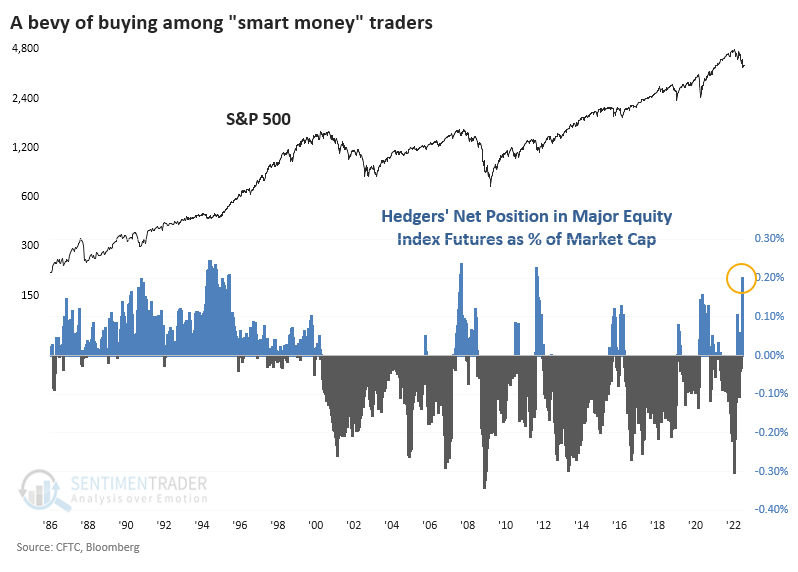
Wall Street is telling others to sell, but one group bucking their recommendations is commercial hedgers in major equity index futures. Last week, they added more to their net long position in S&P 500, Dow Industrials, Nasdaq 100, and Russell 2000 futures contracts.
It's not perfect by any stretch of the imagination and can go through periods of acting kind of screwy. But the chart below estimates the total amount of contracts held long or short by hedgers (not hedge funds), who are supposed to only be using the futures market to hedge their day-to-day business risks. It adjusts hedgers' net position in equity futures by the market capitalization of the U.S. equity market.
Another population of "smart money" participants, corporate insiders, may not be buying as aggressively as futures traders, but they're certainly not selling. A rolling 6-month sum of open market insider selling transactions among firms in the S&P 500 just hit its lowest level in a decade.
The trend of declining selling pressure and steady or rising buying interest among insiders has pushed the Buy/Sell Ratio to an extreme level. History is limited, and the market was dominated by bullish trends, but the S&P 500 rallied strongly in the months following equivalent extremes in the ratio.
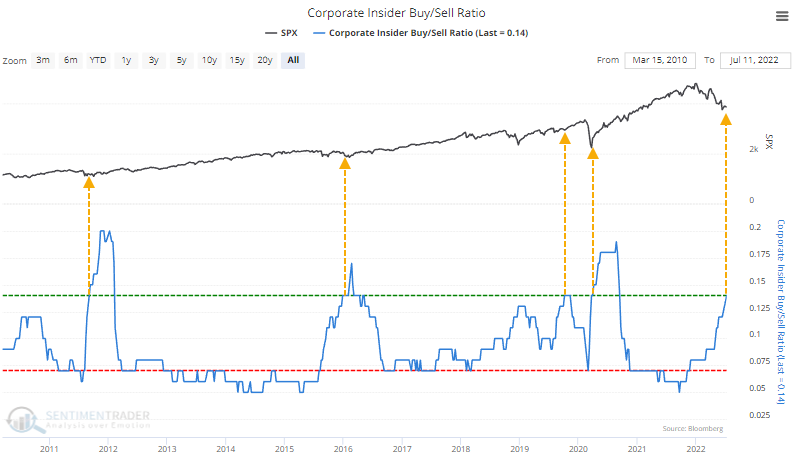
Insiders in Technology and Discretionary companies have been especially loathe to sell. The Buy/Sell Ratios for stocks in the Consumer Discretionary and Nasdaq 100 firms are climbing quickly and are at/near the highest levels since 2010.
Still waiting for a bear-killer thrust
Dean showed that many protracted bear markets have ended as buyers return in force and push more than 90% of S&P 500 stocks above their 50-day moving averages. Despite some recent mini-thrusts in breadth, we haven't yet seen anywhere near the "bear killer" level.
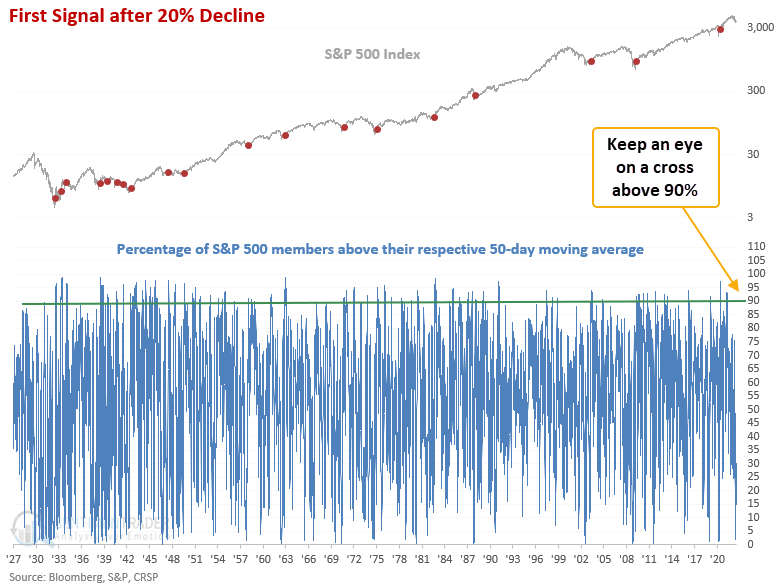
This model generated a signal 30 times over the past 90 years. After the others, future returns, win rates, and z-scores were excellent across all time frames. The 1-year outlook has maintained a perfect record since 1942. This is something we will monitor regularly if and when stocks finally see a sustained recovery.
Fundamentals remain a major headwind
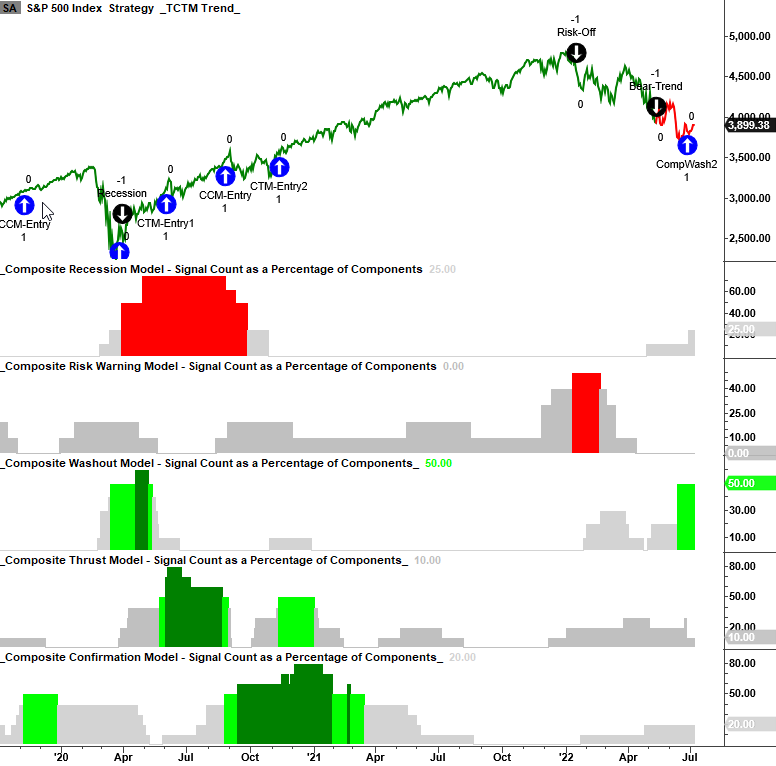
Dean updated his Tactical Composite Trend Model components and noted that the long-term trend model flipped from bullish to bearish in May. The trend change moves the overall TCTM status from cautious bull to negative.
In late June, the Composite Washout Model triggered a new alert. While the CWM has a solid record of identifying a turning point around significant lows, it cannot change the TCTM status in a bear market; it's best used as a counter-trend rally tool. While the CWM triggered a new alert, we did not see a divergence signal from the 63 & 252-day low components. Historically, markets bottom when new lows are contracting, not expanding, which is the case now. The only thing that can change the TCTM status from here on out is a long-term trend model change or a composite thrust signal.
The recession model count is inching up and is now 25%. Solid recessionary signals typically mean the market experiences a more significant drawdown.
Deteriorating economic sentiment highlights another recession risk
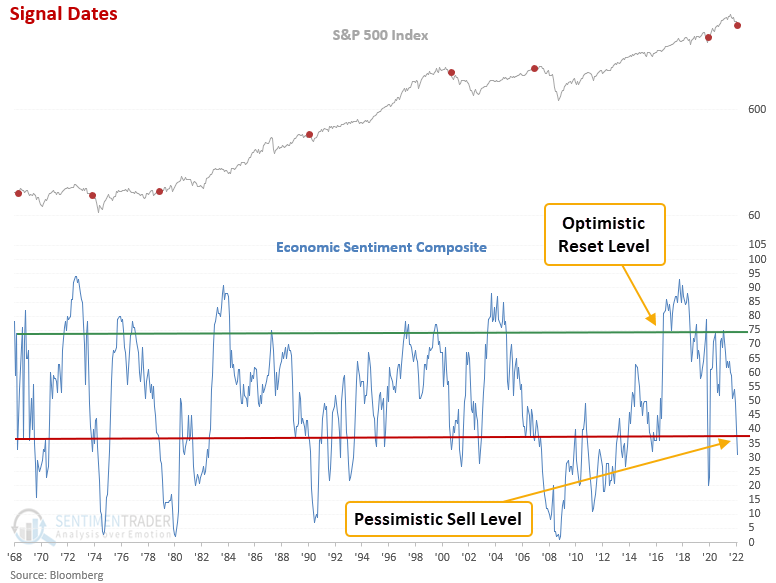
Dean noted that a composite that measures economic sentiment has reversed from an optimistic level. The contraction triggered a new composite recession model sell signal, and after similar signals, the S&P 500 shows negative returns across most time frames.
The model ranks each time series relative to all other values in history and then calculates the average of all components. 100 is the highest, and 0 is the lowest. An optimistic economic reset occurs when the average rank exceeds the 73rd percentile. A new sell signal triggers when the average level falls below the 37th percentile.
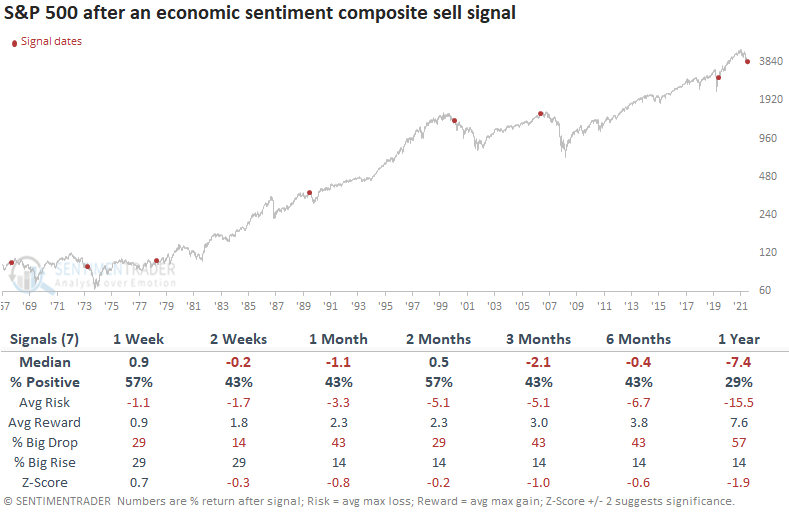
This model generated a signal 7 other times over the past 54 years. After the others, S&P 500 future returns, win rates, and risk/reward profiles were unfavorable across almost all time frames. Returns were negative at some point in the first year in 6 out of 7 instances. The one positive instance occurred after the manufactured government shutdown related to Covid.
The economic sentiment signal has triggered before or during a recession in 6 out of 8 instances since 1969. With a current reading of 31%, which is below the average level at the start of a recession, the odds are tilting more toward an economic contraction.
Maybe the only positive is that things are so bad, they're good
Even when stocks do well, they have a long way to go to get healthy.
The percentage of NYSE securities at a 52-week high minus 52-week low continues to skew negative. This is a hallmark of bear market environments.
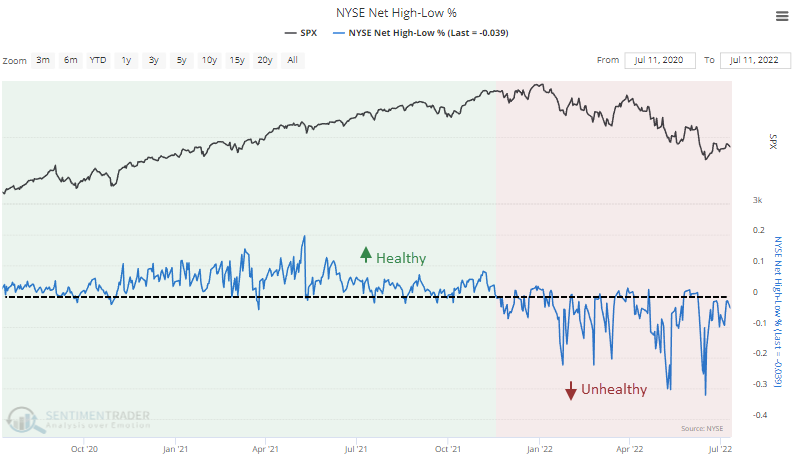
It has been over six months since there have been 5% more new highs than new lows. Our current environment ranks as the 5th-worst in 60 years when we average the high-low differential during that stretch.
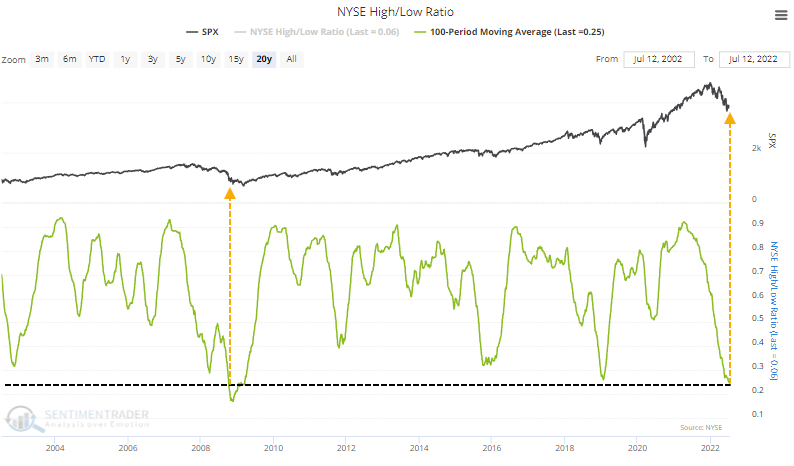
A slightly different way of looking at this data, as a ratio instead of a difference, shows that the 100-day average of the NYSE High/Low Ratio just fell to the 2nd-lowest level in 20 years.
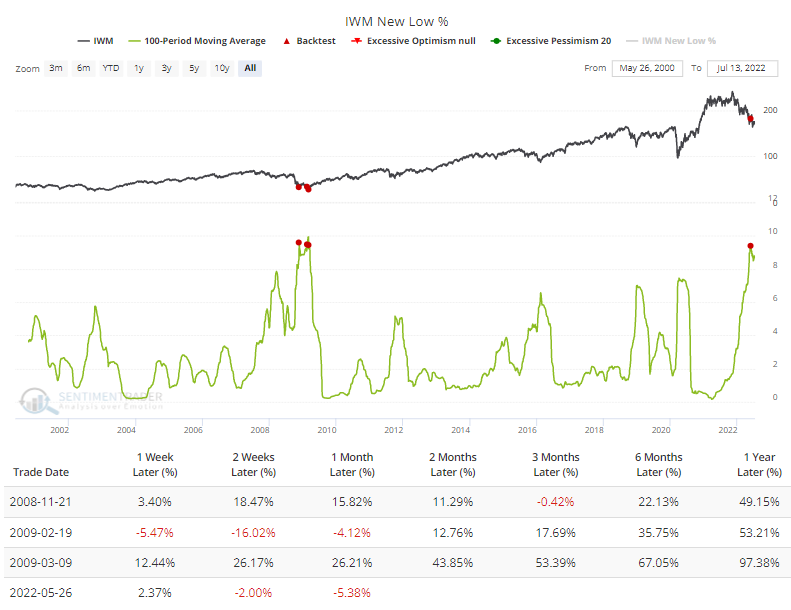
Most of the major indexes often see a divergence between when they set 52-week lows themselves and how many of their component stocks do. As the indexes suffer protracted declines, fewer and fewer stocks tend to also set new lows, setting the indexes up for an eventual rally and end to a bear market. We have not seen any evidence of that yet.
Again, about the only positive we might be able to take from this is just how bad things have been and for how long. The 100-day average of 52-week lows within the "big four" indexes are near the most extreme readings in more than 20 years, per the Backtest Engine. It's been especially bad for small-cap stocks.
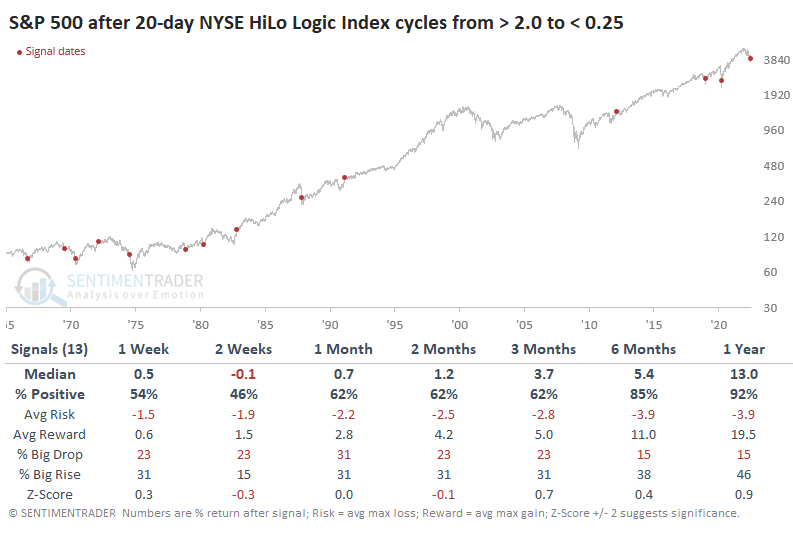
A few months ago, we had concerns about stocks because the market was extremely split. There were a lot of securities hitting 52-week highs while others were falling to 52-week lows. That kind of behavior has been a consistently negative sign over the decades.
It has been resolved over the past month, and the NYSE HiLo Logic Index has plunged. A drop in the ratio can occur because either buyers return and push many stocks to new highs, or sellers emerge and push them to new lows.
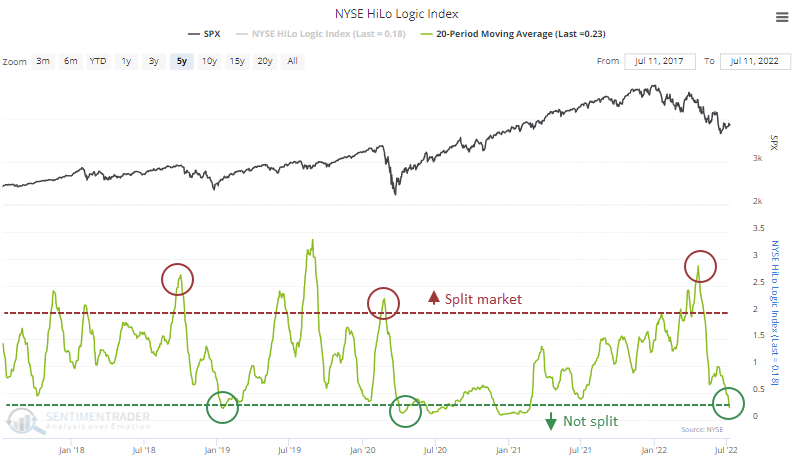
The table below shows other times when the HiLo Logic Index cycled from above 2.5 to below 0.25. These are times when the market was extremely split between those at new highs and new lows, then became un-split. It didn't matter whether the un-split was due to a dominance of new highs or new lows, just that one side dominated.
A year after these cycles, the S&P 500 showed a positive return after 12 out of 13 signals.
Gold is entering a seasonally positive period
There are two periods during the calendar year that tend to favor gold. Jay noted that one occurs between mid-summer and early fall; the other happens near year-end into the new year. The remaining time of year has seen gold register a net loss in value.
The chart below displays the annual seasonal trend for gold futures. The green boxes highlight the seasonally favorable periods, while the red boxes highlight the seasonally unfavorable ones.
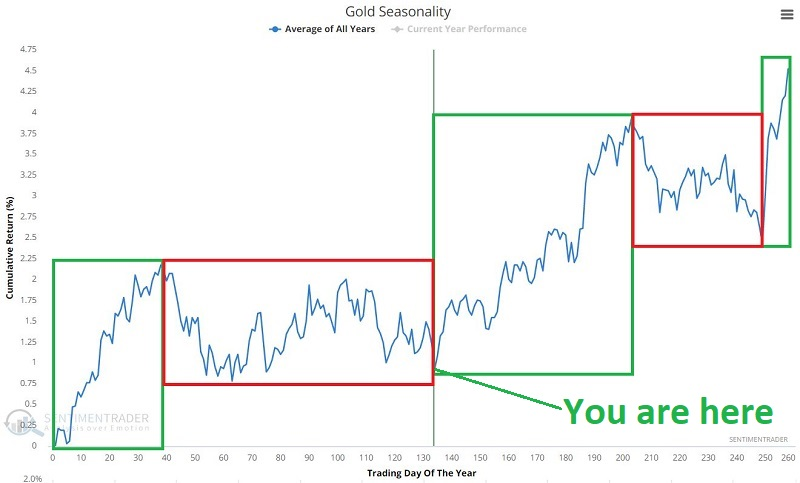
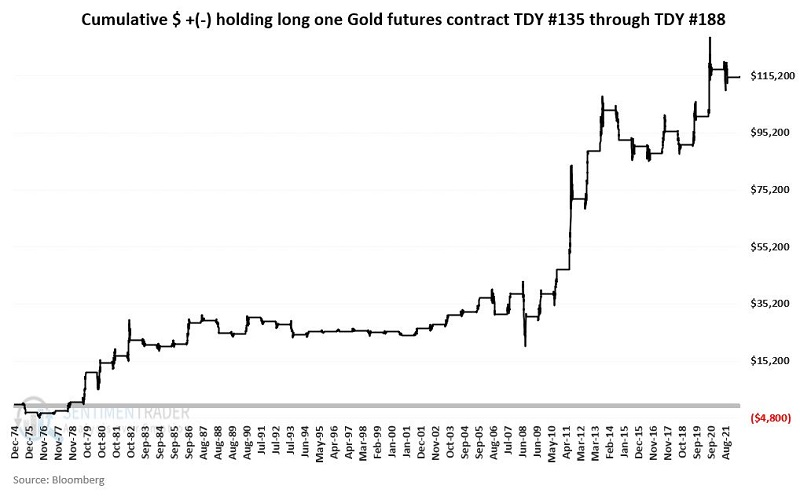
The second favorable period begins at the close of Trading Day of Year (TDY) #134 and extends through TDY #188. The chart below displays the cumulative hypothetical gain from holding a long position in gold futures only during this period every year starting 12/31/1974. Through 7/8/2022, the cumulative hypothetical gain was $114,630.
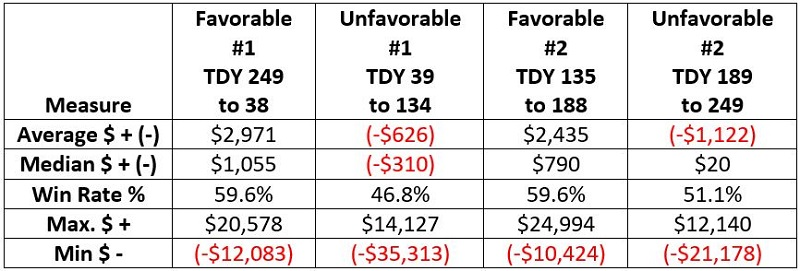
The table below summarizes gold performance during each favorable and unfavorable period.
Corn, however, is not
Jay also showed that corn enjoyed a terrific run from 2020 into 2022, rallying from $3 to $8 a bushel. A recent -11% decline has traders wondering what will come next. Seasonality and sentiment are presently arguing that more weakness is in store in the months ahead.
The chart below displays the annual seasonal trend for corn futures. The implication of the red box is pretty apparent.
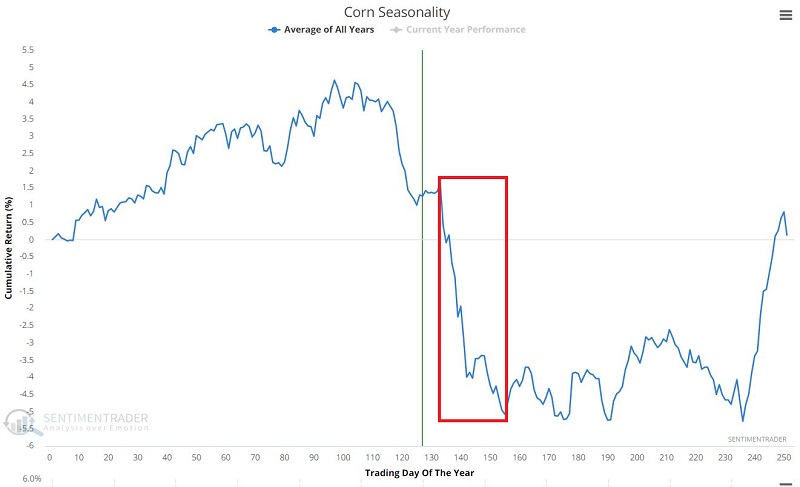
The unfavorable seasonal period for corn extends from the close on 7/15/2022 through the close on 8/16/2022.
It is not surprising to learn that trader sentiment towards corn turned very bullish during the run-up in early to mid-2022 and is starting to roll over. The chart below displays those times when the 100-day moving average for our corn Optimism Index dropped below 72.
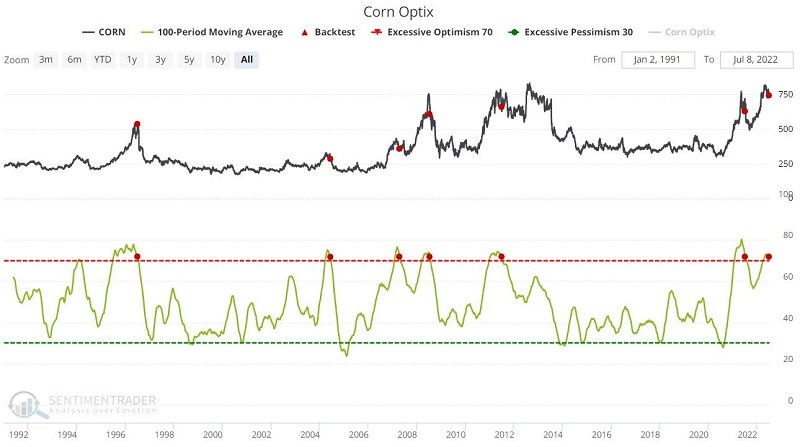
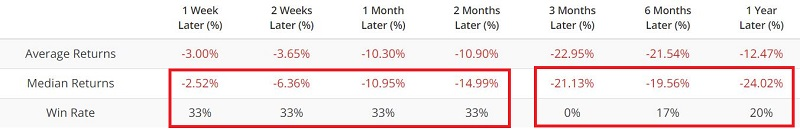
The latest signal occurred on 7/6/2022. Over the next few months, corn prices declined every time. Jay also showed a trading system combining seasonality and sentiment, and that model is now in its most negative position.
Some relief at the pump
Inflation and geopolitics may keep gasoline prices elevated but Jay noted that gasoline prices have demonstrated a clear tendency to rise during the first part of the year and to decline during the second half.
The chart below displays the annual seasonal trend for Unleaded Gas futures.
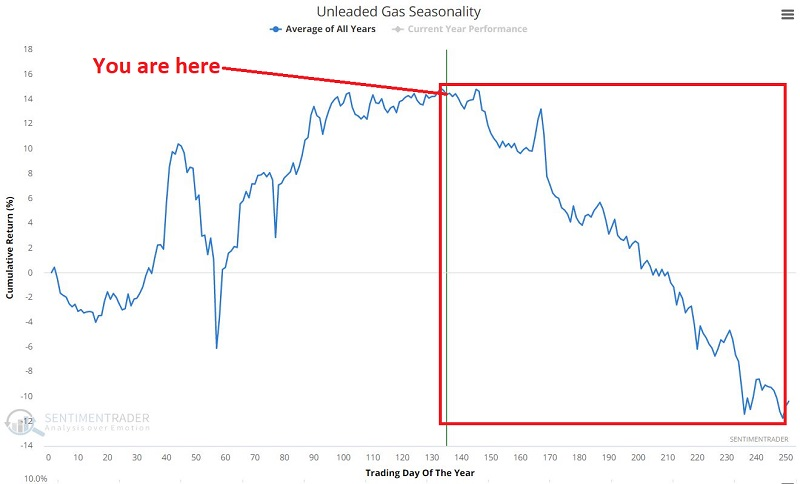
The bearish period begins after the 2nd Monday of July and lasts 24 weeks. The table below summarizes gasoline price performance during these bearish seasonal periods.
Another negative factor has been (and remains) the term structure of crude oil futures, which shows the relationship of the near-term futures contract to a further-out contract. If it is above 1.0, the near-term contract is priced higher than the further-out contract, called backwardation. Readings above 1.2 are rare and typically highlight panic-buying in the near-term crude oil contract - a bearish contrarian signal for the price of a barrel of crude oil. That triggered in March and it remains extremely high.
Those commodity trends will be heavily influenced by the surging dollar
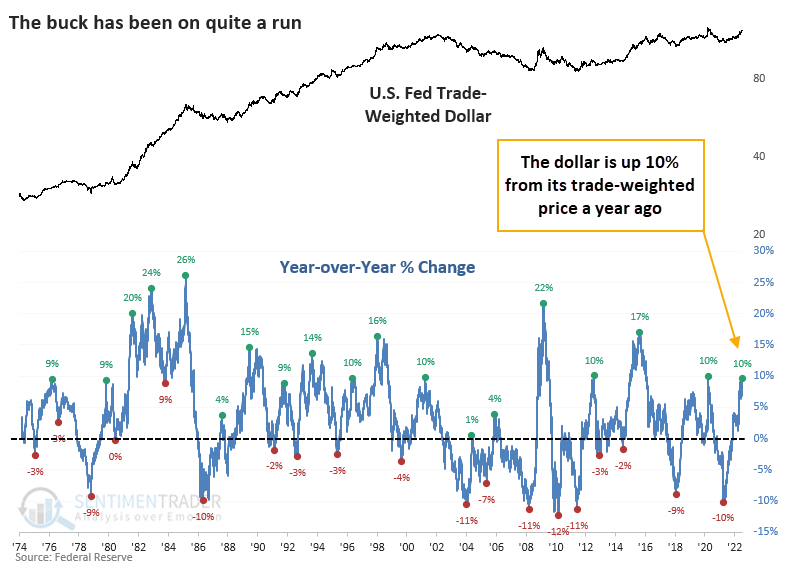
Bloomberg recently noted that the incessant rise in the U.S. dollar is likely weighing on investor sentiment.
We'll have to see how investors absorb the latest inflation readings in the days ahead. Regardless, there is no question that the dollar has been a focus, and there is no mistaking its trend. The U.S. Dollar Index is soaring, and even a trade-weighted version calculated by the Federal Reserve is now up 10% from a year ago.
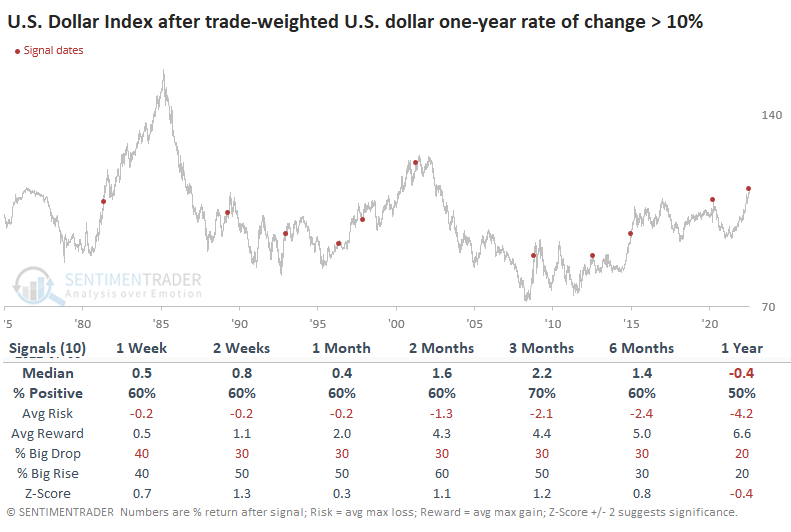
Despite assertions to the contrary, a 10% year-over-year rise in the dollar hasn't necessarily put the brakes on the stock market. Three months later, the S&P rose after 9 out of 10 signals, with a good average return and risk/reward ratio.
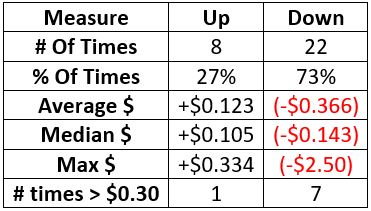
For the (trade-weighted) dollar itself, it was a mixed signal but mostly positive. Most of us are more familiar with the U.S. Dollar Index, which has had even more of a rally. This index (much) more heavily weights the euro and yen, about double what the Fed trade-weighted version does. This index showed worse returns after the trade-weighted version rallied 10% from year-ago levels.
There is a decent inverse correlation between the dollar and gold, so before the past 20 years or so, gold suffered tremendously even after the dollar rallied more than 10%. But since then, the metal has managed to gain, often significantly. Commodities, in general, were more consistently poor stores of value. Over the next 2-6 months, the Bloomberg Commodity Index suffered losses almost without exception.
About TradingEdge Weekly...
The goal of TradingEdge Weekly is to summarize the research published to SentimenTrader over the past week. Sometimes there is a lot to digest and this summary is meant to highlight the highest conviction or most compelling ideas we discussed. This is NOT the full research that's published, rather it pulls out some of the most relevant parts. It includes links to the published research for convenience; if you don't subscribe to those products it will present the options for access.