
TradingEdge Weekly for Jul 12 - Winning indexes, lagging stocks, volatility in election years

Key points:
- This market is suffering from Oppositional Defiant Disorder
- Underlying participation has been weak to an almost record degree
- Even so, the indexes keep on winning
- Due to excellent index returns, ome surveys are showing historically high investor optimism
- Small speculators have never been more exposed to stocks
- The VIX got knocked down and has stayed there
- Some detail about implied volatility patterns during election years
- The copper/gold ratio is low
- Soybeans are already weak and now face a tough seasonal window
An ODD market
We're in a bizarro world. Look one way, and investments are doing one thing. Look another way, and they're doing the exact opposite.
The folks at Bespoke noted a wrinkle about the bad breadth we've seen on many days. Fewer stocks have been rising along with the index, and when the index declines, we often see more stocks advancing than usual.
Anyone with a family member with Oppositional Defiant Disorder (ODD) can relate. It's maddening behavior, and we've never seen it like this. To the greatest degree in history (by far), stocks within the S&P 500 are defiant against whatever the index is doing.
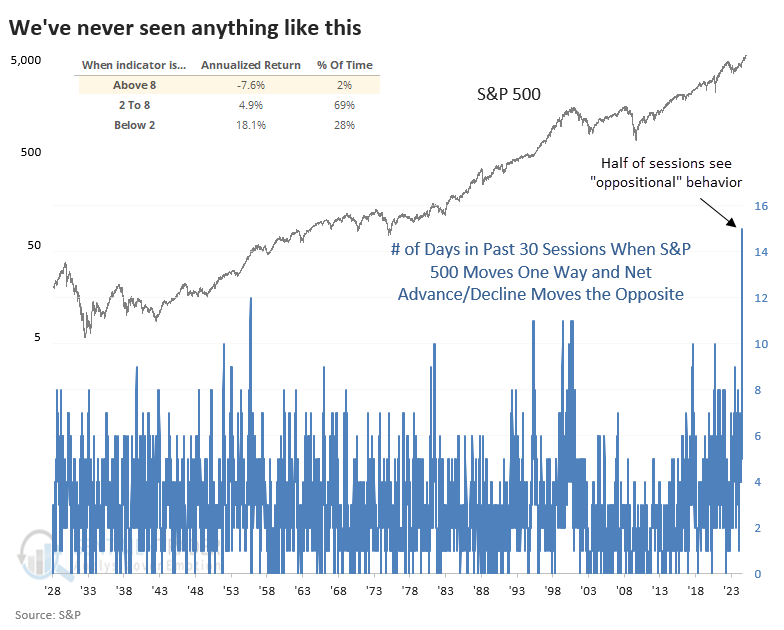
The inset table on the chart shows that when the market suffered ODD, the S&P's annualized return was a woeful -7.6%.
This was not a good sign for the index most of the time. Again, however, this started triggering a few weeks ago, and it's still triggering, and it's still not mattering. In 2017, this didn't matter, either...until it did, and all the gains were given back. In 1995, it simply didn't matter and never did until the blow-off four years later.
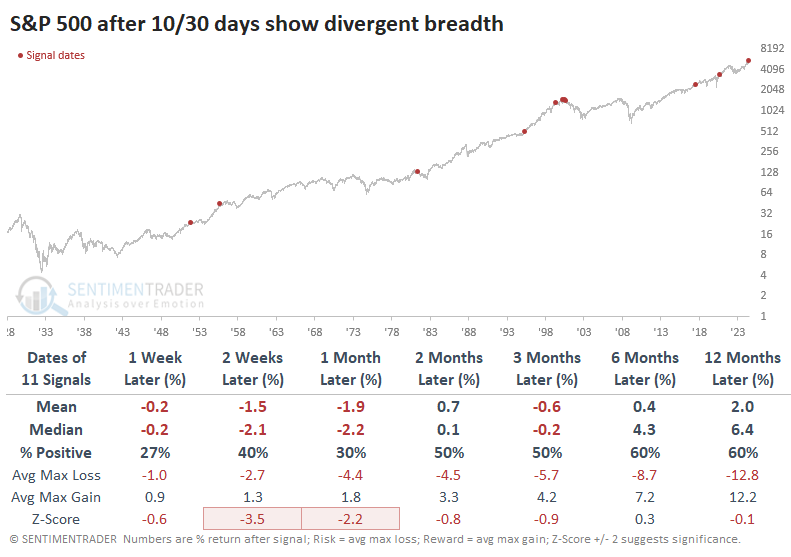
An equal-weight version of the S&P 500 since 1957 showed modestly better returns than the cap-weight version shown above. It seems notable that there were clusters of these signals around the low in the ratio in 2000 and 2020. The fact that we have a historic cluster of them now gives some weight to the index that the equal-weight version might start finally outperforming again.
A really, really internally weak rally
Participation on the NYSE has been so weak that the maximum McClellan Oscillator reading over the prior 28 days had barely been positive before a little jolt later in the week. These persistently weak readings pushed the Summation Index lower, to around 100. That's about the same level it was at in April when the S&P was about 500 points lower.
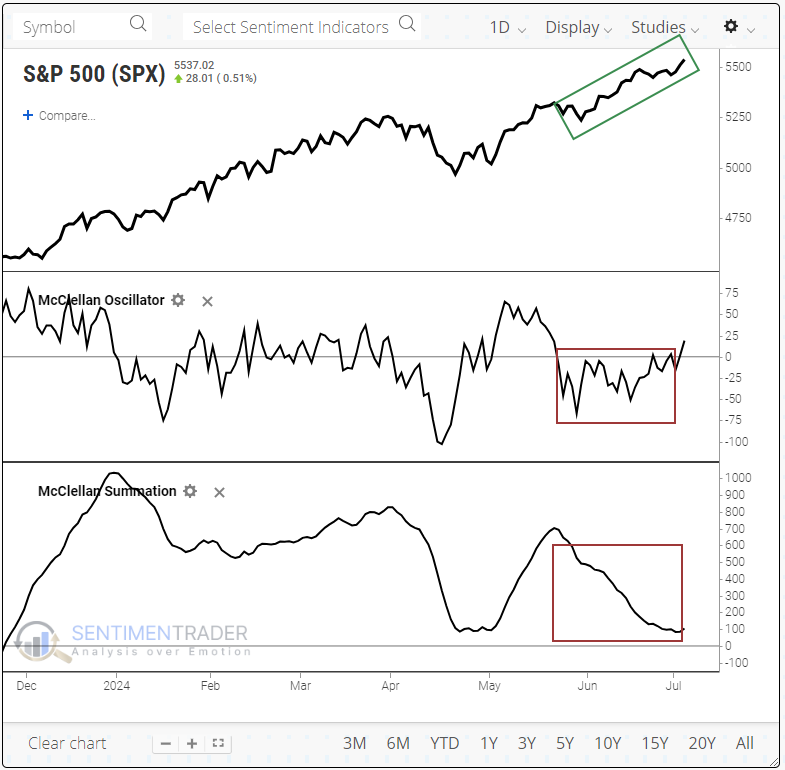
On July 26, 2021, a similar structure played out. The S&P 500 didn't peak immediately, but it struggled to hold its gains before suffering a mild pullback, another thrust to new highs, and then the bear market. The only other precedent since 1962 was on December 21, 1999. The S&P's future path looked somewhat similar - a brief rally, a pullback, another thrust to new highs, and then the bear market.
It's hard to rely on a sample size of two, but the readings are so unbelievably weak that even if we relax the parameters, it's hard to find many precedents. When we do, we still find relatively weak results over the next couple of months. 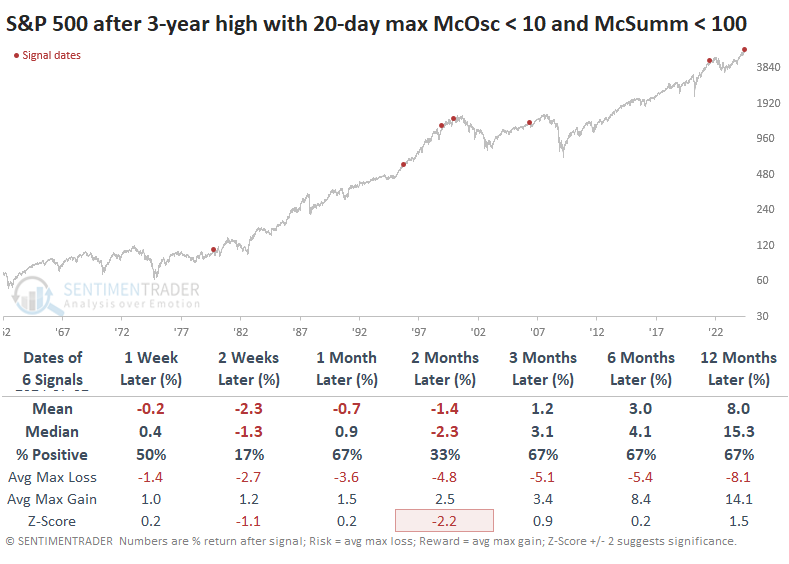
A similar pattern is playing out on the Nasdaq exchange, which we've noted for over a month has been especially troublesome. Over there, the McClellan Summation Index is not only tepid but deeply negative - the kind of reading commonly seen after deep pullbacks or corrections. Again, 2021 stands out as having a similar structure.
The only other times the stocks behaved this way over the past 30 years were in 1998 and 1999.
The indexes keep winning
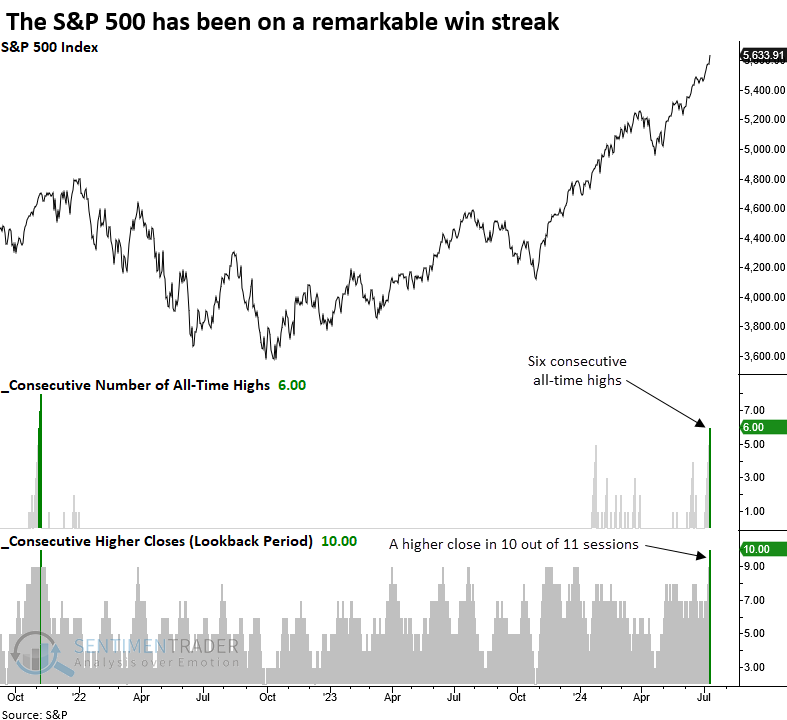
Despite what had been poor participation under the surface, Dean noted that the S&P 500 and the Nasdaq Composite have notched multiple record highs and impressive win streaks.
The S&P 500 has registered gains in 10 of the past 11 trading sessions, reaching an all-time high for six consecutive days through the close on Wednesday, a rare occurrence achieved only 12 other times in history.
If you're familiar with market history, you'll know that stock indexes seldom reach a long-term peak when price momentum is positive, as it is currently. However, in the near term, it can represent buyer's fatigue, leading to a pause that rejuvenates the bullish trend.
Following similar win streaks, the world's most benchmarked index tended to show signs of exhaustion in the near term. Over the next month, the index declined 67% of the time, with the median maximum loss exceeding the maximum gain. Still, a year later, the S&P 500 was higher in 75% of the precedents, suggesting a buyer's exhaustion pause that refreshed a bullish trend.
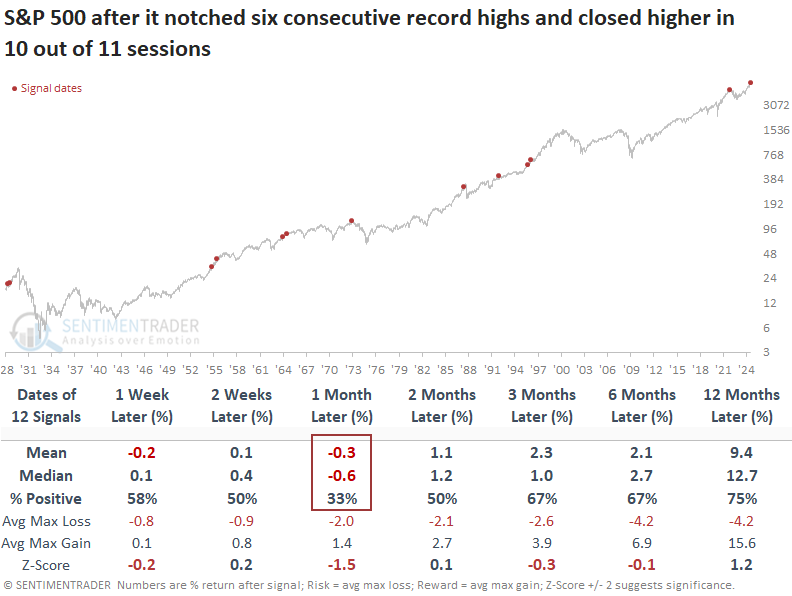
Over the subsequent two months, the S&P 500 experienced just one maximum loss exceeding -5%, which occurred in 1928. Whether the Fed can engineer a soft landing remains to be seen. If you're in that camp, the win streak precedents in 1995 and 1996 produced consolidations within an overall bullish trend.
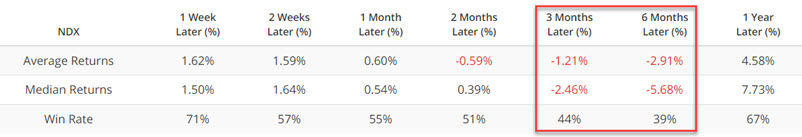
Not to be outdone, the Nasdaq Composite recorded seven straight all-time highs as it closed up in 10 out of 11 sessions.
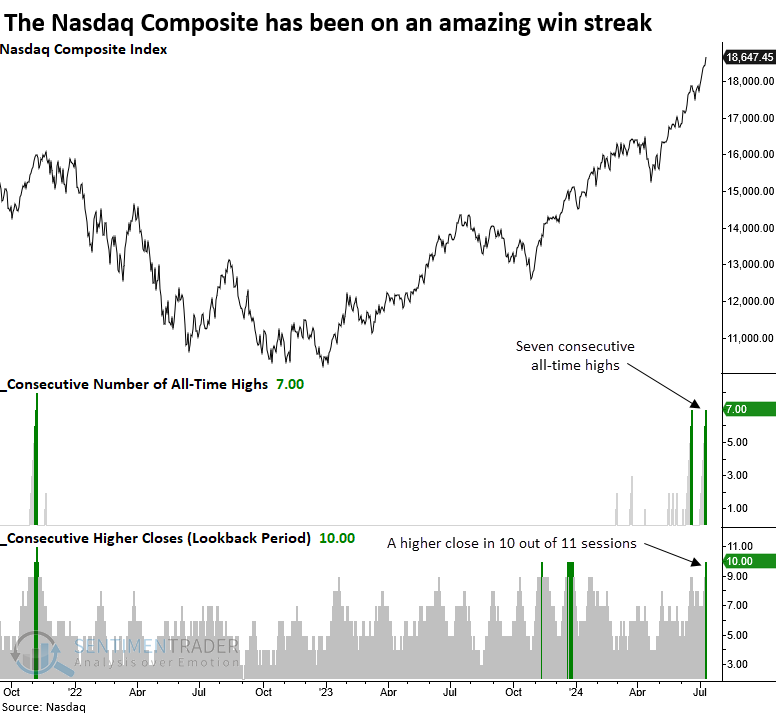
Following similar win streaks for the Nasdaq Composite, the favorable price momentum tended to persist over the next month, with the index rising 82% of the time. However, the upward trajectory waned three months later, with a negative median return and a less-than-coin-toss win rate.
Investors are even more bullish
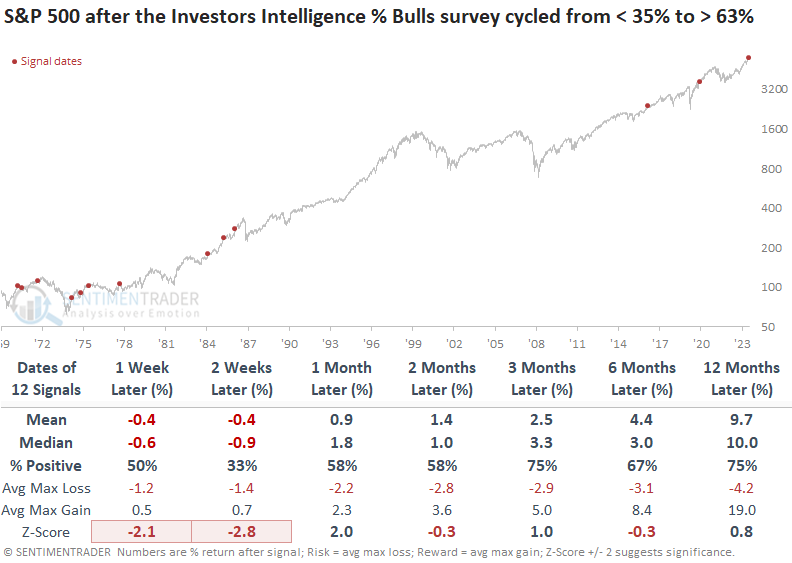
Despite relatively poor participation by the average stock, Dean noted that the percentage of bulls in the Investors Intelligence sentiment survey increased above 63%. Similar periods with a high level of bulls preceded a multi-week pullback/consolidation for the S&P 500.
For the first time since the bear market low in 2022, the percentage of survey members with a bullish outlook increased above 63%, a level obtained only 3% of the time since 1971. Readings above 63% produced annualized returns of 2.7%, far less than those below that level and the 7.9% annualized return (price-only) for the S&P 500 since 1971.
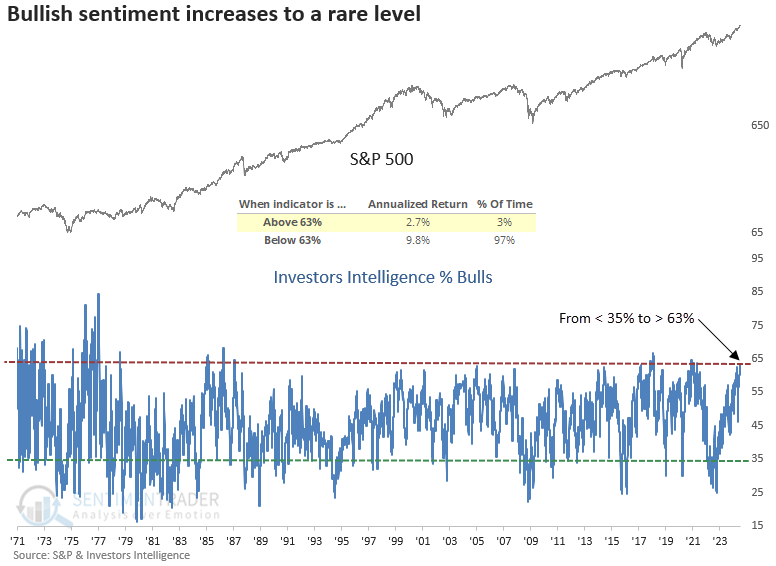
Whenever bullish sentiment cycled from below 35% to above 63%, the S&P 500 tended to struggle in the ensuing two weeks, posting a win rate of only 33%.
After the setback, stocks rebounded over the next three months, gaining 75% of the time with a median increase of 3.3%. During this period, the world's most benchmarked index experienced only one significant loss of over -10%, which happened in 1978.
A composite that contains sentiment indicators from Investors Intelligence, the American Association of Individual Investors, the National Association of Active Managers, Consensus Inc., and the CBOE currently resides at 81%, a level exhibited in only 8% of instances since 1983.
When the composite surpasses 81%, the S&P 500 displays an annualized return of 3.8%, less than half the index's annualized return since 1983.
Small speculators are carrying record exposure
Jay noted several breadth and sentiment indicators are currently flashing yellow - however, historically, these warnings tend to be early.
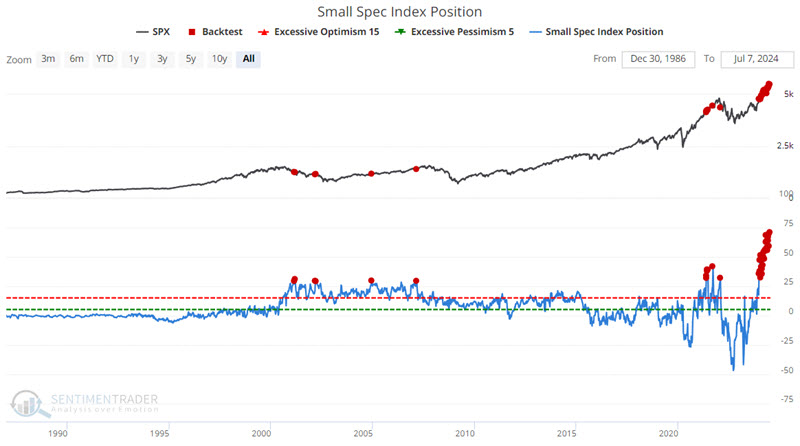
This indicator below shows the net position of small (nonreportable) traders in S&P 500, Nasdaq 100, and DJIA index futures, full contract, and e-mini, adjusted for position size and index value, shown in billions of dollars.
Small speculators (typically the group that is most wrong at turning points) are betting more heavily than ever on a continued bull market. Interestingly, they have tended to be right in the past - but only for a while. And then things typically turned decidedly south.
The chart below displays when the indicator value was above $29 billion.
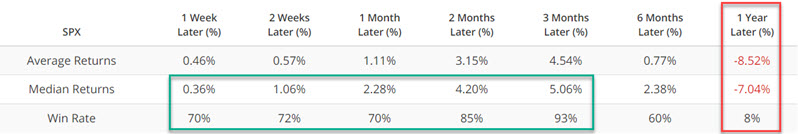
Three months following a signal, median returns and Win Rates are solid. But then 1 Year returns have been decidedly unfavorable, with just an 8% Win Rate and a median return of -7.04%.
Jay also pointed out that the Hindenburg Omen and Titanic Syndrome for the Nasdaq are also sending warning signals
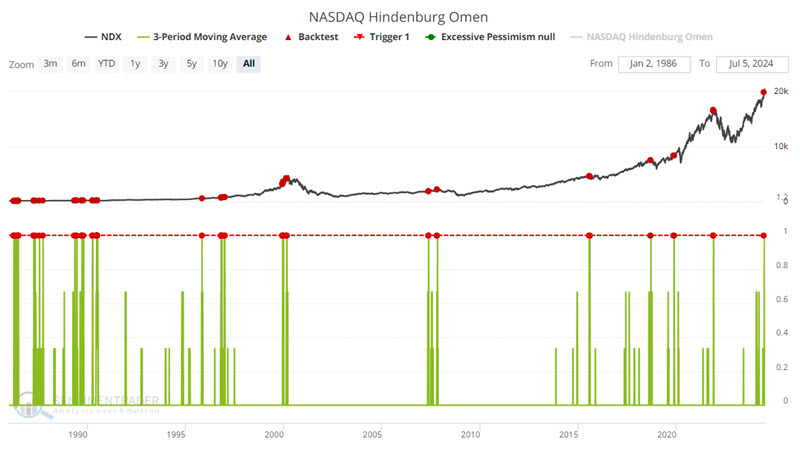
Three and six-month returns show negative average and median results with Win Rates under 50%. Combined with other recent signals, it appears to be part of a definite (potentially unfavorable) pattern.
No sudden movement
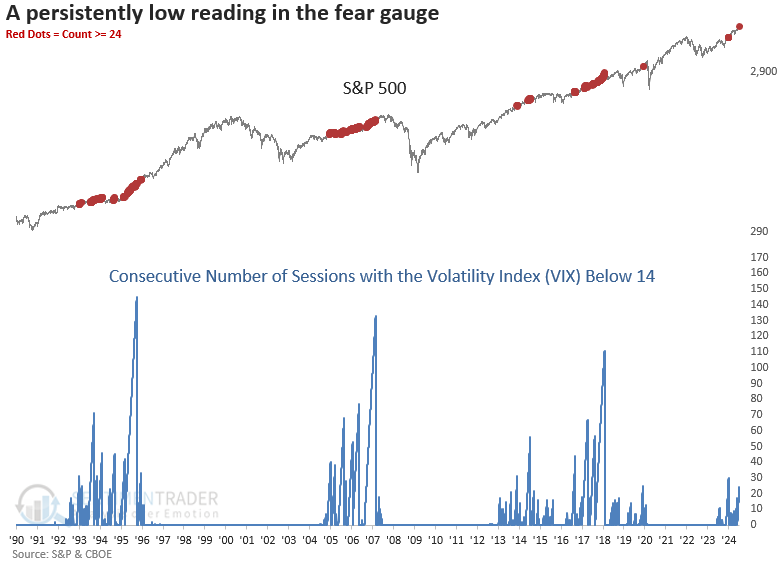
The CBOE Volatility Index (VIX) closed below 14 for 24 consecutive trading sessions. Dean showed that the VIX tended to rise following similar patterns, and seasonality is about to turn unfavorable.
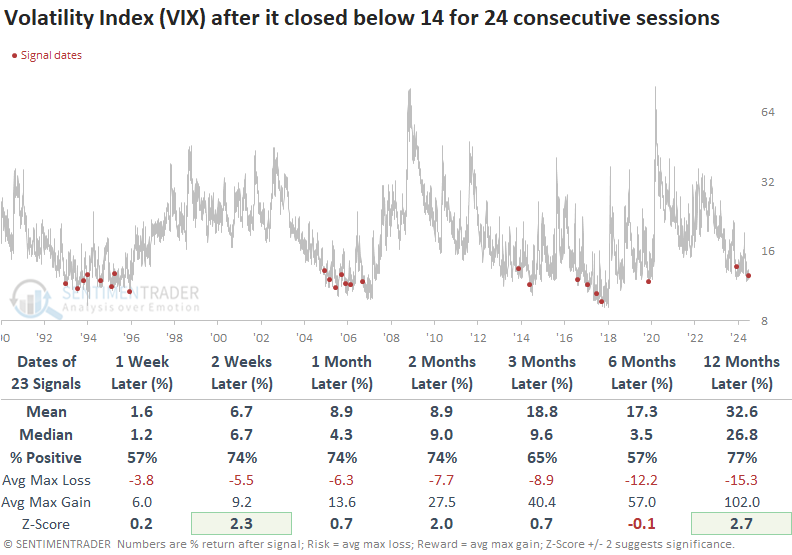
Over the last 24 trading sessions, the Volatility Index (VIX) has closed below 14 on consecutive days, a rare occurrence that has only happened 23 other times in history. The previous instance occurred in December 2023, which resulted in a 15% gain in the S&P 500 over the subsequent six months.
Whenever the Volatility Index (VIX) closed below 14 for 24 consecutive sessions, the world's most benchmarked index displayed excellent returns and consistency over the following year. Technology was the clear beneficiary of a low-volatility environment.
The VIX also showed a consistent upward bias over the subsequent year. This pattern was also observed during low-volatility periods like 1995, 2013, and 2017, which resemble the current backdrop.
Similar to stocks, the Volatility Index (VIX) follows a seasonal pattern, with expected volatility often hitting a low in mid-July and climbing through early October.
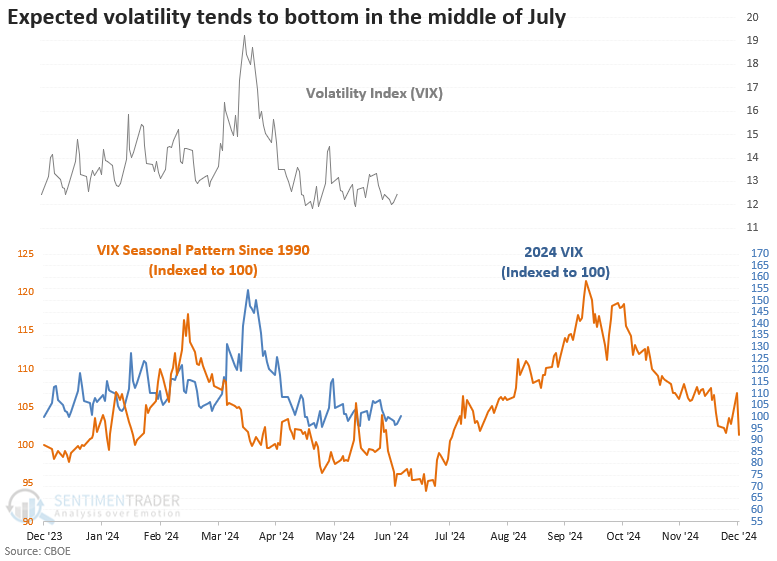
During presential election years, the Volatility Index (VIX) tended to bottom in the third week of August and rose until about a week before the election.
More on VIX seasonality
Jay noted that the CBOE Volatility Index (VIX) has demonstrated a very persistent pattern during presidential election years.
For our testing, we will look at the raw point change in the VIX Index for each month - or period of months - under consideration. We will start by looking at March through August of election years. We will measure the net point change in the VIX index from the close on the last trading day of February through the close on the last trading day of August.
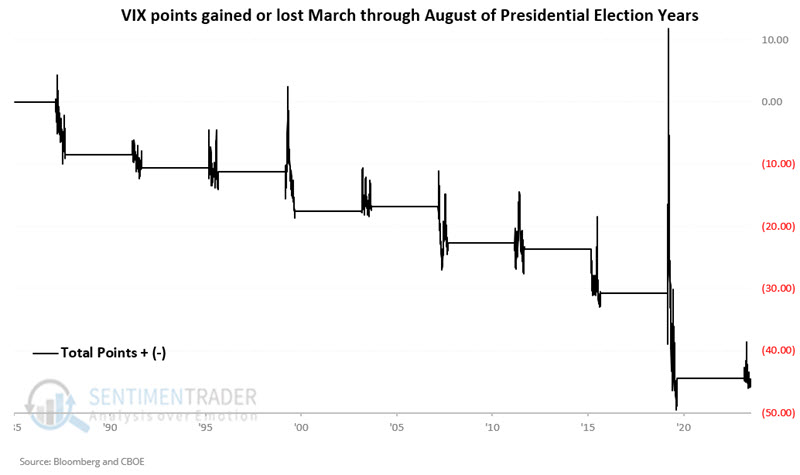
This period showed a slight increase of 0.77 points in 2004. Likewise, there was the COVID panic-induced spike in March 2020). During all other presidential election years, the VIX declined from the end of February through the end of August.
Now, we will measure the net point change in the VIX index from the close on the last trading day of August through the close on the last trading day of October.
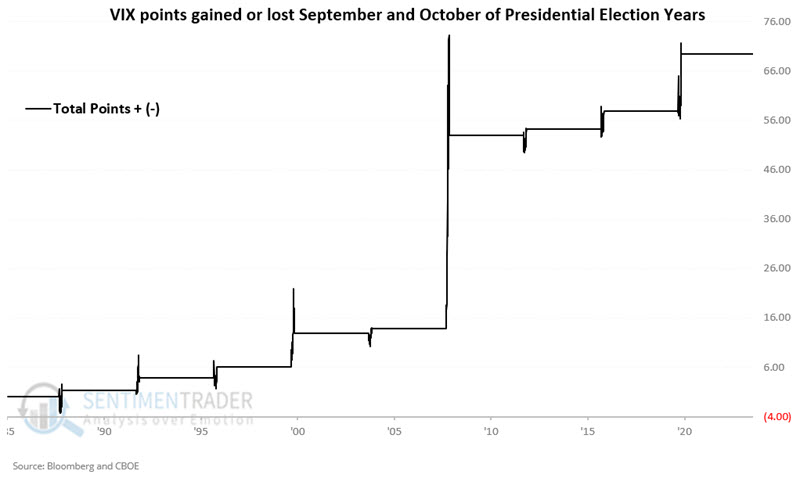
Starting in 1988, all nine "September/October of election year" periods have seen VIX increase. We would anticipate this to equate to subpar stock market performance overall but that pattern was inconsistent.
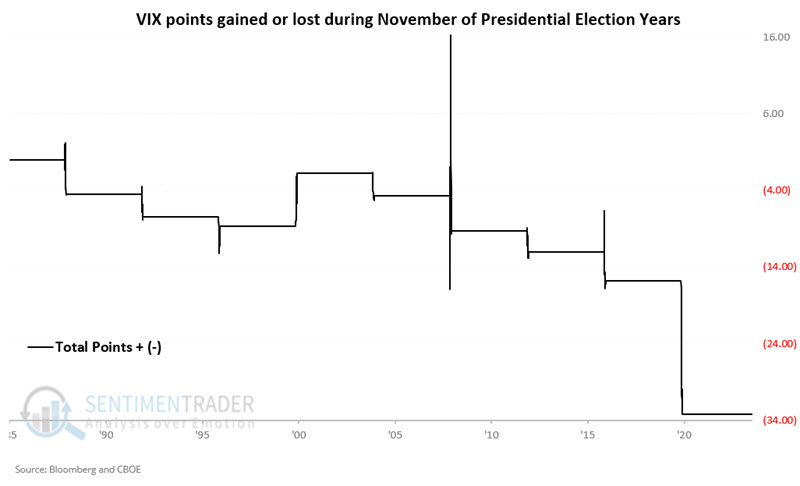
From the close on the last trading day of October through the close on the last trading day of November, the VIX showed a modest tendency to decline.
Copper vs gold
The Copper/Gold Ratio has been nearer to the low end of its historical range. Jay showed this has signaled potential opportunities in the financial sector and copper itself.
One indicator that creates some optimism for the bullish case for financials is the Copper/Gold Ratio. The chart below highlights XLF and all days when the Copper/Gold Ratio was below 0.20. The ratio has been below 0.20 continuously since 2024-04-23.
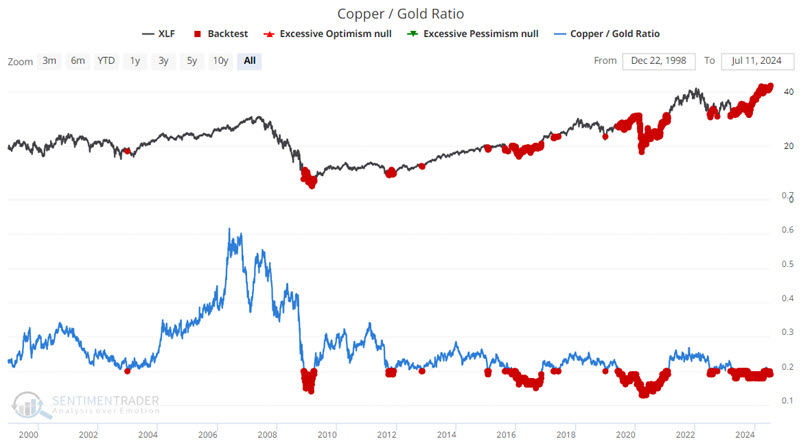
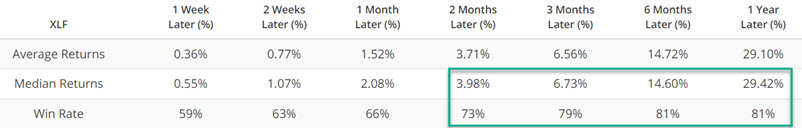
Six and twelve-month Win Rates are solid at 81%, and Median Returns are exceptional at 14.60% and 29.42%, respectively.
The other market that the Copper/Gold Ratio gives the benefit of the doubt to is copper itself. Once again, we cannot predict which way copper will run from here. But we can note the current state of the Copper/Gold Ratio and how copper futures have reacted in the past.
The chart below highlights all days when the Copper/Gold Ratio crossed above 0.19. The most recent signal occurred on 2024-07-03.
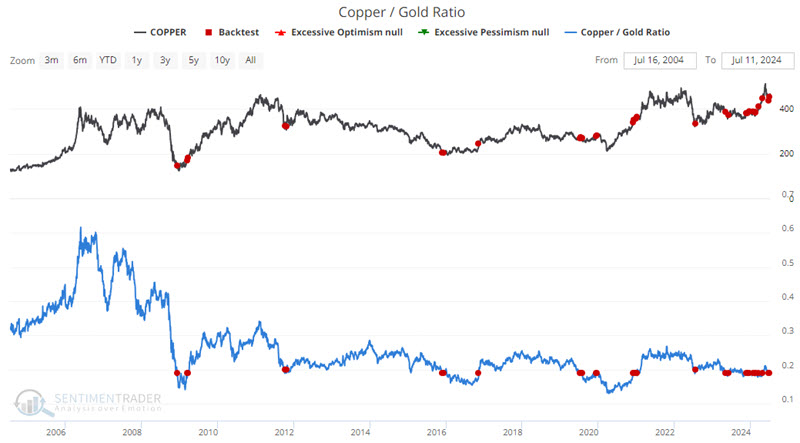
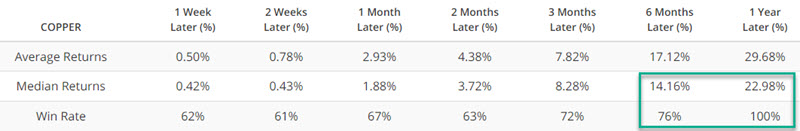
The twelve-month Win Rate of 100% does not guarantee that copper futures will be higher by July 2025 than they are today. But it does lend the weight of the evidence to the favorable side of the ledger and argues for continuing to give the bullish case the benefit of the doubt as long as price action does not fall apart.
Soybean seasonality
Soybean prices have been exceptionally weak for almost a year, and Jay showed that they are just now entering the weakest seasonal period of the year.
As the chart below shows, bean prices have bucked the usually favorable tendency they typically experience during the year's first half.
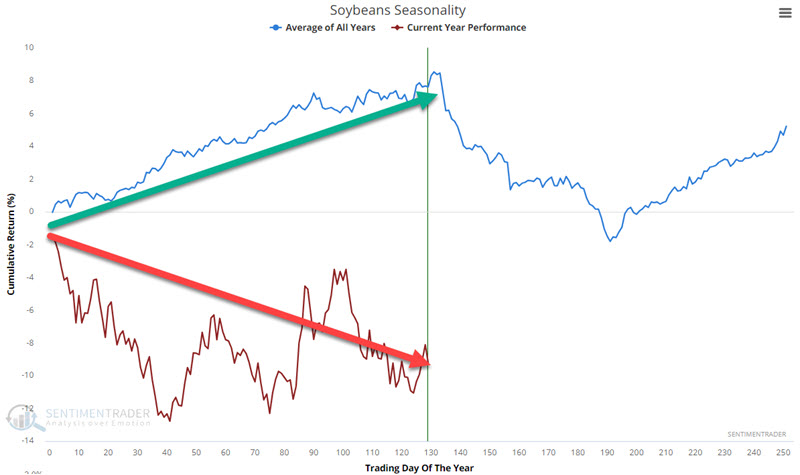
A different look at the same chart highlights that July, August, and September are typically the weakest months of the year for beans.
Specifically, the weakest seasonal time of year for beans extends from the close on Trading Day of the Year (TDY) #131 through the close of TDY #191. For 2024, this period extends from the close on 2024-07-10 through 2024-10-03.
The chart below displays the hypothetical dollar +(-) from holding long one soybean futures contract only during this period every year since 1937.
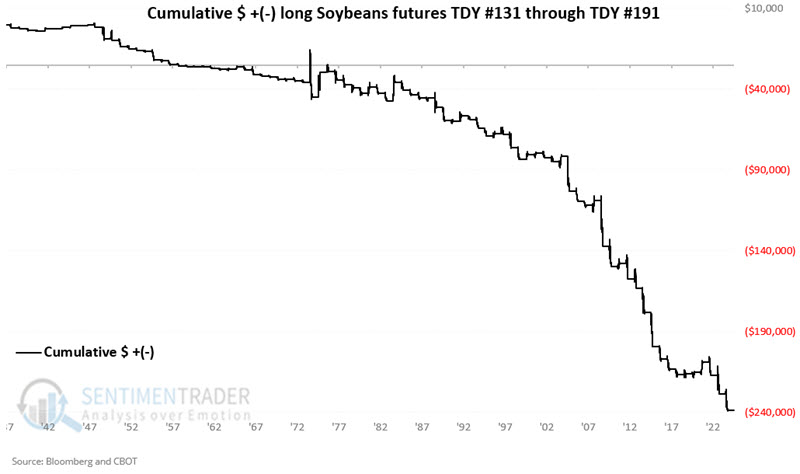
The equity curve chart shown above displaying soybean futures performance during July, August, and September resembles a waterfall and creates the illusion that a decline is practically a sure thing. About 26% of the time, beans bucked the seasonal bias and rallied, but playing the long side of soybeans in the months ahead would involve flying in the face of a persistent seasonal tendency.
About TradingEdge Weekly...
The goal of TradingEdge Weekly is to summarize some of the research published to SentimenTrader over the past week. Sometimes there is a lot to digest, and this summary highlights the highest conviction or most compelling ideas we discussed. This is NOT the published research; rather, it pulls out some of the most relevant parts. It includes links to the published research for convenience, and if you don't subscribe to those products, it will present the options for access.