
TradingEdge Weekly for Jan 27 - Falling volatility, soaring global markets, isolated breakouts

Key points:
- Implied volatility across major assets has melted from the October panic
- Global stock markets are recovering, triggering an impressive buy signal
- Other countries' trends relative to the U.S. are also improving
- Japanese stocks have enjoyed a notable breakout
- As well as stocks have done since October, gold has done better
- The bond market is accommodating, too, as credit spreads continue to narrow
- Semiconductor stocks have broken out, with relative trends and equal-weighted indexes confirming
- Gold miners have recovered along with gold but have trouble holding upside momentum
- Crude oil is breaking out, which has been good for Energy stocks
- Unleaded gas and copper are enjoying a seasonal tailwind, while the pound and euro are facing headwinds
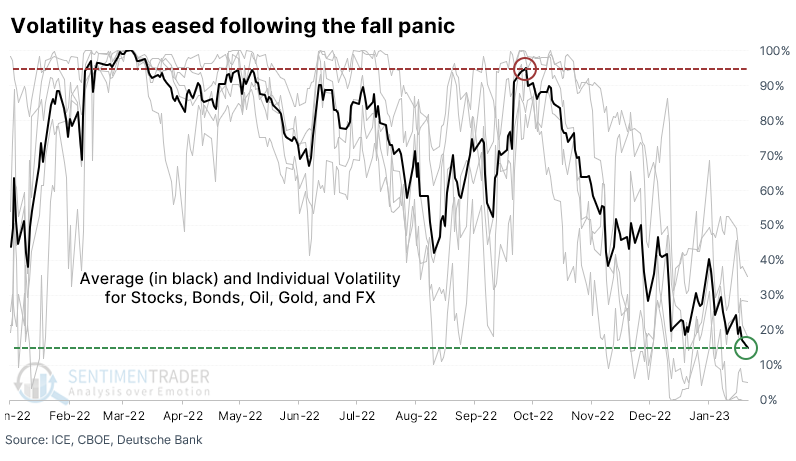
Volatility across assets is settling down
Last October, we saw that volatility was spiking everywhere. Panic spread from stocks to bonds to foreign currencies to commodities to even supposed safe havens.
Investors have since calmed down, and volatility across asset classes has dropped significantly. Thanks to broad rallies in November and so far in January, the average implied volatility across assets has plunged to within 15% of its one-year low.
The table below shows every time since 1990 when average cross-asset implied volatility cycled from the top 5% of its range to the bottom 15%. It was a decent sign for medium-term returns, as investors welcomed the easing of their worst fears. It was a false dawn in 2002, as stocks still had another leg lower, but that was the only significant loss over the next two months.
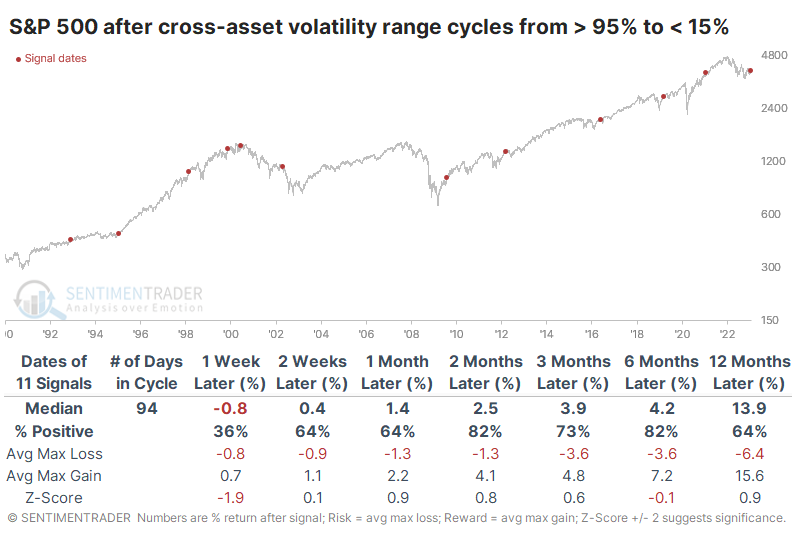
Cyclical sectors, especially Technology, Industrials, and Financials, enjoyed some of the largest average returns following these signals. There was a modest bias toward Large-Caps and Value stocks, as well.
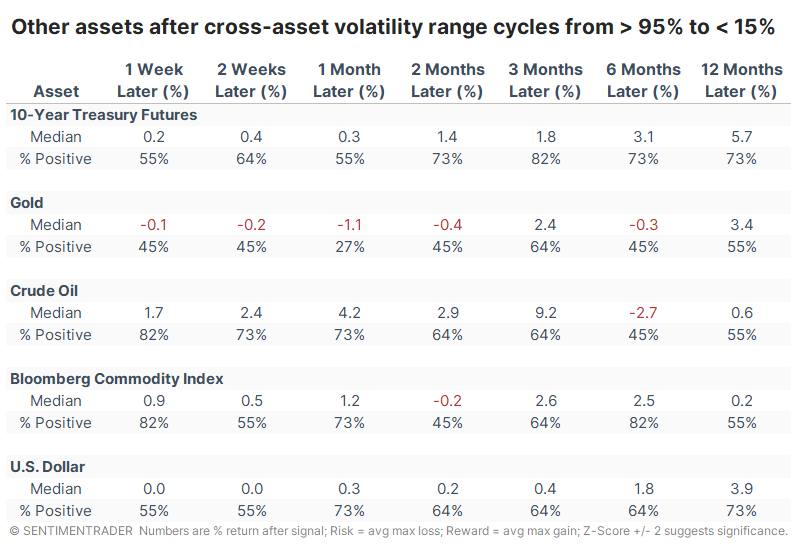
For other assets, these cycles tended to be good for the next few months in Treasury bond prices, in particular. While gold showed the least consistently positive returns, they all showed a decent ability to rebound over the next three months.
Stocks are rising across the globe
The percentage of major country equity indexes with a rising 200-day moving average is a useful gauge of global stock market strength. Jay noted that this indicator recently crossed a significant threshold, suggesting favorable market performance in the year ahead.
The All Country % Rising 200 Day indicator shows the percentage of major country equity indexes that have a rising 200-day moving average. The technique we will use involves the 50-day average dropping below 30 (which will typically occur during a meaningful market decline), then waiting for the market to tell us when the worst may be over by rising above 30.
The chart and table below display the signals and results using the MSCI ACWI Index (MXWD), which includes both developed and emerging markets starting in January 1988. Over the next three months, the index showed a gain every time.
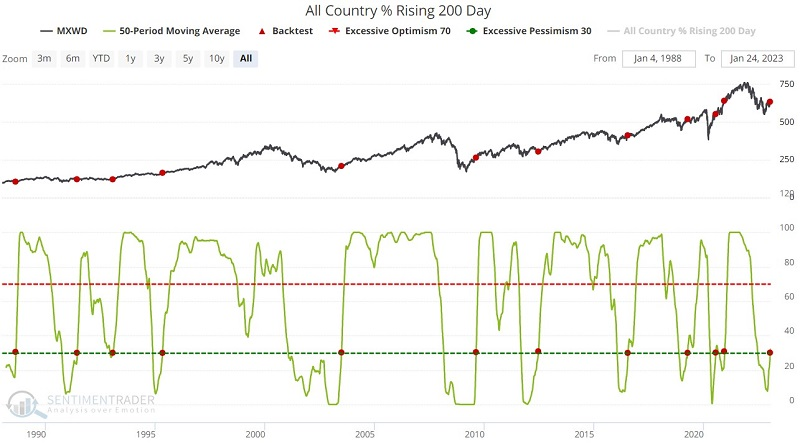
Looking at developed markets using the MSCI World Index (MXWO) since 1973, the best results were six months later, with 92% winning signals and an average of +9.8%. Looking only at US stock market results using the S&P 500 Index, the index enjoyed gains six months later every time, averaging 12.0%.
Other countries' relative trends are improving, too
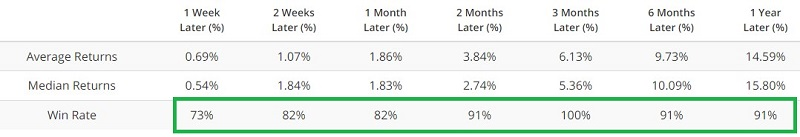
Dean showed that more than 78% of USD-based country ETFs maintain a positive relative trend score vs. the S&P 500. When the indicator exceeds 75%, a global index shows an annual return of 15.1%. Also, Japan closed at a 9-month high but not a 12-month high, which has positive implications.
The percentage of country ETFs with a positive relative trend score versus the S&P 500 recently exceeded 78%, representing the highest level in two years. So, the global backdrop looks significantly better than in the past couple of years.
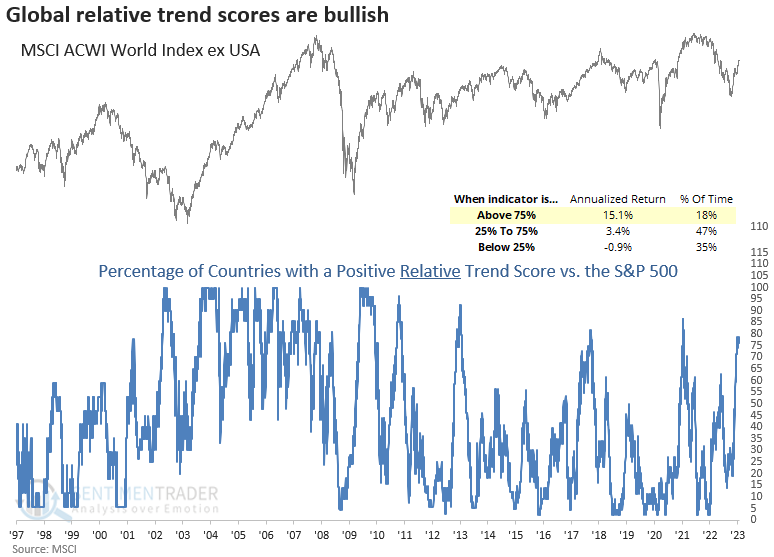
Not only is the list of country ETFs with a positive relative trend score versus the S&P 500 increasing, but the number of ETFs with a perfect score of +10 continues to expand. From a regional perspective, the Eurozone looks the best, with over 93% of the countries showing a positive score.
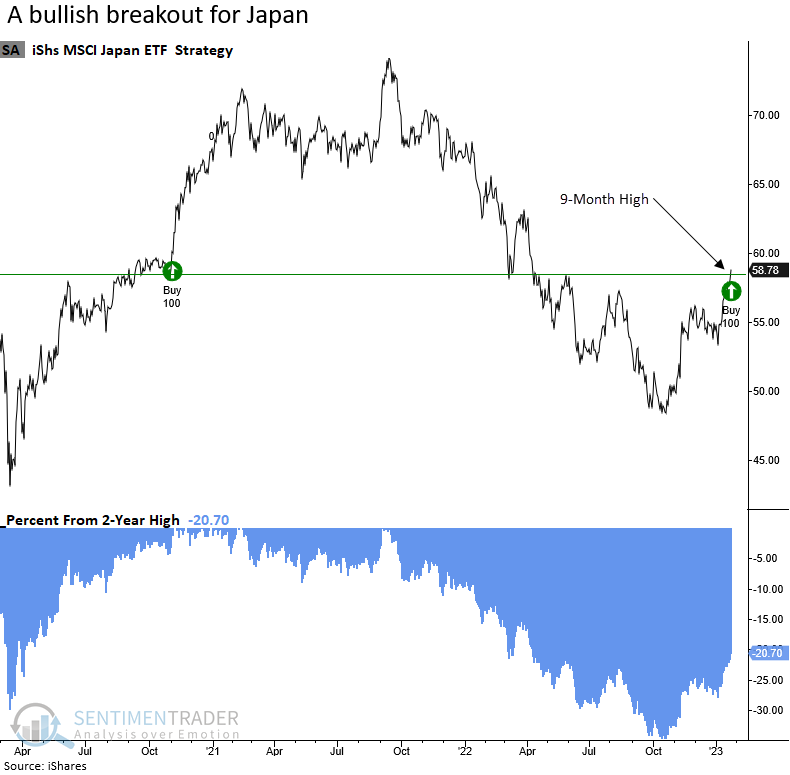
In recent notes, Dean highlighted breakouts in crude oil and semiconductors. We now have a similar breakout in a manufacturing/export-driven economy. On Wednesday, Japan closed at a new 9-month high but not a 12-month high.
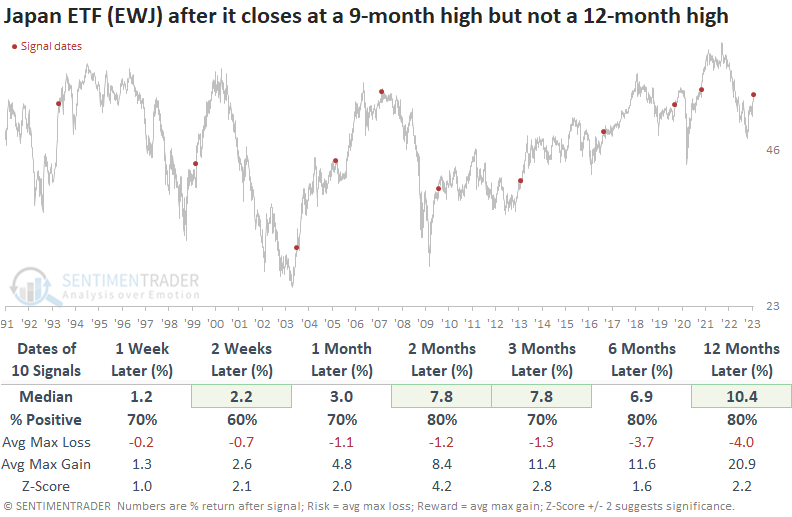
When the Japan ETF (EWJ) closes at a 9-month high but not a 12-month high, the ETF shows consistently bullish returns and z-scores across most time frames. One notable exception was a signal at the tail end of the 2003-07 bull market.
Stocks have done well...but gold did better
Since pessimism peaked and stocks troughed in October, the S&P 500 has jumped double-digits. The world's oldest safe-haven investment has done even better.
Referring to gold as a safe haven is arguable, but it's still considered to be that by many. Even if we accept the proposal, it's unusual to see an asset that is supposed to trade contrary to equities outpace them following a bottom.
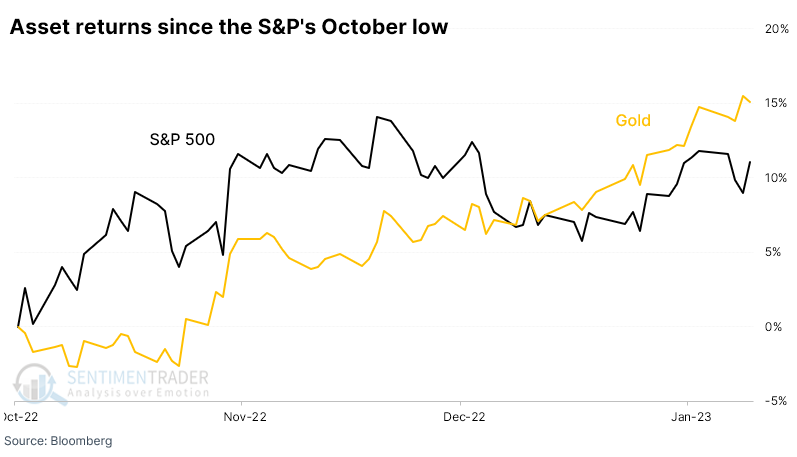
It has been 68 days since the S&P 500 bottomed last fall. Since then, it has rallied more than 11%. But gold has returned more than 15%. This is the first time since 1975 when the S&P went 68 trading days from a 52-week low, and gold's return outpaced stocks, using price only and not including dividends. One might assume that if a safe haven asset has beaten the S&P out of a low, then it suggests that investors are skeptical of the rally.
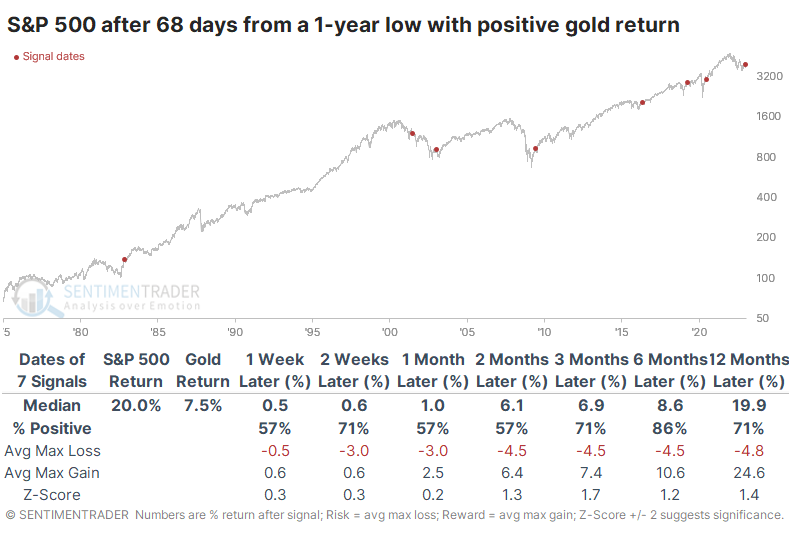
The table below shows every bottom since 1975 when the S&P went 68 trading days since setting a 52-week low, and gold showed a positive return. There isn't a big sample size, but out of the seven instances, the S&P managed further gains over the next six months every time but once. The failure in 2001 was persistent and nearly immediate. Most of the others saw only limited weakness.
For gold, these were pretty good signals as well. It managed to add to its gains over the next 2-3 months except following the 2003 bottom, though it erased those losses in the following months. 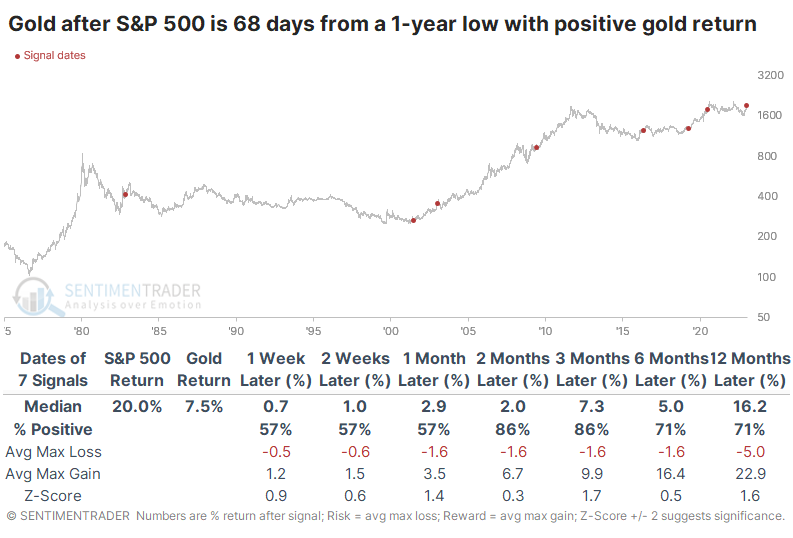
Credit spreads show another asset that should be a tailwind for stocks
The ICE BofA US High Yield Index Option-Adjusted Spread compares the yield on an index of below-investment-grade bonds. Jay noted that when both of these indicators are favorable - or both unfavorable - it tends to have a significant influence on stock prices.
The ICE BofA US High Yield Index is deemed unfavorable when the 13-week EMA > 28-week EMA AND the 2-week change in the 13-week minus 28-week EMA is greater than 0. Otherwise, this indicator is considered favorable.
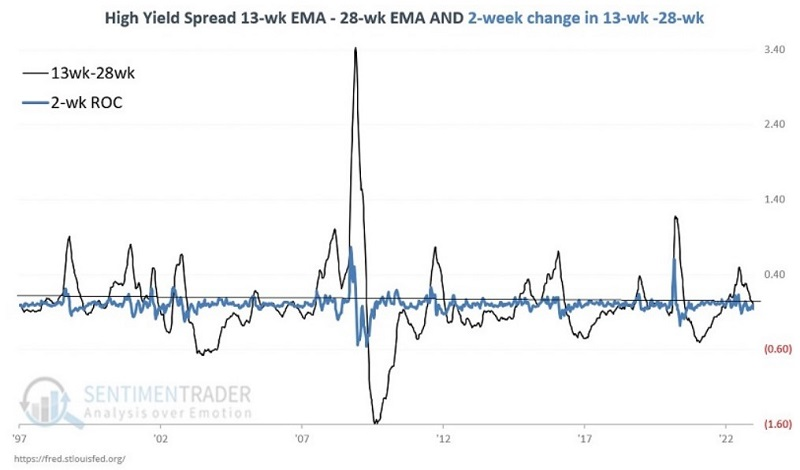
The chart below displays the growth of $1 invested in the S&P 500 Index only when both credit spread indicators above are rated as favorable.
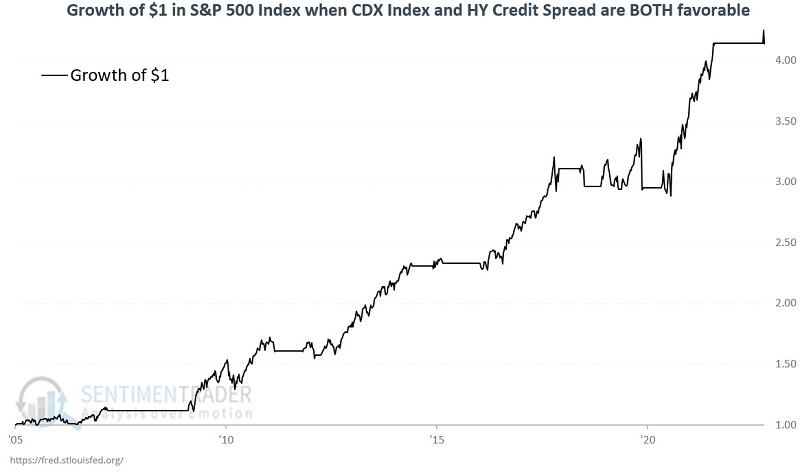
From 2005 through the present, the cumulative gain was +314%, with a maximum drawdown of -16%. In early 2023, both indicators once again returned to the favorable side of the ledger.
When both credit spread indicators are unfavorable, the S&P 500's cumulative loss was -46.9%.
Surging semis should be a good sign
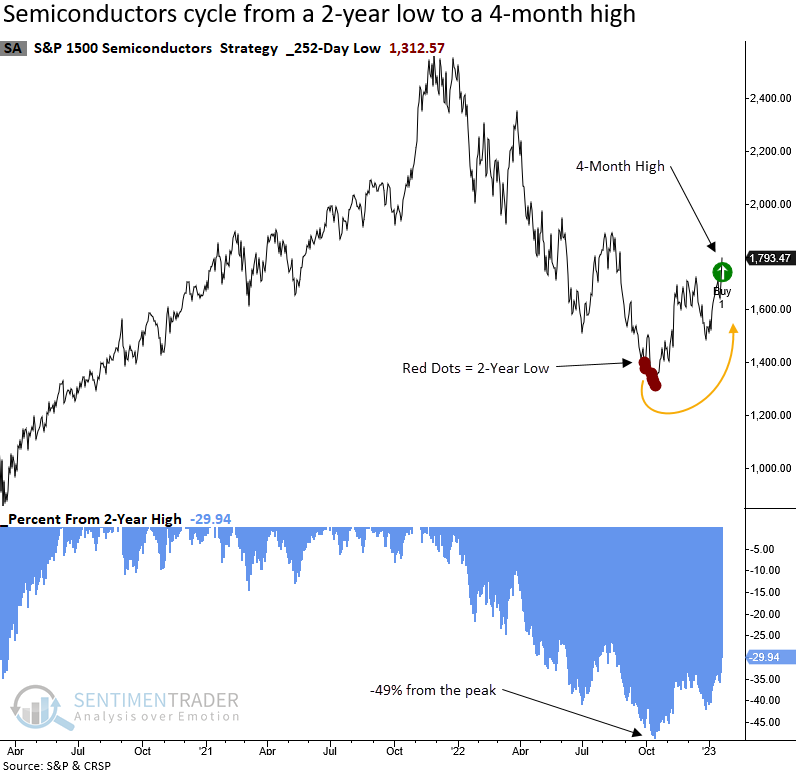
The S&P 1500 semiconductor sub-industry group cycled from a 2-year low to a 4-month high. Dean showed that after similar recoveries, the reward was huge but so was the risk in some cases.
On Monday, the S&P 1500 Semiconductor sub-industry group closed at a 4-month high. The new high represents the first instance after a 2-year low and a brutal 49% drawdown. Semiconductors are a crucial industry to monitor around bear market lows as the group maintains an outstanding track record of outperforming the S&P 500 after significant drawdowns.
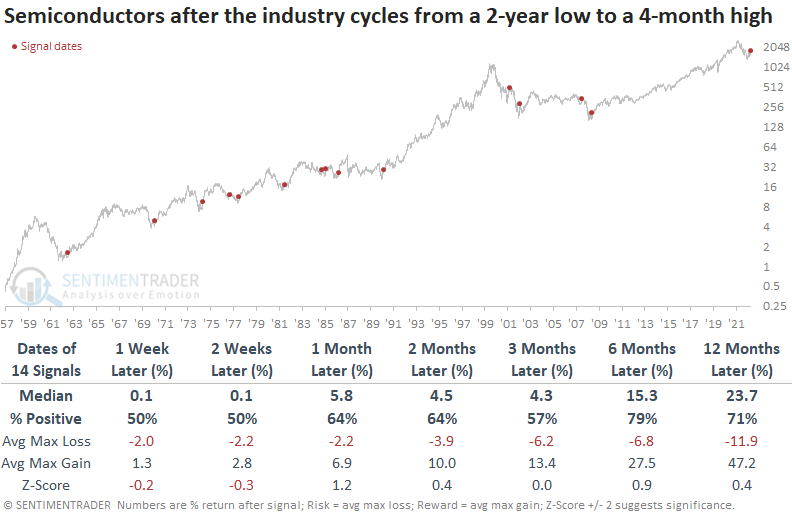
When the S&P 1500 Semiconductor group cycles from a 2-year low to a 4-month high, the industry tends to perform well on a long-term basis, especially six months later. The recovery in semiconductor stocks typically foreshadows an end to bear markets, with two notable exceptions occurring in 2002 and 2008.
The equal-weighted Semiconductor ETF (XSD) closed at a 6-month high, exceeding the previous peak from August 2022, which differs from the capitalization-weighted version as it remains below its August pivot point. When the equal-weighted Semiconductor ETF (XSD) closes at a 6-month high but not a 12-month, the breakout typically leads to further gains after the ETF digests the bullish price action leading up to the signal. Six months later, the ETF was higher 84% of the time.
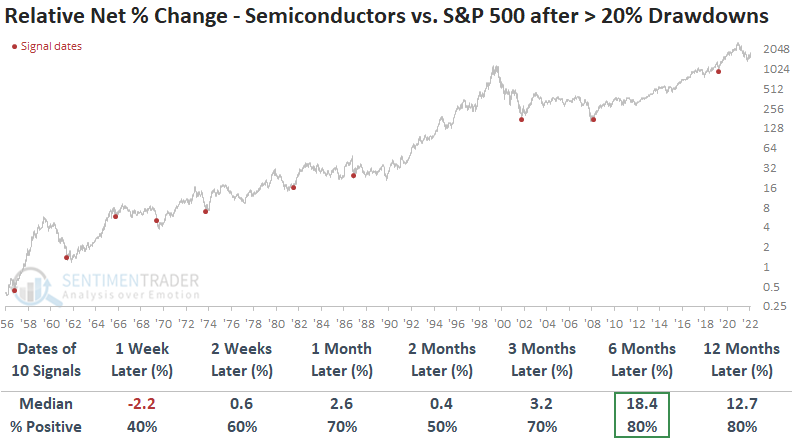
Semiconductor stocks maintain an excellent long-term track record of outperforming the S&P 500 after significant drawdowns, with an 80% win rate six and twelve months later.
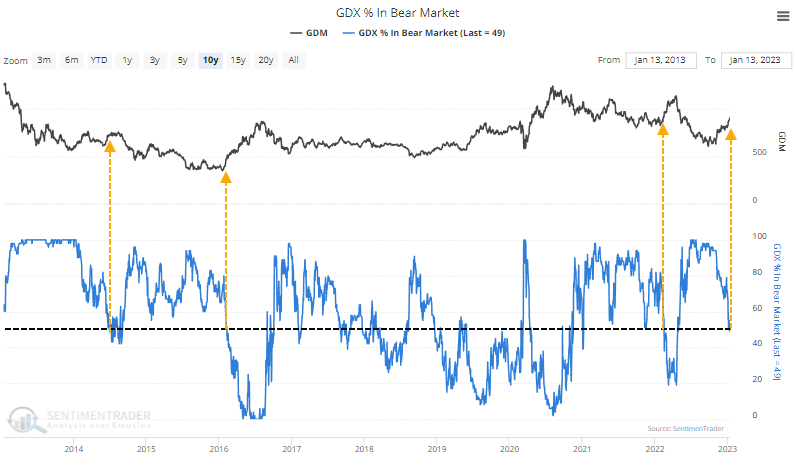
Gold miners are recovering but have trouble holding momentum
Earlier, we saw that gold had rallied even more than the S&P 500 since the latter bottomed in October. As gold goes, so do gold mining stocks, and they have likewise had a fantastic run.
For the first time in months, the percentage of miners in a bear market has plunged below 50%. That's down by half since they bottomed last year.
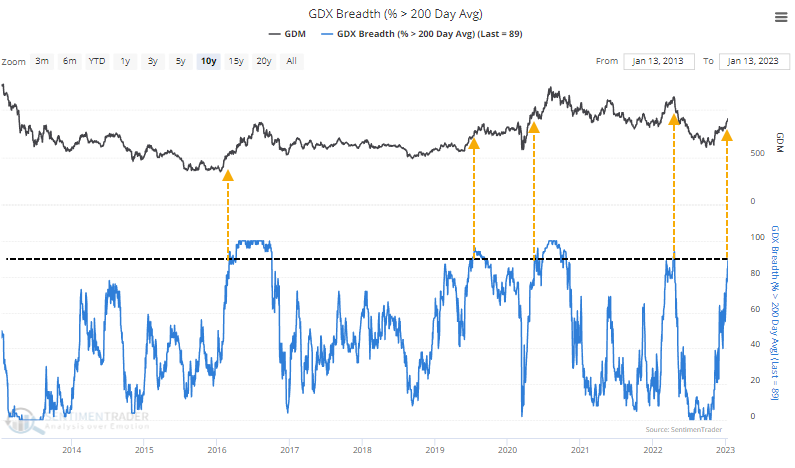
Holding upside momentum has always been challenging in this feast and (mostly) famine market. When there have been similar cycles over the past 50 years, miners showed mostly below-average returns in the future. The ability of more and more mining stocks to climb to within 20% of their previous 52-week high necessarily means more of them have overtaken their 200-day moving averages. Recently, it nearly reached 90% of stocks.
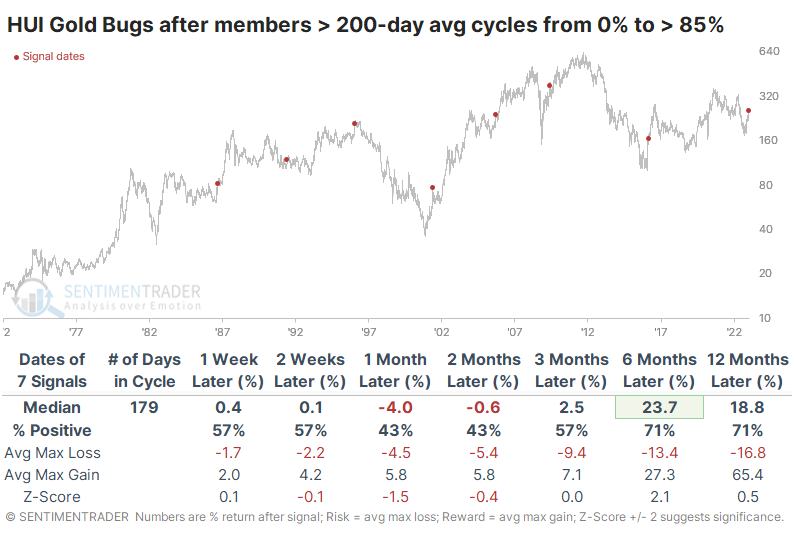
Again, it has been difficult for miners to hold gains after similar behavior, though returns were better than in the previous study. Over the next six months, the HUI Gold Bugs Index rallied after five of the seven signals, with an impressive average return. But the two losers were significant.
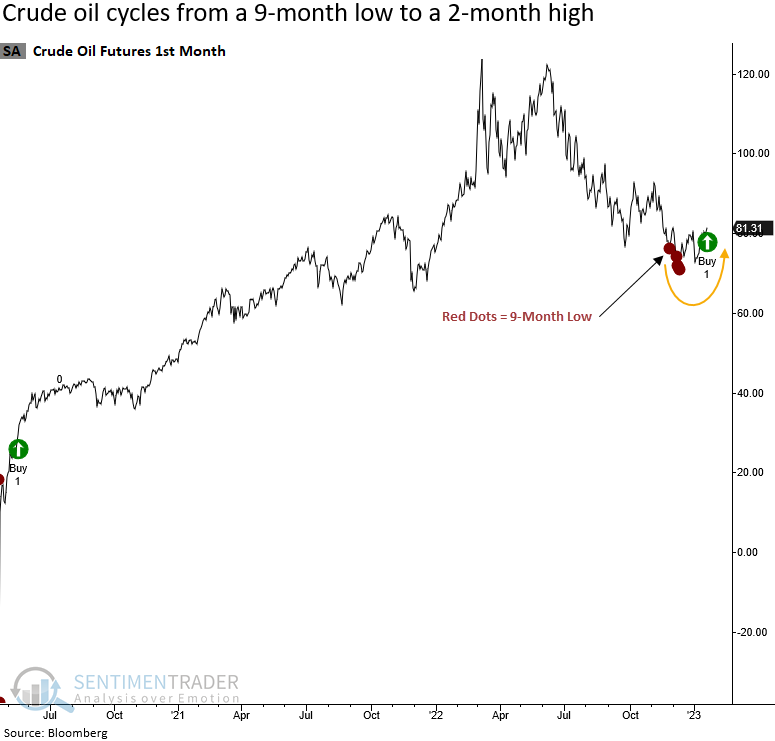
Crude oil is rallying, too
Dean noted that crude oil cycled from a 9-month low to a 2-month high. After similar reversals, oil paused and then rallied over longer time frames, while Energy stocks tended to rally in the near term.
Last week, crude oil closed at a new 2-month high. The new high represents the first instance after a 9-month low. Let's assess the outlook for crude oil and energy stocks under similar conditions.
When crude oil cycles from a 9-month low to a 2-month high, oil tends to consolidate in the first few weeks. However, the signal shows a gain at some point in the first two months in 21 out of 25 cases. While the long-term results look constructive, some of the drawdowns are concerning.
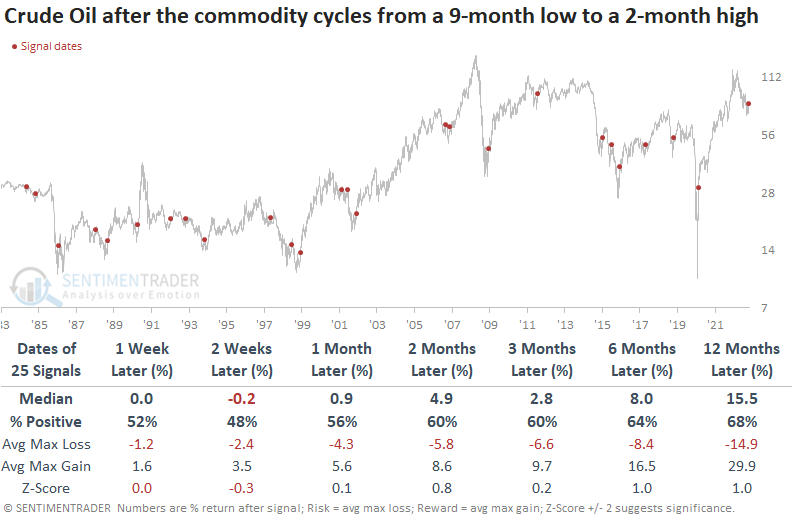
Interestingly, the Energy sector likes the reversal in crude oil in the first few weeks, which is the opposite of the oil outlook. The signal shows a positive return at some point in the first month in 22 out of 25 cases. Unfortunately, the long-term results for energy stocks are somewhat disappointing.
From a sector perspective, the reversal in oil favors value-oriented groups in the near term. And the equal-weighted energy sector outperforms the cap-weighted version in the first few months.
Unleaded gas might get a seasonal boost
Jay noted that unleaded gas tends to be a highly cyclical market, and this market is entering a typically favorable seasonal period. The chart below displays the annual seasonal trend for unleaded gas futures.
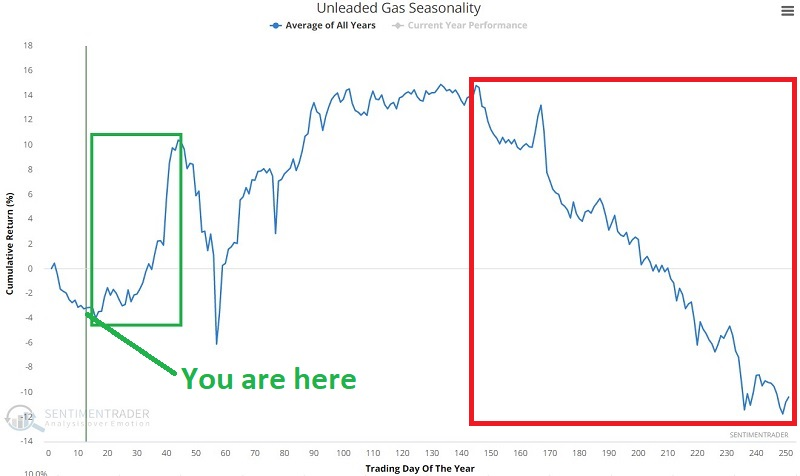
The most important thing to note is that unleaded gas is entering a typically favorable seasonal period. The period extends from the close of Trading Day of the Year (TDY) #16 through the close of TDY #44. For 2023, this period extends from the close on January 24 through March 3.
The chart below displays the cumulative hypothetical gain from holding one long unleaded gas futures contract only during these windows.
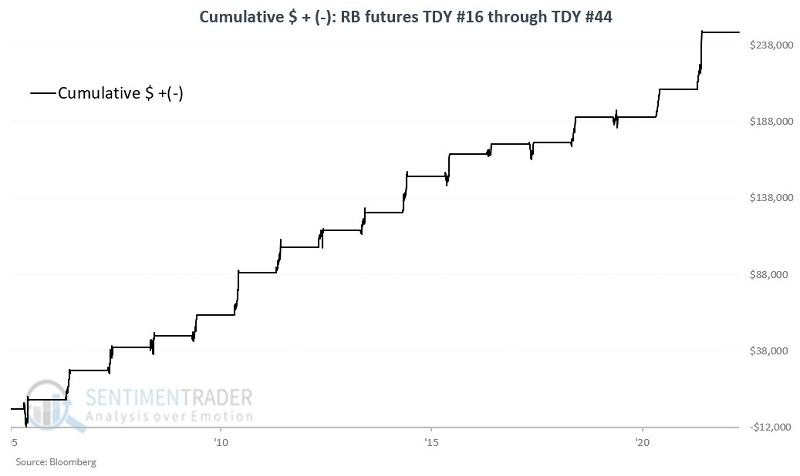
The futures contract showed a gain 16 times while losing only once. It managed a gain of more than $10,000 on 12 of those occasions. The bad news is that there is no guarantee that future results will be similar.
The United States Gasoline Fund® LP (UGA) is an exchange-traded security that is designed to track in percentage terms the movements of gasoline futures prices. To compare apples to apples, we use the same buy and sell dates for UGA that we did for RB futures above.
The fund showed a gain 11 times while losing 3 times. Its average gain was significantly larger than its average loss and it rallied more than 10% five times while never losing more than -10%.
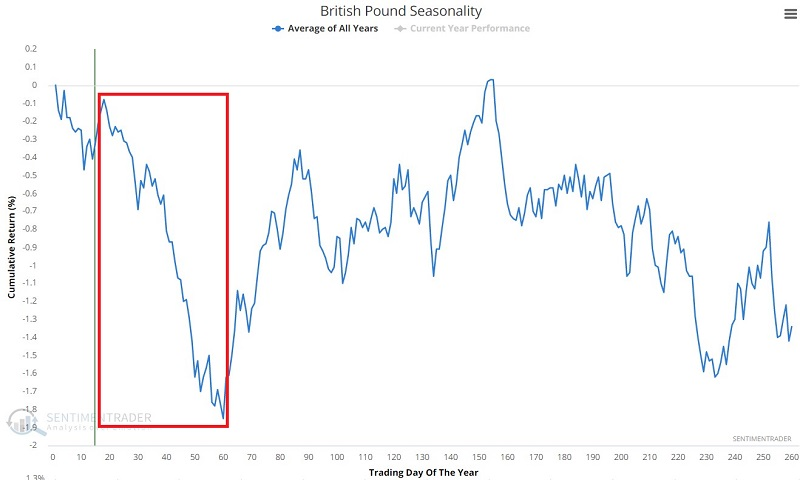
The pound, on the other hand, is facing a seasonal headwind
Jay further showed that the British Pound and the Euro have a history of showing weakness early in the year.
The chart below displays the annual seasonal trend for the British Pound. Note the period of typical weakness between late January and late March.
The table below displays the cumulative hypothetical equity curve achieved by holding long one British Pound futures contract from the close of the Trading Day of the Year (TDY) #18 through TDY #60 every year since 1976.
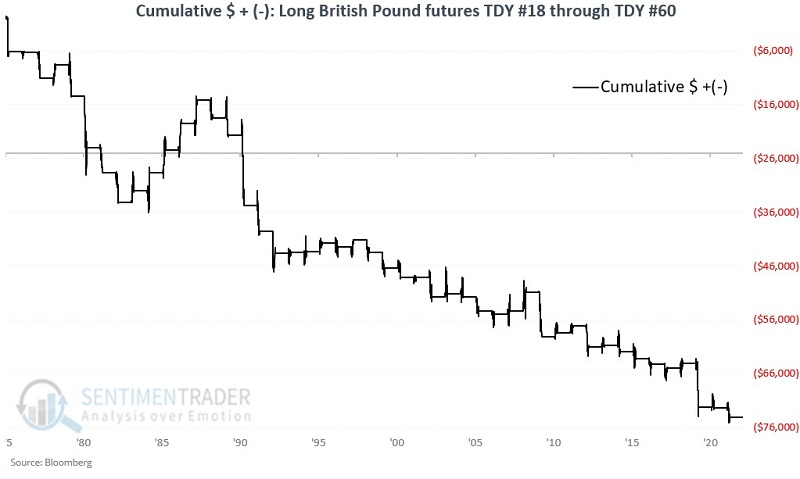
During these windows, the pound gained 18 times but slid 29 times. Its average gain during the up years was only about half the loss during the down years. It never showed a gain larger than $5,000 but suffered losses more than -$5,000 seven times. For 2023, this unfavorable period for the pound extends from the close on January 25 through March 24.
The euro is also facing a window of seasonal weakness.
The chart below displays the cumulative hypothetical equity curve achieved by holding one euro futures contract from the close of the trading day of the year (TDY) #16 through TDY #46 every year since 1975.
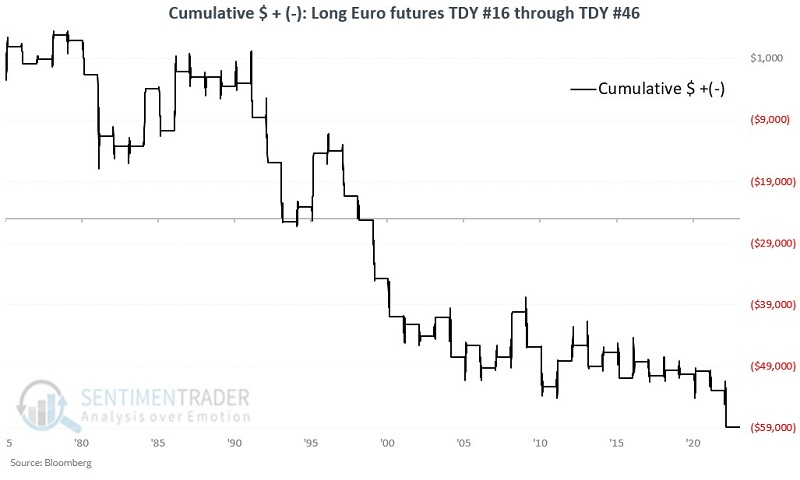
The currency showed a gain 20 times and a loss 28 times, with a significantly larger average loss than average gain.
Jay went on to show the benefits of a potential option trade using the FXE fund. If the euro continued its typical seasonal trend, then the contract would benefit handsomely while limiting risk if this is one of those years when it bucks the seasonal winds.
Time for copper to shine
Copper tends to be a highly cyclical market and is considered to be highly correlated to the overall economy. Jay showed that the metal is now entering a typically favorable seasonal period.
The chart below displays the annual seasonal trend for copper futures.
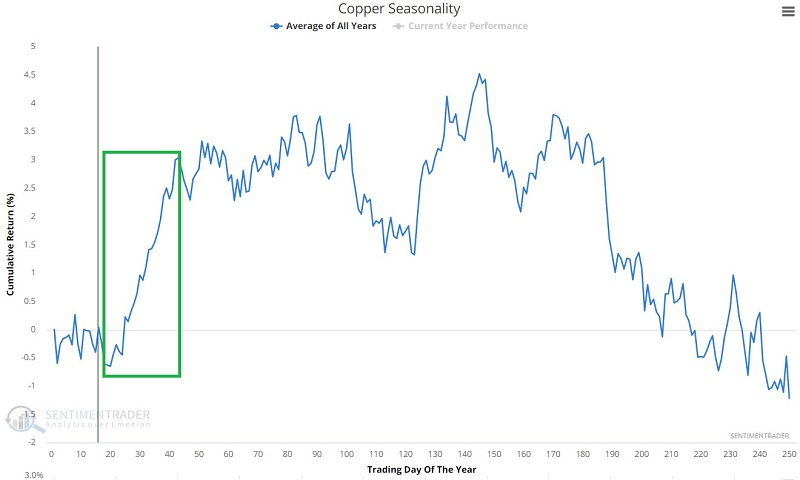
It is now entering a typically favorable seasonal period extending from the close of TDY #20 through TDY #43. For 2023, this period extends from the close on January 30 through March 2.
The chart below displays the cumulative hypothetical gain from holding long one copper futures contract during these seasonal windows since 1959.
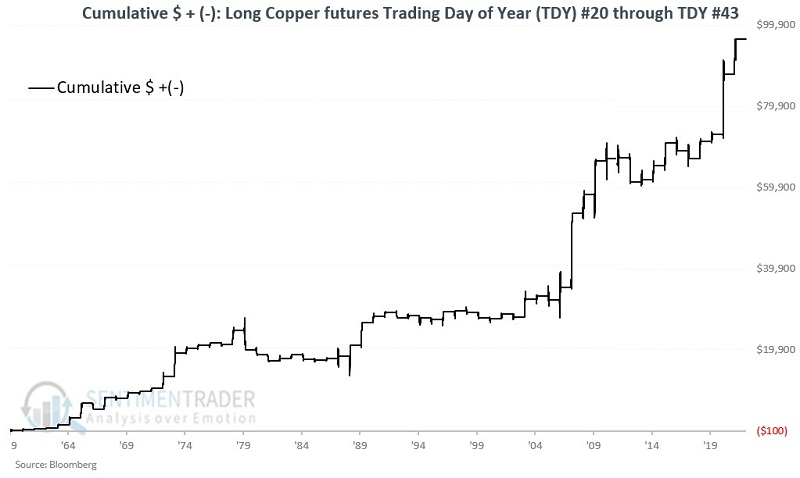
Copper gained during 43 of these windows while declining 20 times. Its average gain was about double its average loss, and the contract gained more than $5,000 on seven occasions while never losing more than -$5,000.
The good news is that historical results have skewed favorably. The bad news is that there is no guarantee that future results will be similar. For those who don't trade futures, the CPER exchange-traded fund shows a similar seasonal bias.
About TradingEdge Weekly...
The goal of TradingEdge Weekly is to summarize some of the research published to SentimenTrader over the past week. Sometimes there is a lot to digest and this summary is meant to highlight the highest conviction or most compelling ideas we discussed. This is NOT the full research that's published, rather it pulls out some of the most relevant parts. It includes links to the published research for convenience; if you don't subscribe to those products it will present the options for access.