
TradingEdge Weekly for Jan 26 - Fresh highs, employment trends, participation in financials and tech

Key points:
- The world's most benchmarked index recorded a fresh all-time high
- Some nascent technical warning signs to watch in the weeks ahead as small-caps lag
- Using employment trends as a stock market indicator...
- ...and as an economic one
- Financial stocks are technically healthy
- Technology stocks have enjoyed a remarkable surge in stocks hitting new highs
- That is definitely not the case with Chinese tech stocks, however
- A smaller stock jumped more than 10% at the open, and what that has meant for its future prospects
- High-yield bonds have consolidated gains since a historically notable surge in December
- It's a seasonally good time for unleaded gas
- And may be for copper prices, too
A record high for the world's most benchmarked index
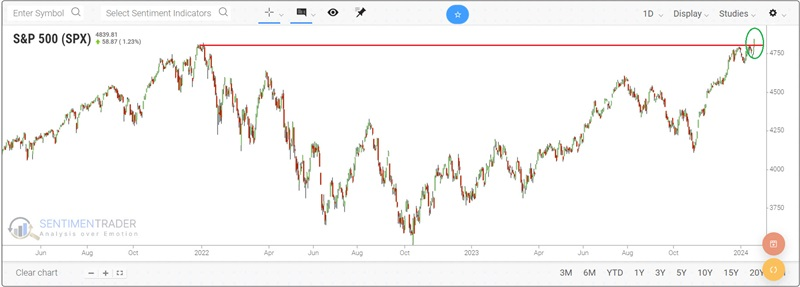
The S&P 500 just closed at a new all-time high. Jay noted that it was 512 trading days since the last all-time high and new highs at least a year apart have typically seen the market follow through to the upside.
As the chart below shows, the S&P 500 Index closed at an all-time high of 4,796.56 on 2022-01-03. It then went 512 trading days without making a new all-time high. That streak ended on 2024-01-19 at the far right when the S&P closed at 4,839.81.
The chart below shows how many trading days the S&P 500 has gone without making a new all-time high.
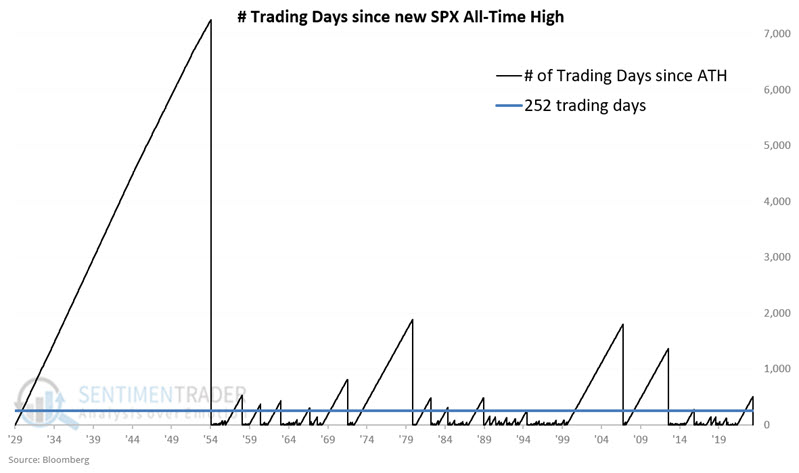
For our test, we will look at previous times when the number in the chart above exceeded 252 (roughly the number of trading days in a calendar year) and then dropped to 0 (i.e., a new all-time high was hit after a year or more of no new all-time highs).
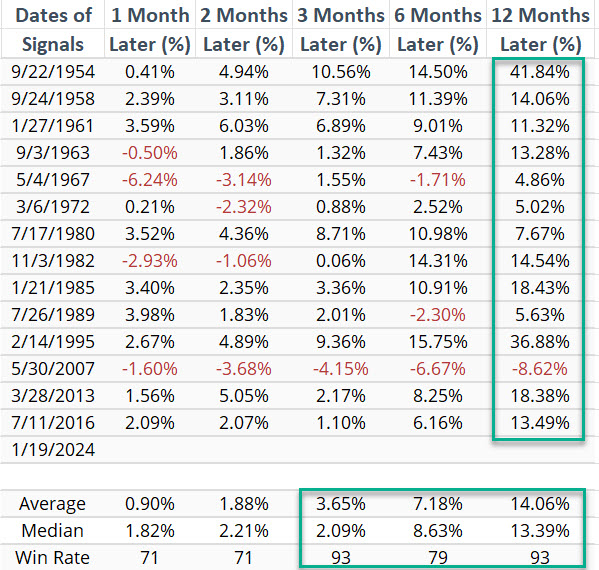
The table below displays the dates and subsequent S&P 500 performance following the 14 previous instances.
The chart below displays the hypothetical growth of $1 invested in the S&P 500 for one year after the dates shown in the table above.
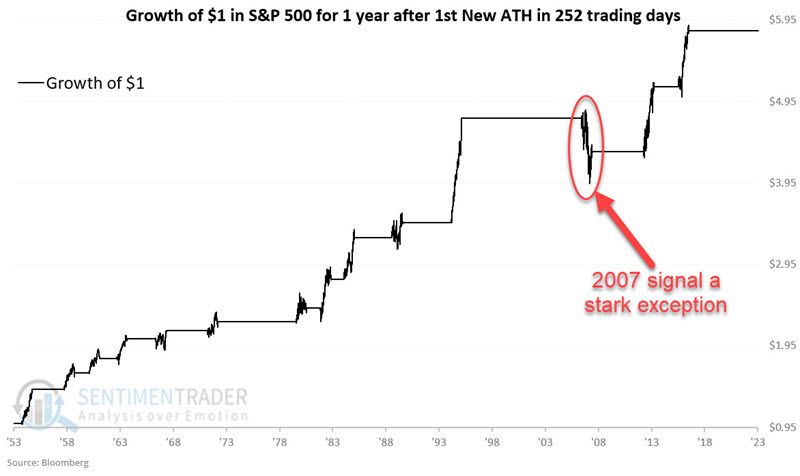
Does this guarantee the market will head higher in the year ahead? No indicator ever ensures anything. Also, the May 2007 signal - which was followed by nominal new highs before the onset of one of the worst bear market declines of all time reminds us that despite a 93% Win Rate, nothing is ever certain. Nevertheless, the information above falls solidly on the favorable side of the weight of the evidence ledger and dovetails nicely with a host of other recent favorable indicator signals.
Some things to watch as indexes trade around new highs
Stock indexes have been holding near highs, but more stocks recently fell to 52-week lows than hit 52-week highs. Behavior like this across exchanges has started to trigger technical warnings. The largest reason for these warnings is lagging Small Caps, which isn't necessarily a concern by itself.
One core tenet of a healthy market environment is that the percentage of stocks reaching a 52-week high in an index or on an entire exchange should outnumber those falling to a 52-week low. Just using that net metric can be a helpful guide for the magnitude of future returns.
When more stocks on the NYSE hit 52-week highs than lows, the S&P 500's annualized return was +10.8% since 1965. When there were more lows than highs, that annualized return got chopped more than in half. The streak of more highs than lows ended late last week, though it bounced right back above the zero line, which is what healthy markets do. That's something to watch in the weeks ahead.
The fact that more stocks fell to 52-week lows than rose to 52-week highs so soon after the S&P scored a 52-week high also triggered a Titanic Syndrome warning. Technical warnings like this tend to be more effective if there is a cluster, but the Backtest Engine shows that even a single warning tends to lead to poor short- to medium-term returns.
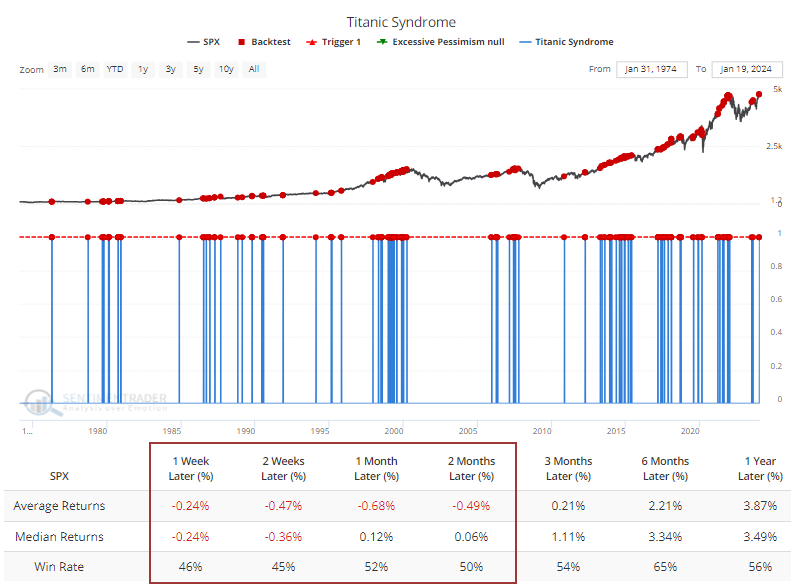
The main reason for the poor showing in 52-week lows versus highs is smaller stocks. Even though the S&P 500 recorded an all-time high on Friday, the Russell 2000 was still in a bear market, down more than -20% from its own high.
The only time there was a similar divergence between the S&P and Russell 2000 was in 1998-1999. At that time, the Russell was more than 19% off its high. While stocks continued to rise for quite a while after the divergence, it did not end well in the long term.
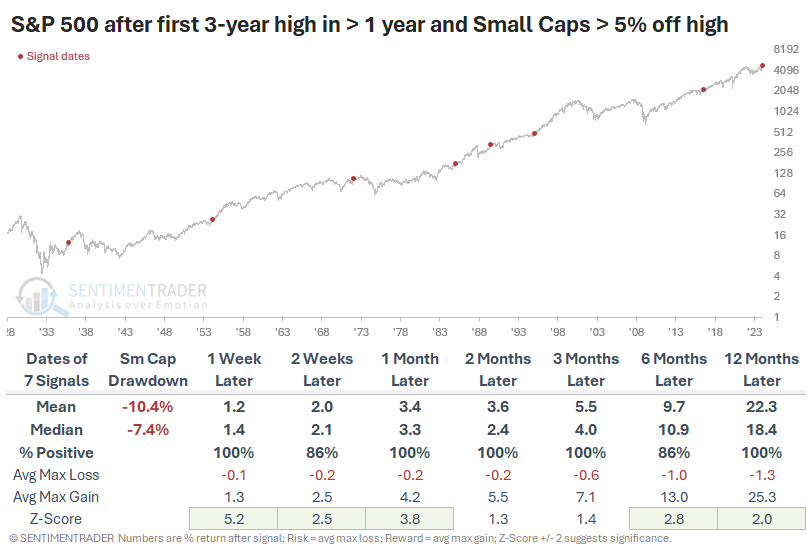
Using a total return index for Small Caps, the table below shows other times when the S&P 500 closed at least at a 3-year high, but Small Caps were at least 5% off their own high. Crucially, the table filters the dates to those times when it was the first S&P new high in at least a year; true breakouts that could jolt investor sentiment. The 1998-99 period doesn't show up because the S&P had been hitting new high after new high leading up to then. Surprisingly, there was no ill effect up to a year later despite small-cap stocks lagging so badly.
There are starting to be some worrying signs underneath the strong performance of the indexes, as we're back in an environment where a few super strong large stocks can sway entire indexes. It has triggered nascent warning signs in some technical indicators, but nascent signs don't matter much in a mostly healthy tape. If they persist for weeks, we'll have a better case for worrying about the sustainability of the advance.
One reason why these warnings may not matter as much this time around is that it is primarily due to lagging small-cap stocks. While they may be more sensitive to economic forces and thus assumed to be an especially effective warning for the broader market, it hasn't panned out that way before. When the S&P 500 reached new highs while Small Caps lagged badly, it had no ill impact on forward returns whatsoever.
Using employment trends as a stock market indicator...
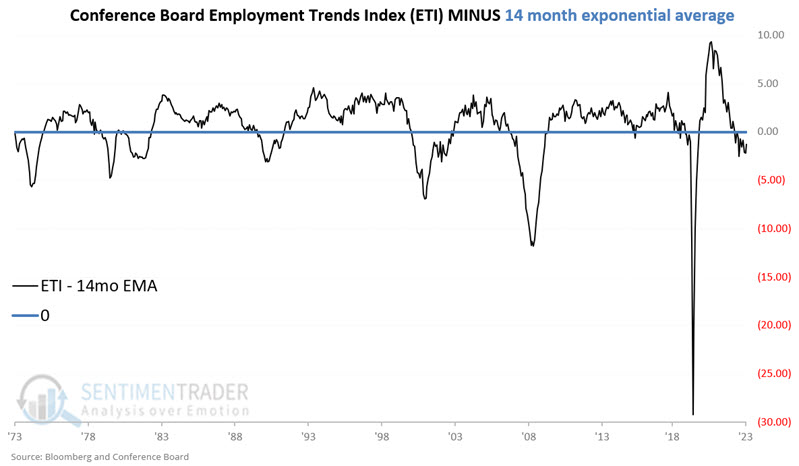
Employment is critical for the health of the economy; The more people earning an income to spend on goods and services, the better - and vice versa. Jay showed that the Conference Board Employment Trends Index provides a broad measure of employment conditions and a newly constructed model appears to do a reasonably good job of highlighting favorable - and unfavorable - periods for the stock market.
The Conference Board Employment Trends Index (ETI) is an aggregate of eight labor-market indicators that is intended to measure underlying trends in employment conditions. The latest reading for the Employment Trends Index is evaluated once a month after the close of trading on the last day of the month. The measurements are:
A = Most recent available Employment Trends Index value as of the last day of the month
B = 14-month exponential moving average of A
C = A - B (latest monthly reading minus 14-month EMA)
Variable C is simply the difference between the latest monthly ETI reading and its 14-month EMA.
NOTE: The ETI for one month is reported in the following month. So the December 2023 ETI value would be evaluated after the last trading day of January 2024.
The chart below displays Variable C, i.e., the difference between the two line in the chart above.
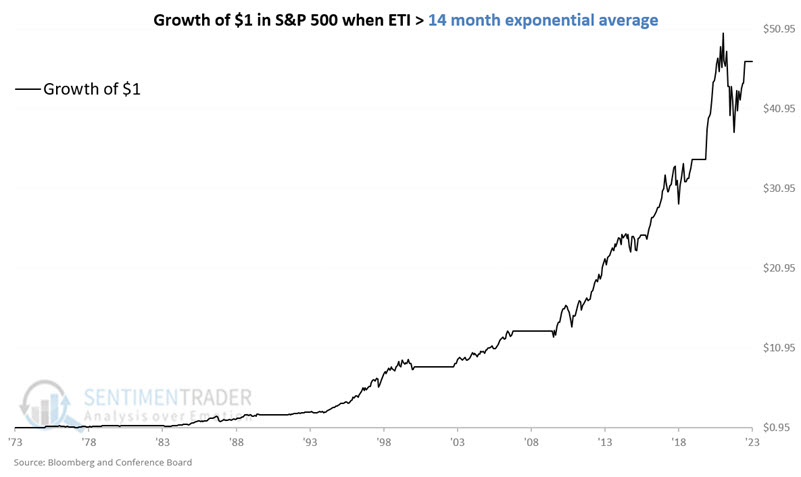
We will use the monthly price change for the S&P 500 Index to measure stock market performance from 1973-12-31 through 2023-12-31. The chart below displays the growth of $1 invested in the S&P 500 only during those months when the ETI closed the previous month above its 14-month EMA. The cumulative return is +4,587%.
Conversely, the chart below displays the growth of $1 invested in the S&P 500 only during those months when the ETI closed the previous month below its 14-month EMA. The cumulative return is +4.8%. In other words, 95% of the total gain for the stock market in the past 50 years occurred when the ETI was in an uptrend.
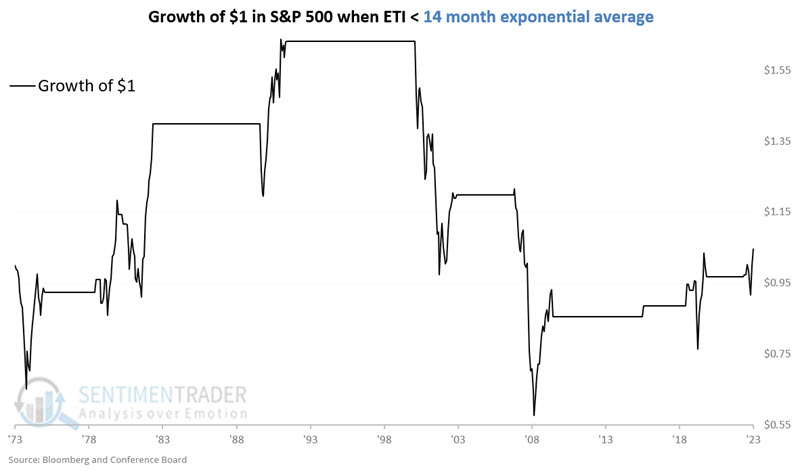
Recent results have been less impressive as the model has been somewhat out of sync with the stock market. After missing significant portions of the 2000-2003 and 2007-2009 bear markets, the model was favorable throughout the 2022 decline. The model has also been unfavorable since the end of May 2023, when the stock market has generated strong results.
...and as an economic indicator
Jay further evaluated how the economy performed based on positive or negative readings for Variable C, as shown in the chart above.
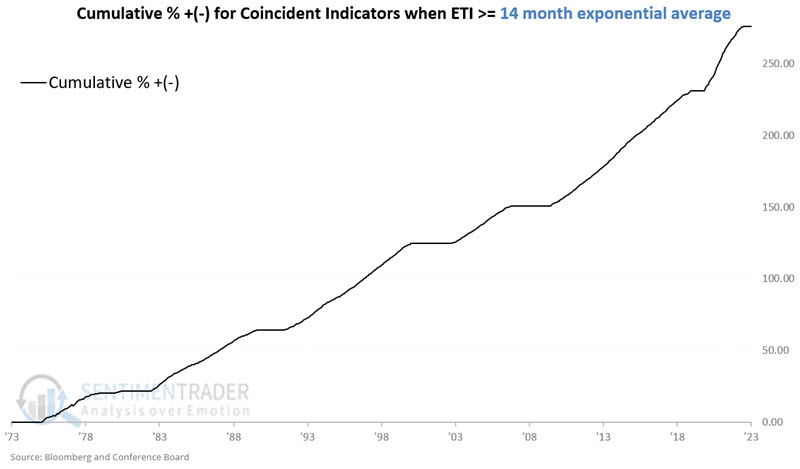
We will use the monthly change for the Coincident Economic Indicators (CEI) to measure economic performance from 1973-12-31 through 2023-12-31. The chart below displays the cumulative % growth for the Coincident Economic Indicators only during those months when the ETI closed the previous month above its 14-month EMA. The cumulative increase in the Coincident index during these months is +276.5%.
The chart below displays the cumulative % growth for the Coincident Economic Indicators only during those months when the ETI closed the previous month below its 14-month EMA. The cumulative return decline in the Coincident index during these months is -8.3%.
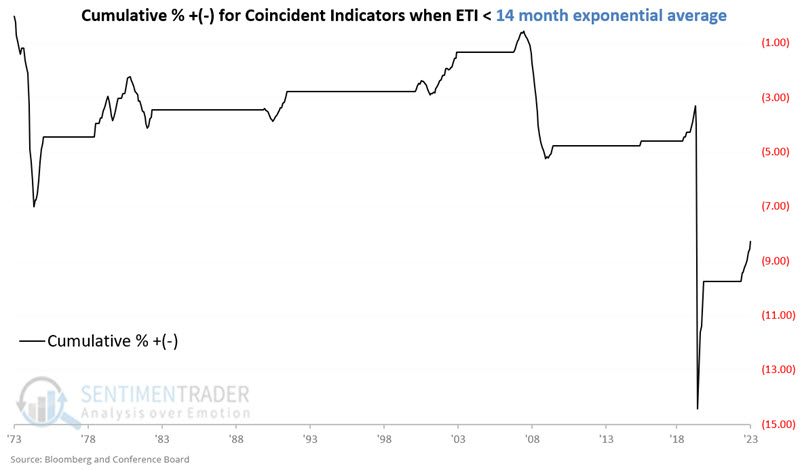
The difference in economic performance between favorable and unfavorable months is stark.
Key metrics to note:
- % of Months UP: Favorable mos. 98%, Unfavorable mos. 54%
- Cumulative % +(-): Favorable mos. +276.5%, Unfavorable mos. (-8.3%)
With that caveat in mind, we can broadly generalize that the economy is highly unlikely to contract when ETI > 14-month EMA (98% of all such months saw CEI show a gain). The economy is not necessarily expected to contract when ETI < 14-month EMA but the likelihood of a recession is much higher (54% up months, 5% unchanged, 41% down months). All recessions in the past 50 years have occurred when ETI was below its average.
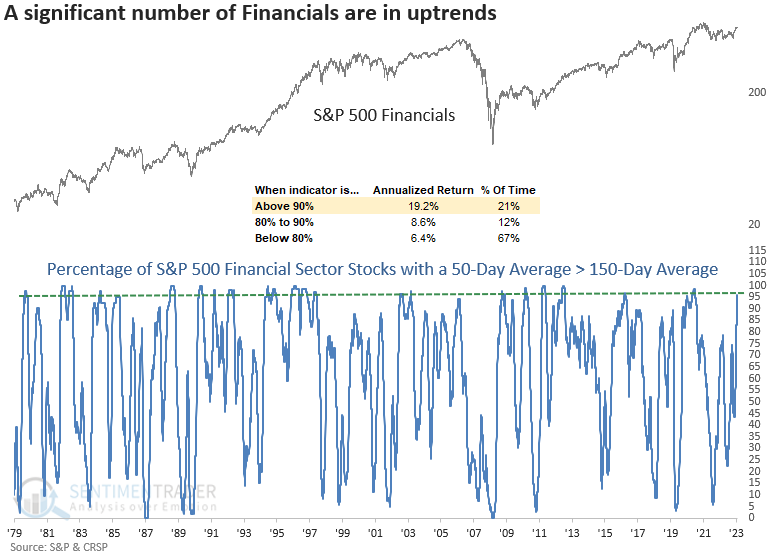
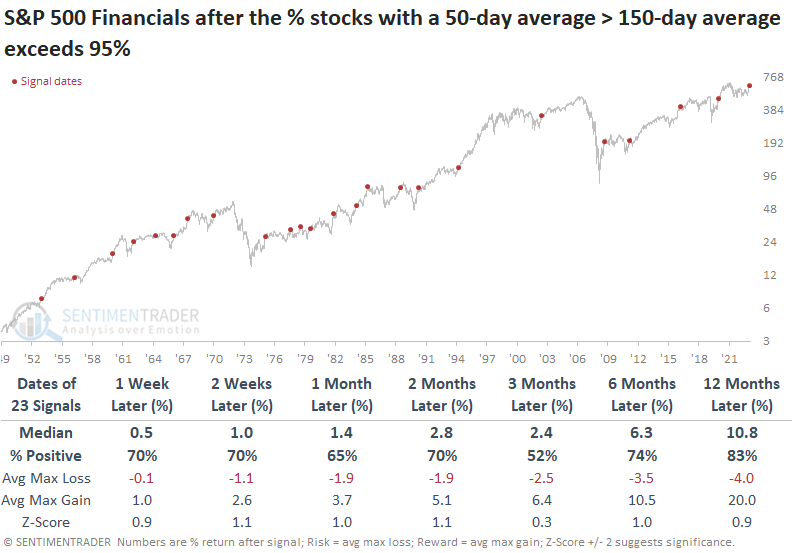
Financial stocks are technically healthy
Almost every S&P 500 Financial sector stock maintains a bullish moving average crossover profile. Dean noted that similar trend conditions suggest the uptrend in Financials and the S&P 500 will continue over the next year.
On Wednesday, a trend-following indicator measuring the number of S&P 500 Financial sector stocks with a 50-day average above the 150-day average increased to 95%, recording the highest level in over two years.
The S&P 500 Financials sector shows an annualized return of 19.2% when more than 90% of its members are in uptrends like now.
The S&P 500 Financials sector holds the highest percentage of stocks with a positive absolute trend score and the highest level of members with a perfect score of ten. Stocks with positive relative trend scores also look favorable, slightly trailing the leader, Technology. Dean further broke down trend scores by sub-industry and individual stocks to show which ones were leading.
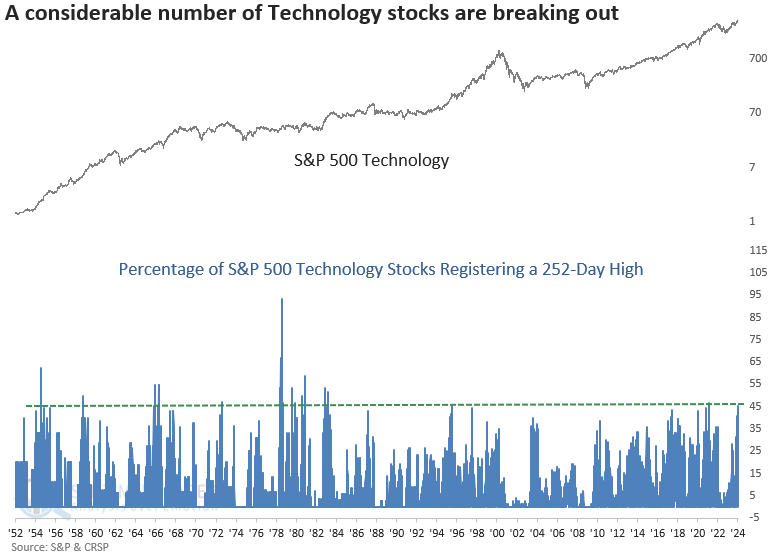
A new high surge among tech stocks
Dean showed that the percentage of S&P 500 Technology stocks registering a 252-day high exceeded 45%. After similar thrusts, there was some additional short-term upside in the sector, followed by a pause.
After a brief dip to start the year, Technology stocks are back in vogue. On Monday, the percentage of S&P 500 Technology stocks hitting a 252-day high surpassed 45%, marking the highest point since February 2021 and the 31st most substantial level in history.
For those unfamiliar with market breadth history, the emergence of a substantial number of stocks hitting annual highs can sometimes lead to buyers' exhaustion. i.e., it's so good, it's bad. However, in most cases, the spike in new highs ushers in a consolidation rather than a bull market peak.
Whenever the percentage of S&P 500 Technology stocks hitting a 252-day high surpasses 45%, the sector tends to experience additional upward momentum in the subsequent weeks. However, this momentum fades a month later, resulting in a flat return and a marginally lower coin toss win rate. From a medium to long-term perspective, results are uninspiring.
Surprisingly, only two precedents occurred after 1982, a period containing two significant Technology-driven bull markets. If we focus on those two cases (1995 & 2021), the surge in annual highs signaled exhaustion, with both instances showing negative returns across several time horizons.
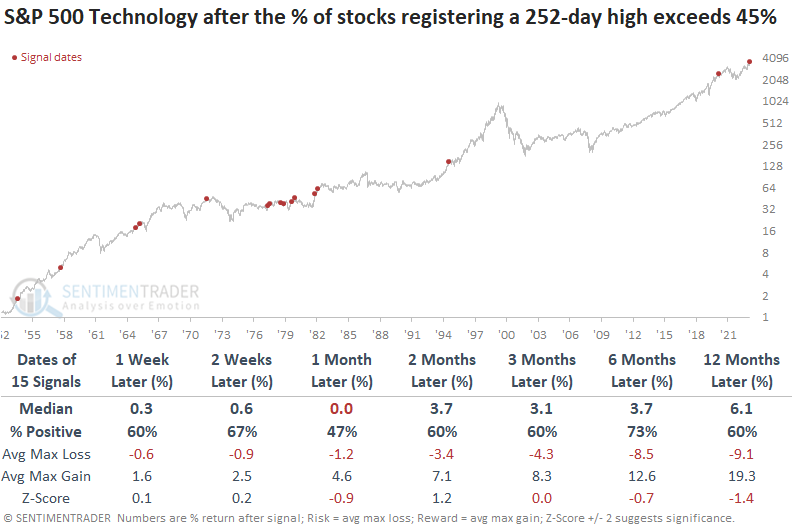
Returns and win rates for the S&P 500 were more favorable across all time frames, suggesting that any pause in Technology did not impact the broader market much. That was especially the case in 1995 and 2021. So, investors likely rotated to other sectors.
When assessing the percentage of stocks in each sector with a positive absolute or relative trend score, the Technology sector holds a dominant position, especially when it comes to relative scores.
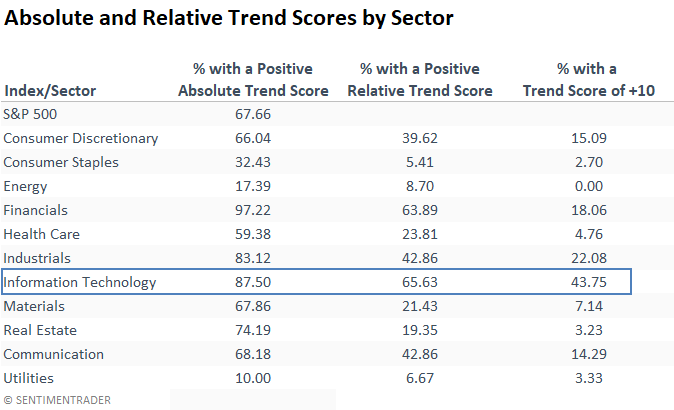
Within S&P 1500 Technology sub-industry groups, Semiconductor, Software, and IT Consulting and Services stocks maintain the highest relative trend scores.
Chinese tech stocks, however, are definitely NOT hitting new highs
It seems like we have occasion to do this twice every year, and this one is starting early. It's time to talk about the plunge in Chinese technology shares.
In mid-March 2022, we looked at one of the most stunning displays of overwhelming distaste for any sector or any market we've ever looked at. By May of last year, these stocks were showing signs of heavy selling pressure again, but it wasn't to a level that we could consider extreme for such a volatile group. It's getting there now.
In the past week, selling pressure reached the baby-and-bathwater level again, and half the stocks sank to 52-week lows. Again.
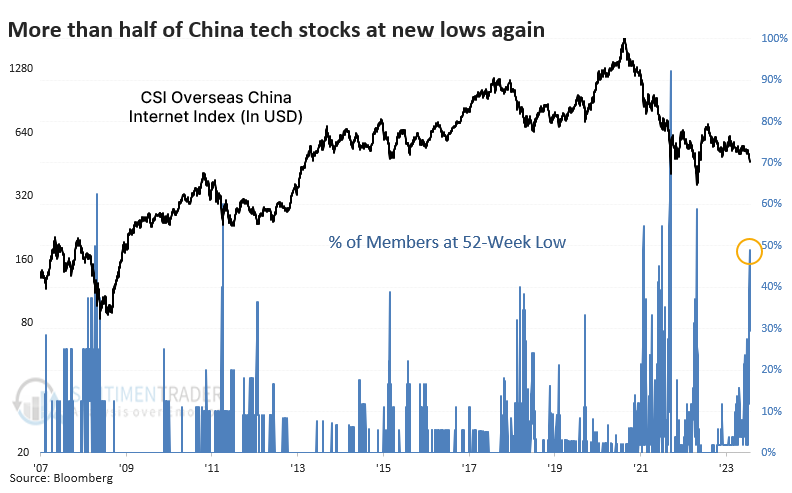
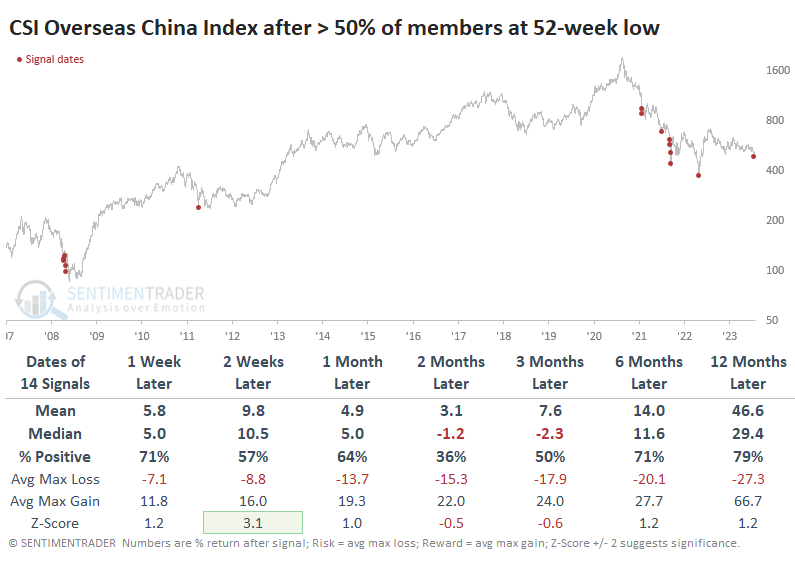
The table below shows every date when more than half the stocks were at new lows. Twice, they occurred in clusters during the worst meltdowns in 2008 and 2022. Three other times, they were mostly isolated to a session or two before a vicious rebound. Only the summer of 2021 and early 2022 dates showed a negative return over the next 6-12 months.
The selling pressure has persisted for a couple of weeks. On an average day over the past ten sessions, fewer than 25% of the stocks closed in positive territory. That kind of selling pressure occurred a few times in the beginning stages of the decline and a few other times at the end. Even so, they all saw a rebound two or four weeks later.
The days with selling pressure have been almost all-in. There have been seven sessions in just the past month when fewer than 10% of stocks managed to rise. There were only a couple of distinct precedents clustered in 2011 and 2022. The notable part of this is the tendency to see a rebound over the next couple of weeks.
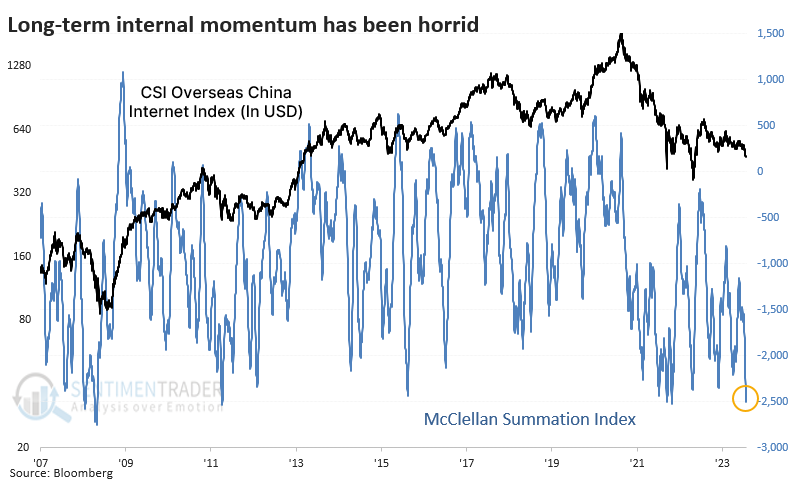
Due to the persistent and heavy selling, long-term internal momentum is about as bad as it's ever been. The McClellan Summation Index for this group is below -2500, which is a horrifically lousy reading for any sector. Just absolutely brutal.
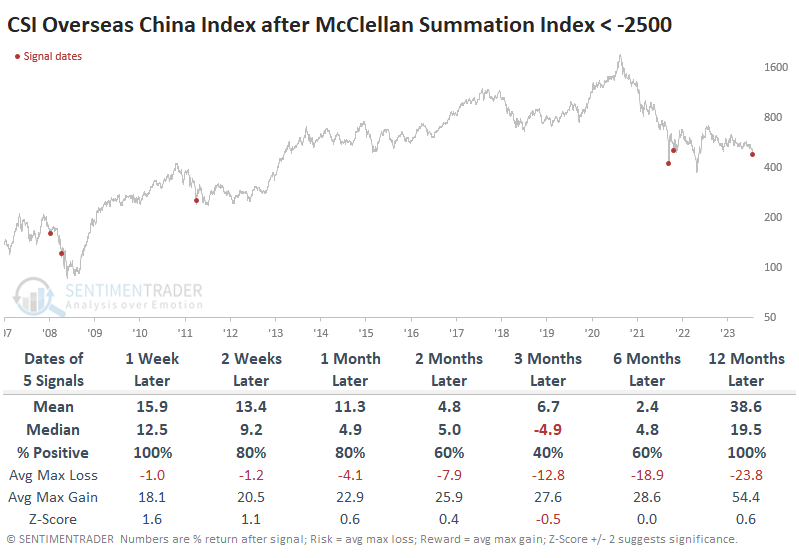
There were only a handful of days when it got this bad. In 2008, it triggered twice, both well below the stocks finally bottomed. It was a much better contrary signal in 2011 and 2022...for a while, anyway. While the amount of risk after these dates was absurdly high, they still showed a positive one-year return.
By the time selling pressure has become as heavy as the last couple of weeks, Chinese tech stocks have typically been near an exhaustion point. Usually, the letup in selling has lasted at least a couple of weeks. A few times, it has marked a multi-month or even multi-year turnaround. At this point, relying on anything more than a short-term relief bounce requires faith. And anything investment that requires faith should be held with tight reins.
A big gap in a small(ish) stock
Super Micro Computer (SMCI) surged on the back of positive fundamental data, opening up 11.6% on Friday. Dean showed that similar price patterns produced a median return of 11.7% and a 91% win rate over the subsequent month.
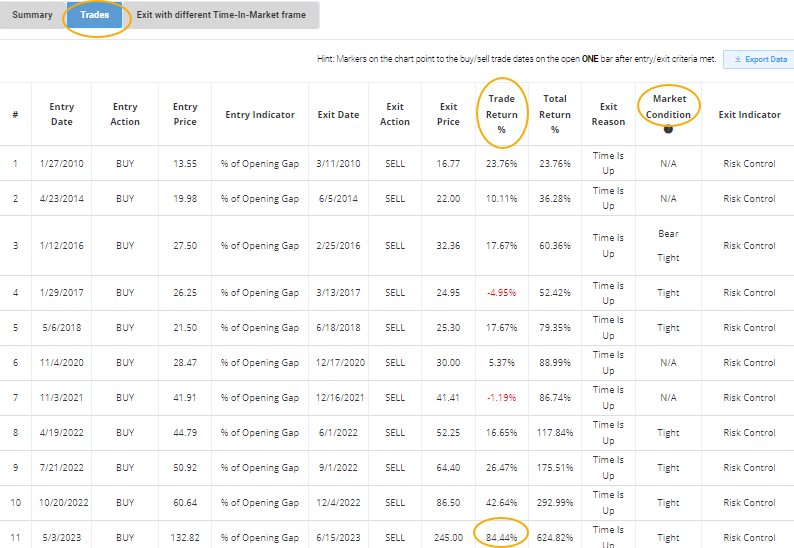
With the upgrade to our Backtest Engine, you can test traditional technical indicators and price-only patterns, such as the opening gap, which we call "% of Opening Gap."
Last Friday, Super Micro Computer (SMCI), a computer hardware company, surged 11.6% at the opening bell following the release of positive fundamental data. Traders often refer to this type of surge as an "Episodic Pivot," signifying a fundamental shift that brings about a dramatic surge in the price of a security.
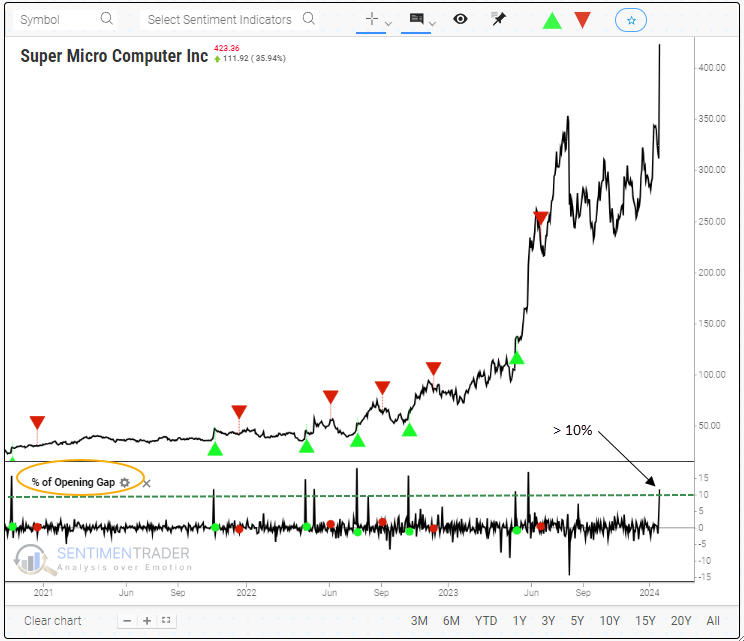
Dean showed the Backtest Engine steps to test how SMCI behaved after similar opening gaps. In the Trades section, users can see the individual returns for each trade. The previous +10% gap-up open from May 2023 shows a remarkable gain of 84% over our 30-day holding period.
A new column in this section is Market Condition, which provides context for trading signals. Current conditions include bull and bear markets, recessions, and Fed policy.
Super Micro Computer Inc (SMCI) opened 11% higher on Friday due to bullish fundamental news from the company. After similar price patterns, the upside momentum tended to persist, with the stock displaying a median return of 11.7% and a 91% win rate over the subsequent month. Subscribers can leverage our new and improved Backtest engine to evaluate the risk/reward profile of price-based events similar to the one outlined today instead of making trades solely based on intuition.
High-yield bond behavior is on par with other bear market recoveries
As many stock indexes continue to record new high after new high, some tangential markets have been holding back. We already saw that with small-cap stocks, and we can add high-yield bonds to the mix.
In December, there was a surge in 52-week highs among high-yield (junk) bonds, and since then, they have tread water. At the peak, there was a net of 33% more bonds hitting 52-week highs than 52-week lows, the 2nd-highest percentage in nearly 20 years. The other spikes came from the bear markets in 2008 and 2018.
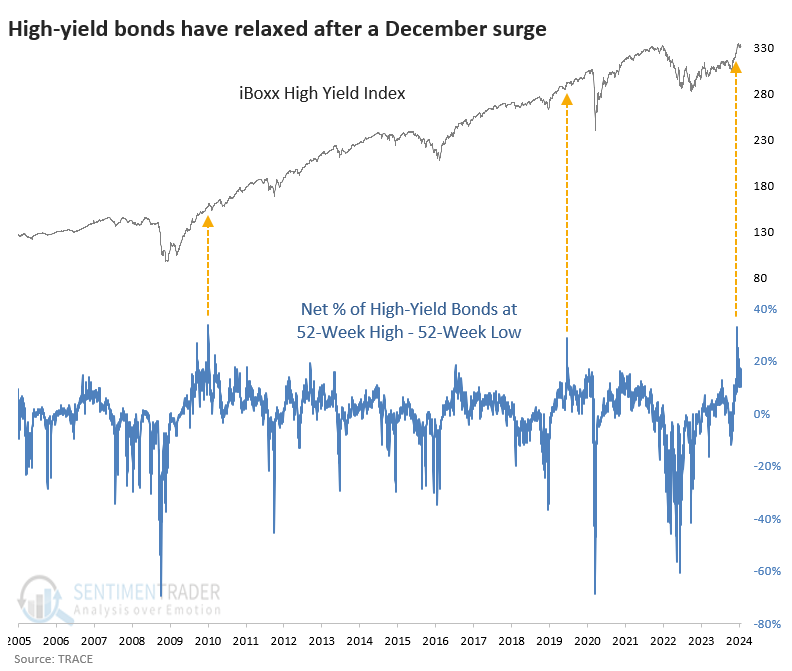
Since the spike in December, the iBoxx index has chopped around and shows a slight negative return. That's perfectly in line with the precedents. The good news is that returns were excellent over the next six months, though we're limited to two distinct periods.
Thanks to the December rally, internal momentum in high-yield bonds has been exceptional. The McClellan Summation Index for that market climbed to nearly +1500 for only the third time. The other two were coming out of the severe bear markets in 2008 and 2020, and the bonds continued to climb for months or years afterward.
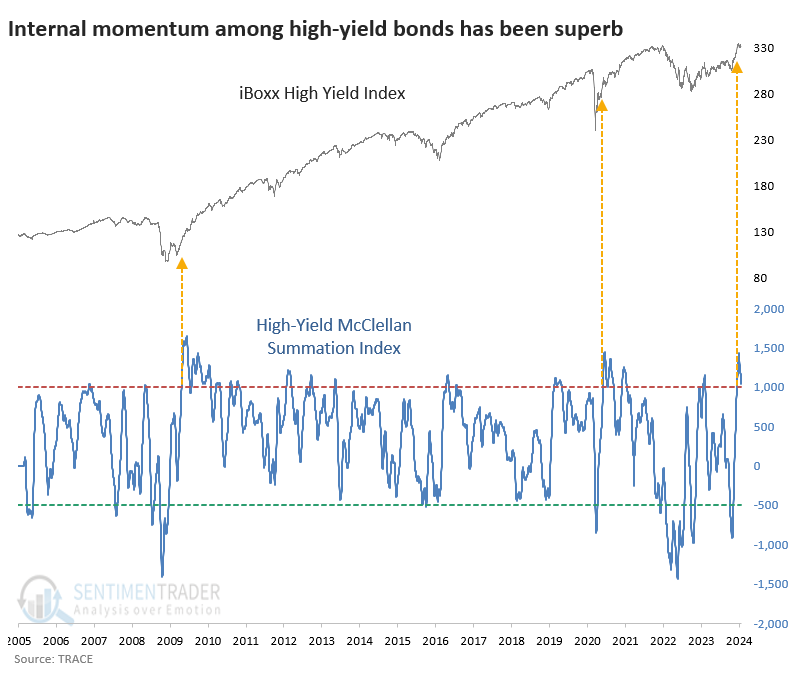
The table below shows every time when the Summation Index for high-yield bonds cycled from below -500 to above +1000. There was one clear failure in 2008 when junk bonds rolled over pretty much immediately. That has not been the case this time, which helps lessen the probability of seeing a repeat of that failure. After all the others, there was a strong tendency to see persistent gains.
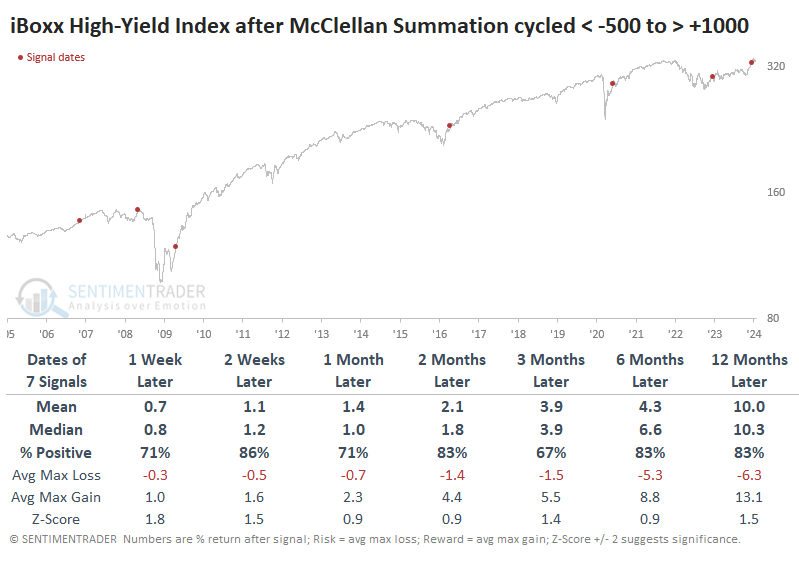
The table of maximum gains and losses across time frames shows that the December signal has closely tracked the ones from November 2006, April 2009, and April 2016. Each of those continued to rise in the months ahead with no further drawdown.
A good time for unleaded gas
Unleaded gas tends to be a highly cyclical market. Jay noted that this market is entering a typically favorable seasonal period.
The chart below displays the annual seasonal trend for unleaded gas futures (ticker RB).
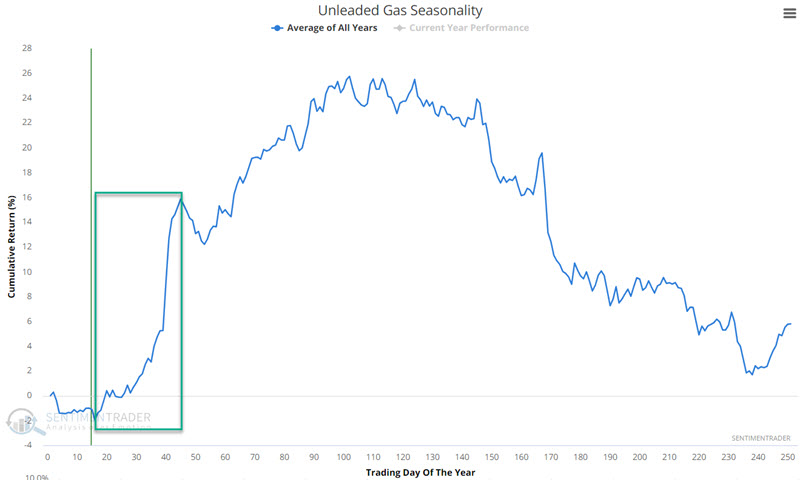
The most important thing to note is that unleaded gas is re-entering a typically favorable seasonal period. The seasonally favorable period extends from the close of Trading Day of the Year (TDY) #16 through the close of TDY #45. For 2024, this period extends from the close on 2024-01-23 through 2023-03-04.
The chart below displays the cumulative hypothetical gain from holding long one unleaded gas futures contract only during TDY #16 through TDY #45, every year since 2005 when the current configuration of RB futures started trading.
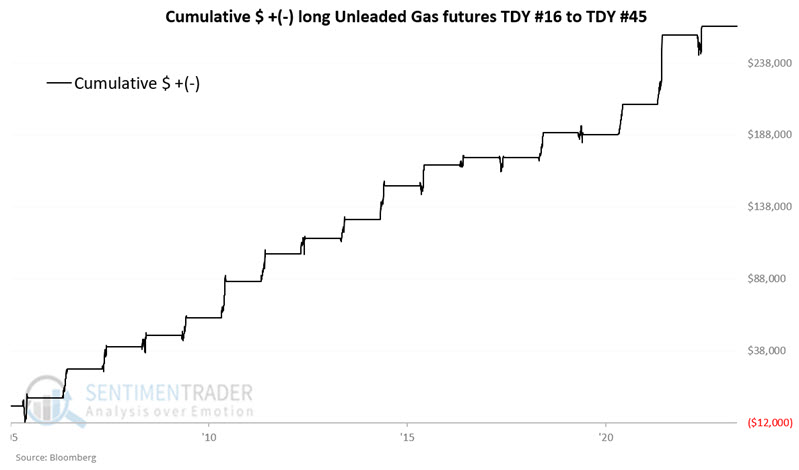
The good news is that historical results have been consistently favorable, with an 89% win rate and 12 gains of more than +$10,000 versus no losses worse than -$10,000. The bad news is that there is no guarantee that future results will be similar.
The United States Gasoline Fund® LP (UGA) is an exchange-traded security designed to track the movements of gasoline futures prices in percentage terms. UGA issues shares that may be bought and sold like stock shares. The futures contracts held by ticker UGA are based on its own prescribed roll schedule. This means that the daily percentage fluctuation in UGA may differ from those of the spot contract we used above to track RB futures directly. It has also tended to follow this seasonal pattern.
Maybe a good time for copper, too
Copper also tends to be a highly cyclical market and is considered to be highly correlated to the overall economy. Jay showed that this market is entering a typically favorable seasonal period.
That seasonally favorable period extends from the close of TDY #20 through the close of TDY #43. For 2024, this period extends from the close on 2024-01-29 through 2023-02-29.
The chart below displays the cumulative hypothetical gain from holding long one copper futures contract only during TDY #20 through TDY #43 every year since 1959.
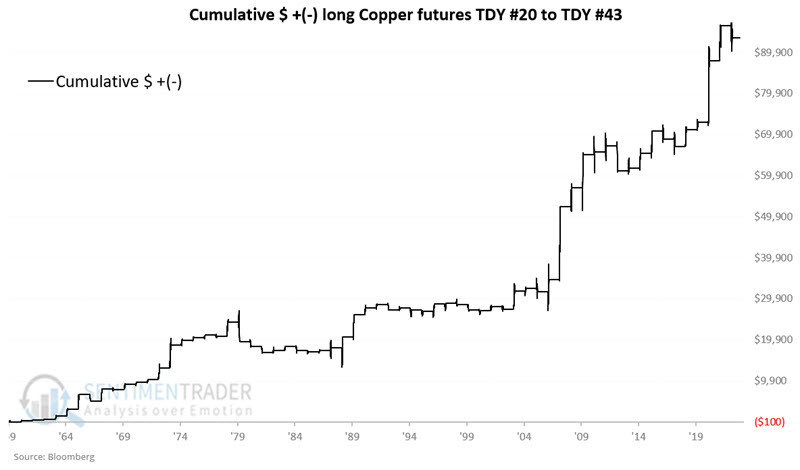
A 67% Win Rate implies that copper will lose ground during this period in one out of every three years. So this is a "tendency" and not a "sure thing." Likewise, the fact remains that copper futures are inherently quite volatile and require deep pockets (and a solid understanding of the unlimited risk inherent in futures trading) to trade.
The United States Copper Index Fund (CPER) is an exchange-traded security designed to track copper futures price movements in percentage terms. CPER issues shares that may be bought and sold like shares of stock. Volume can be relatively thin at times, although it also tends to pick up smartly when copper actually gets moving and has generally followed the same seasonal pattern.
About TradingEdge Weekly...
The goal of TradingEdge Weekly is to summarize some of the research published to SentimenTrader over the past week. Sometimes there is a lot to digest, and this summary highlights the highest conviction or most compelling ideas we discussed. This is NOT the published research; rather, it pulls out some of the most relevant parts. It includes links to the published research for convenience, and if you don't subscribe to those products, it will present the options for access.