
TradingEdge Weekly for Jan 24 - Sentiment dip and recovery, breadth records, financial surge

Key points:
- A historic drop in sentiment right before a record rebound in breadth
- Several sentiment indicators have shown sudden shifts
- Financial stocks enjoyed a breadth thrust
- Smaller stocks are still in a positive seasonal window relative to larger ones
- Several commodities and currencies are in the midst of strong seasonal windows
Sentiment dip, breadth rip
Heading into last week, the pullback in stocks clearly unnerved investors...just in time for a historic breadth surge.
Individual investors polled by AAII sharply pulled back their expectations of future gains. The Bull Ratio plunged below 40% for only the 2nd time since May 2023. These drops didn't have much impact on S&P 500 returns, though declining bullishness is generally a negative sign short-term and a positive sign long-term.
It wasn't just the hyperactive mind-changers in the AAII survey that suddenly became less optimistic. Newsletter writers surveyed by Investor's Intelligence changed their opinions much less drastically...until last week. The 15% drop in that survey's Bull Ratio was among the largest since 1969.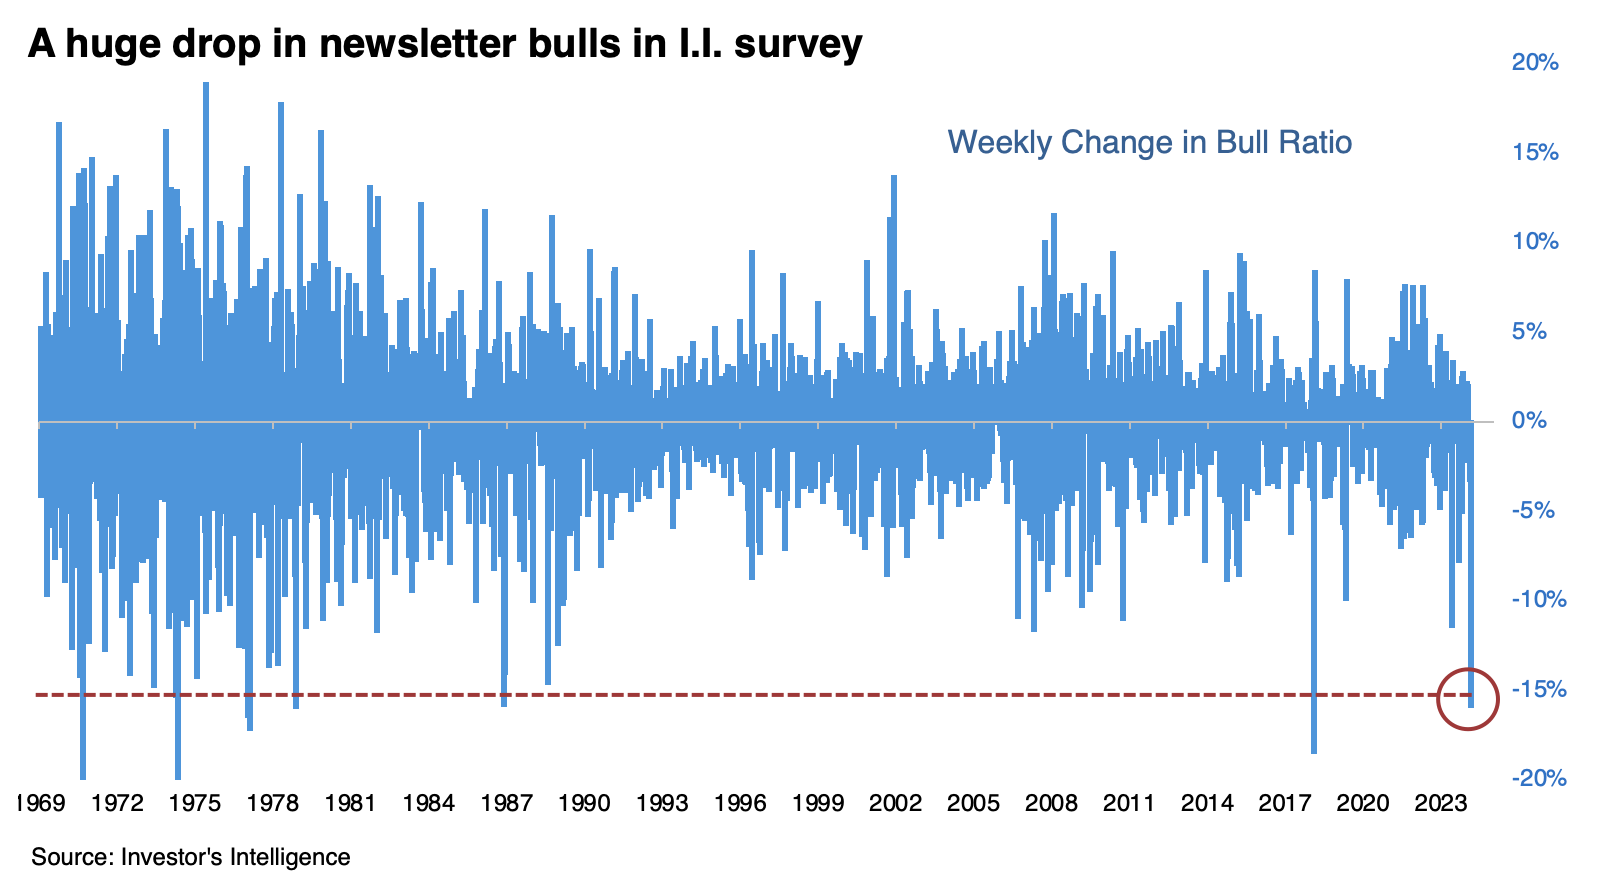
When newsletter writers' bullishness plunged so much in a week, it preceded poor short-term returns and good long-term ones. The current signal is bucking that trend. Since the sample size is small, let's look at smaller weekly declines in the I.I. Bull Ratio. The table below shows that weekly declines of -10% or more tended to show substantial gains, with only two slight declines over the following two months, which were soon reversed.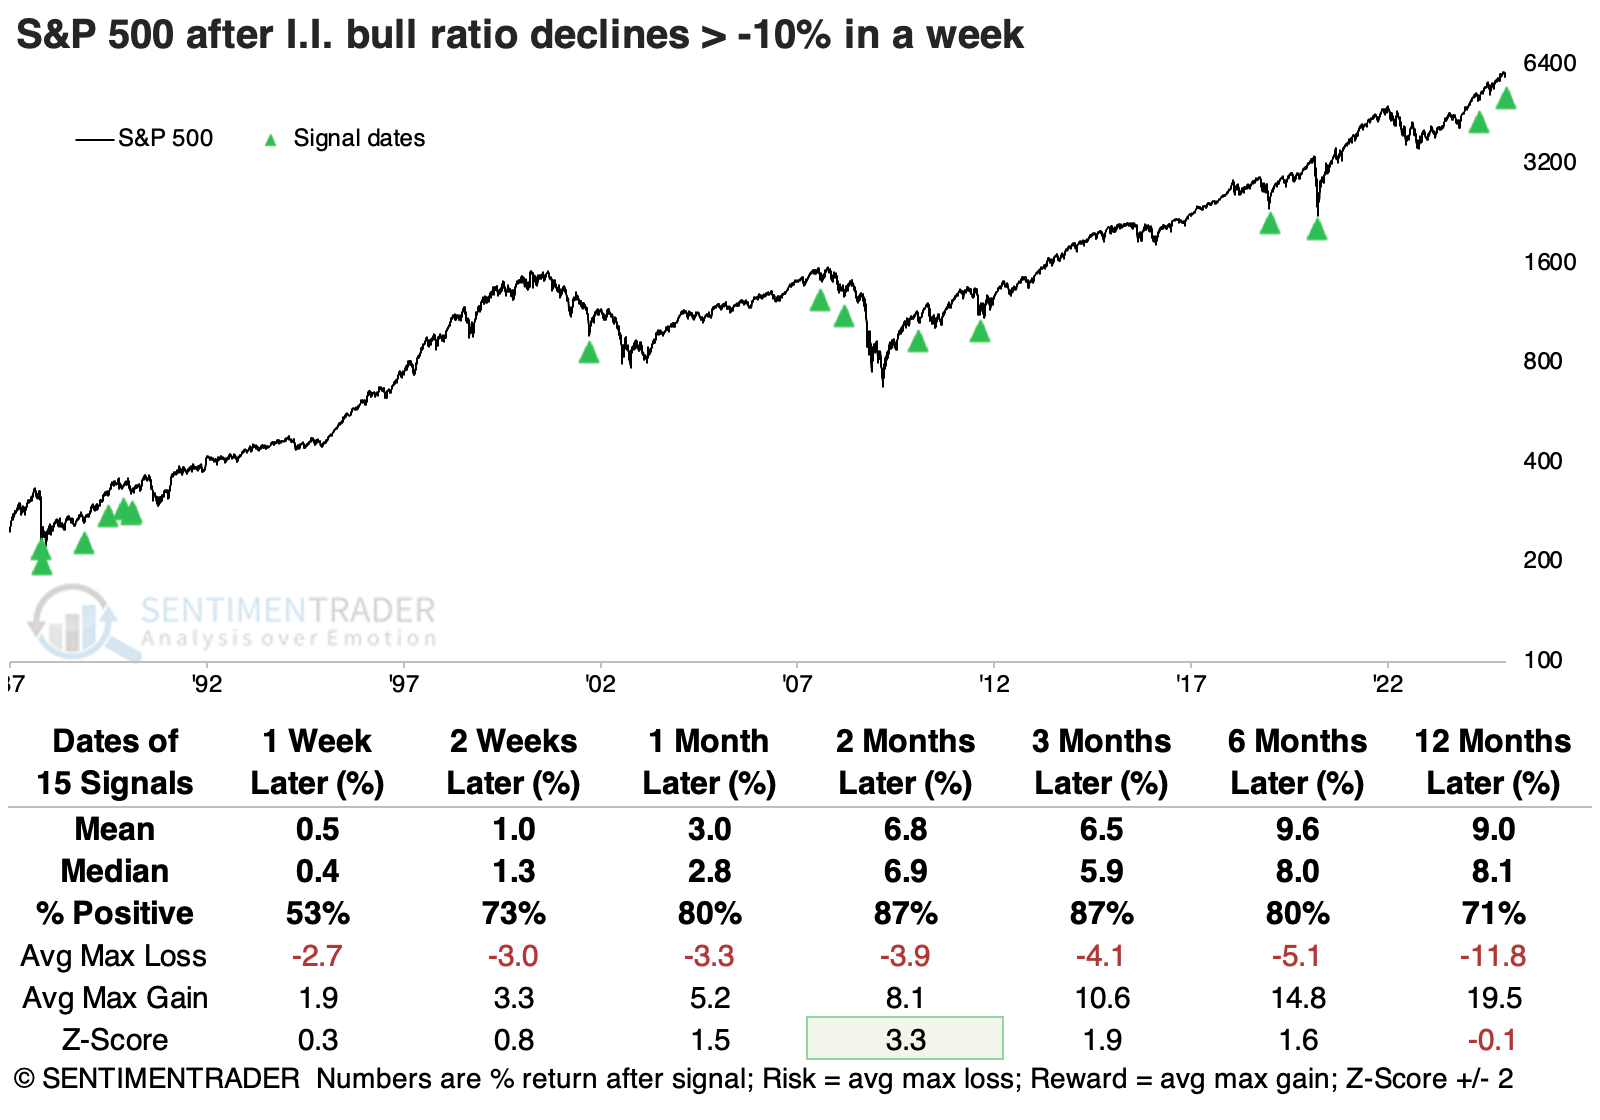
The dramatic decrease in sentiment came at the worst possible time for many of these investors. Every day during the week, at least 68% of stocks in the S&P 500 advanced. That's the first time so many stocks have advanced without a break since 2019, when it happened twice.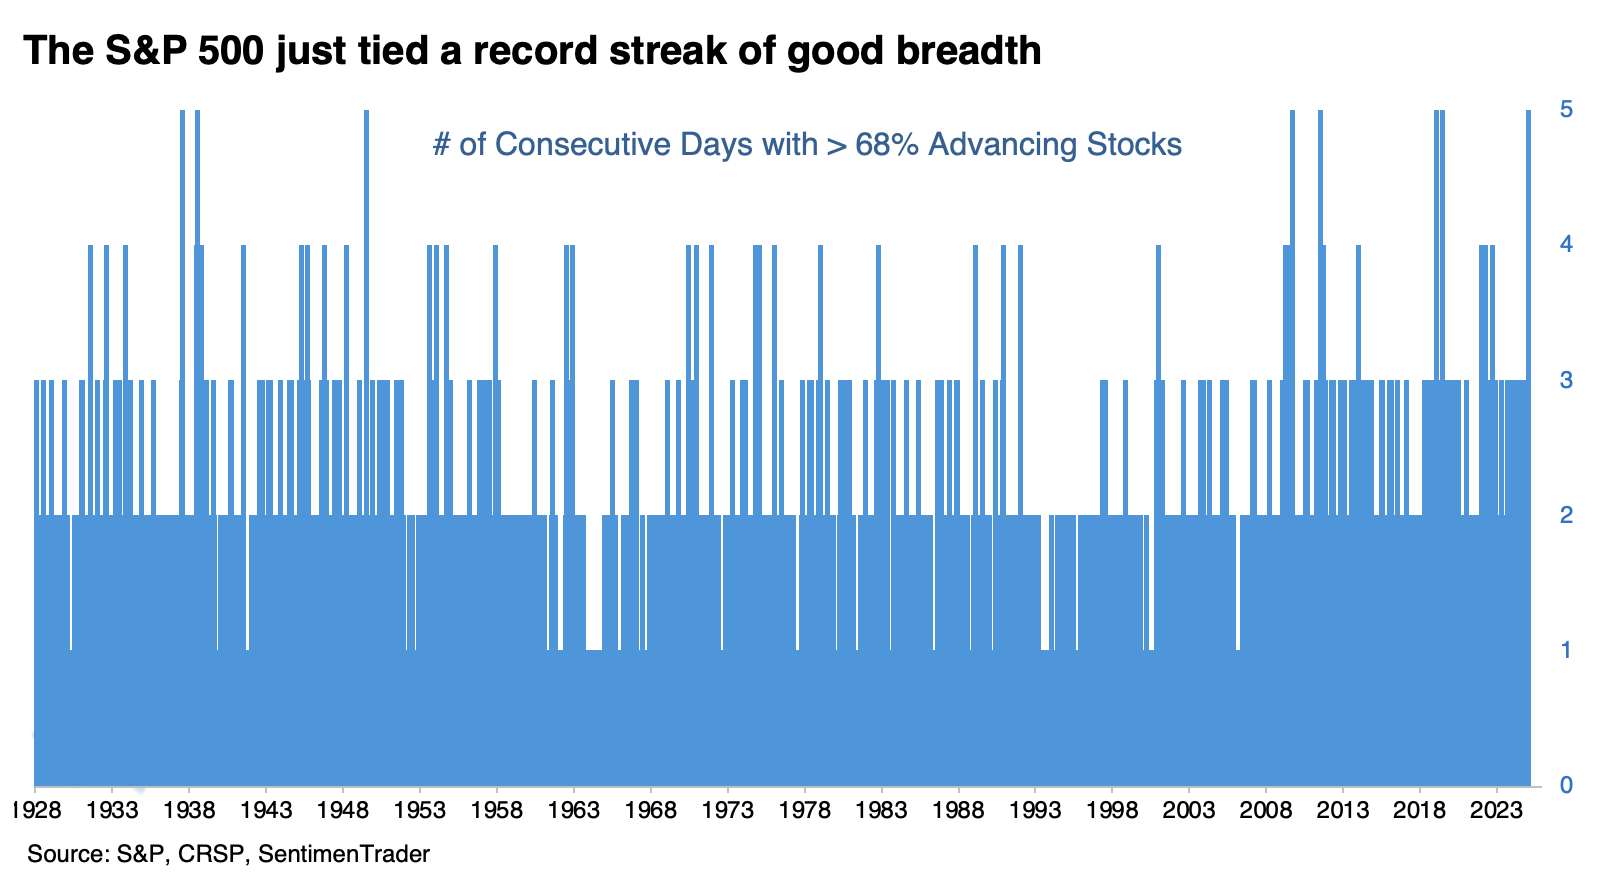
If we expand the sample size by looking for at least four consecutive days with 68% or more of stocks advancing when the S&P traded within 5% of a yearly high, we see mostly positive returns going forward. The only loss a year later was the last signal, which was terrible as it nearly coincided with the peak of the last bull market.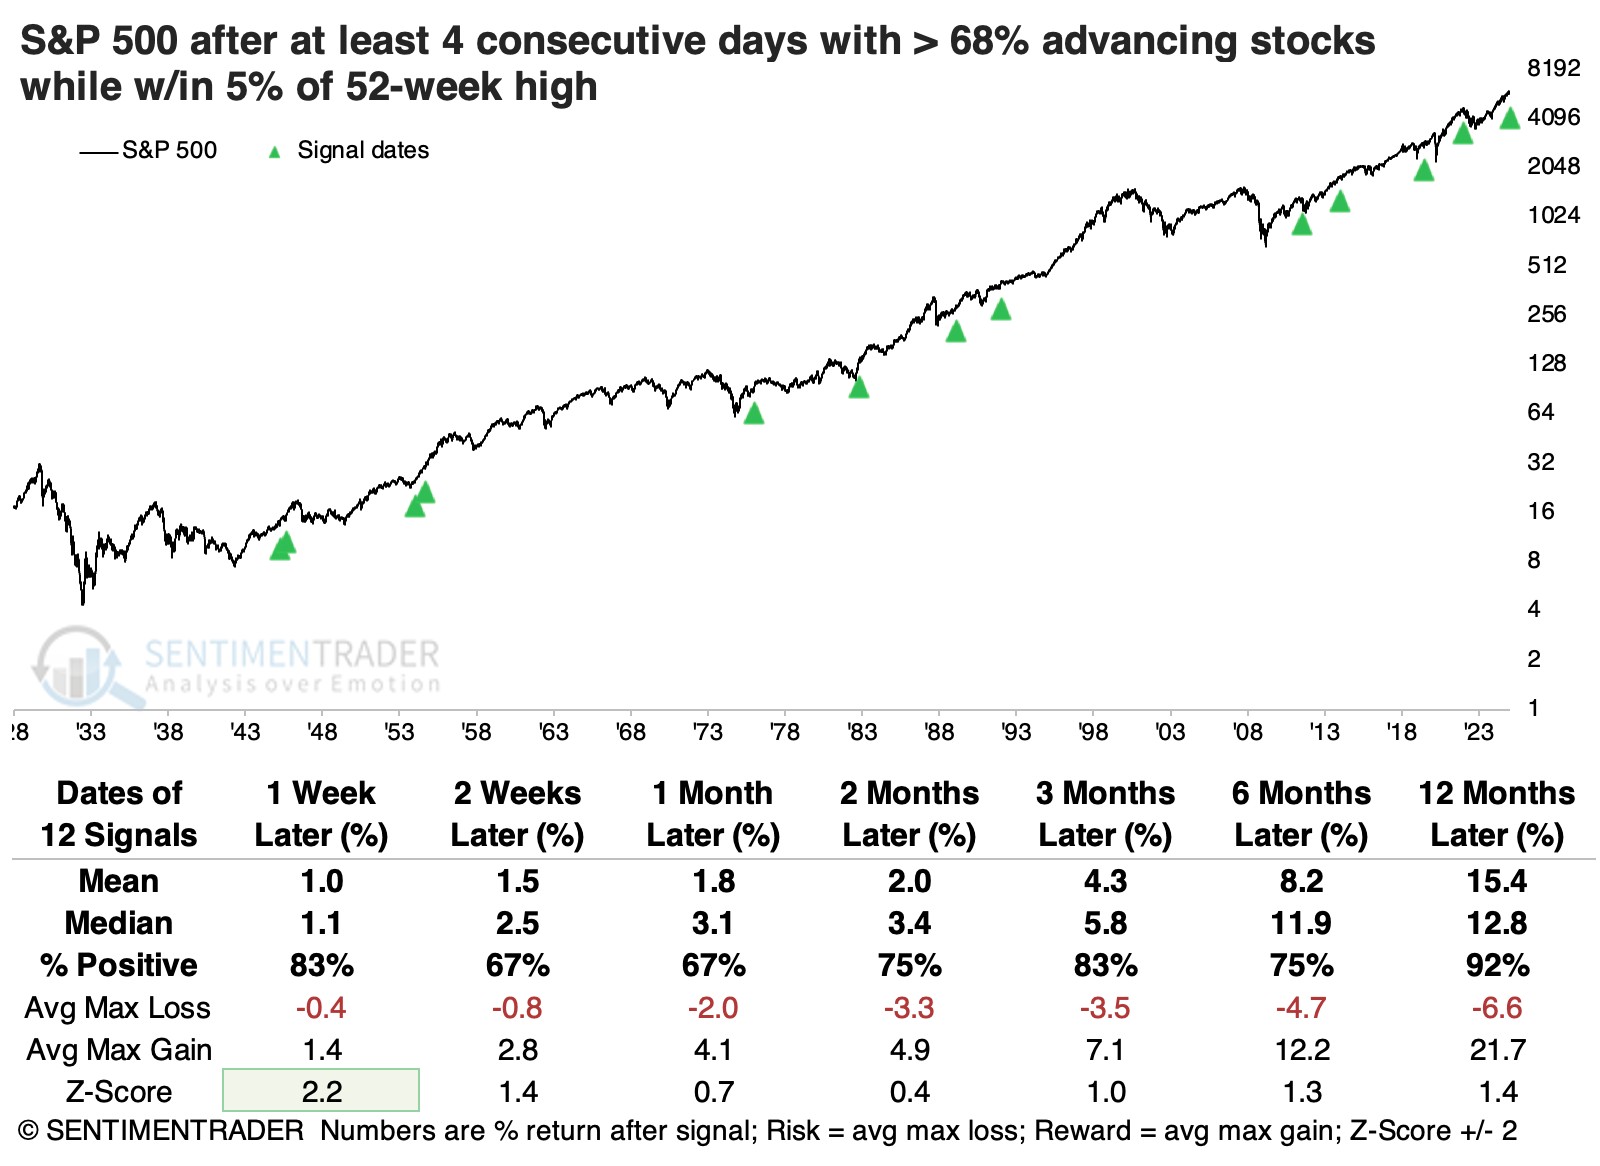
Improving sentiment after the mini-washout
The S&P 500 Liquidity Premium indicator reversed lower after a phase of market uncertainty. Dean showed that comparable shifts in this volume-based indicator produced a 91% win rate for the S&P 500 over one month. Several other sentiment indicators suggest a new bullish phase in stocks is underway.
A trading model that utilizes the S&P 500 Liquidity Premium triggered a new risk-on signal, the first since September 2024. The system generates a buy signal whenever the 84-day range rank for the SPY Liquidity Premium indicator cycles from above 99% to under 42% and index momentum is positive. Additionally, the ETF must close above its 200-day average and trade with 5% of a 2-year high for context similar to now.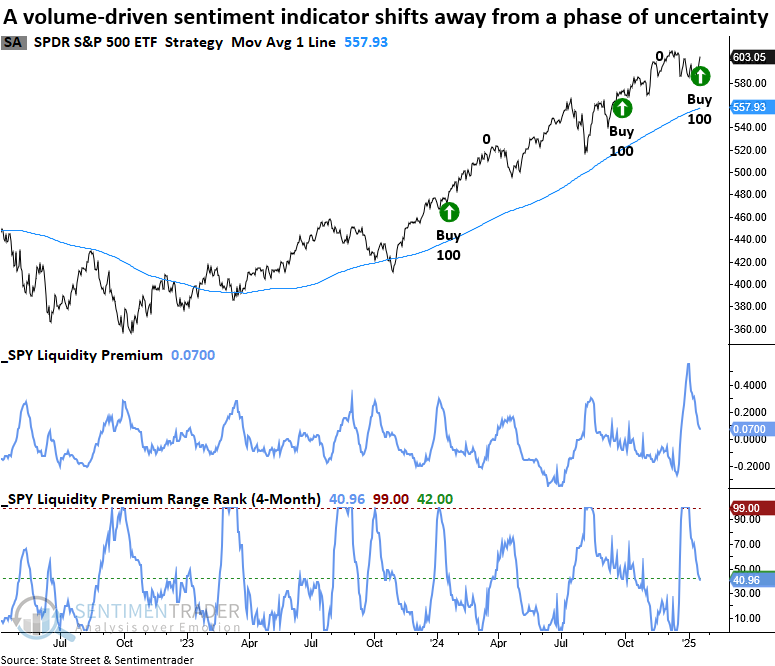
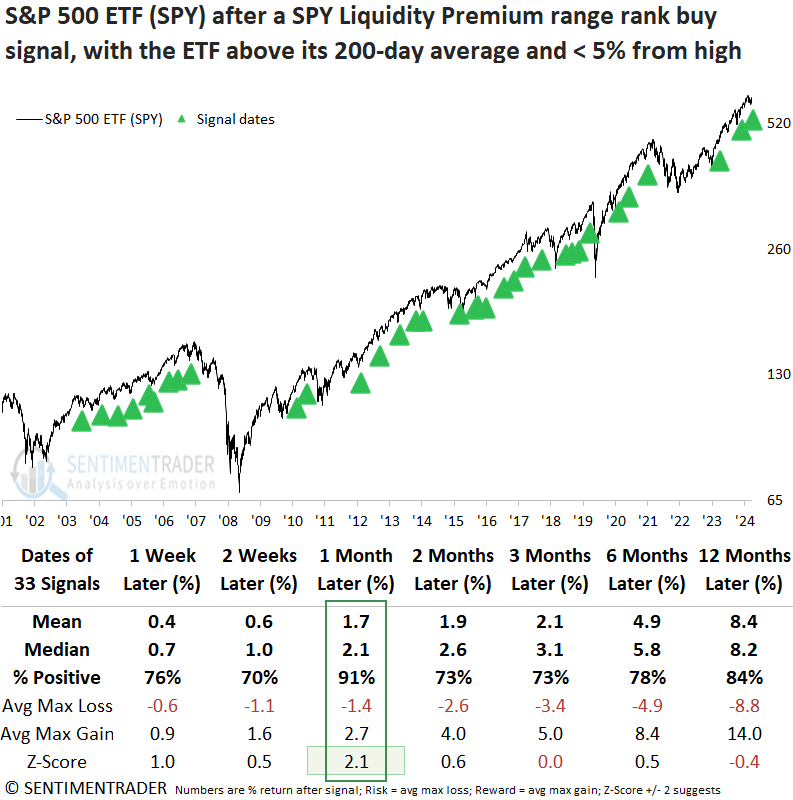
After similar signals, the S&P 500 ETF (SPY) displayed outstanding returns and consistency across all time frames. The one-month horizon was particularly bullish, rising 91% of the time, exhibiting significance relative to random returns, and recording 16 consecutive gains.
Dean also showed that following a stretch of negative sentiment, the Nasdaq 100's Optimism Index, which aggregates multiple sentiment metrics, reversed to the upside. A buy signal is generated by the Optix system whenever the 84-day range rank of the Optimism Index's 4-day average moves from below 5% to above 55%, with the same conditions as noted above.
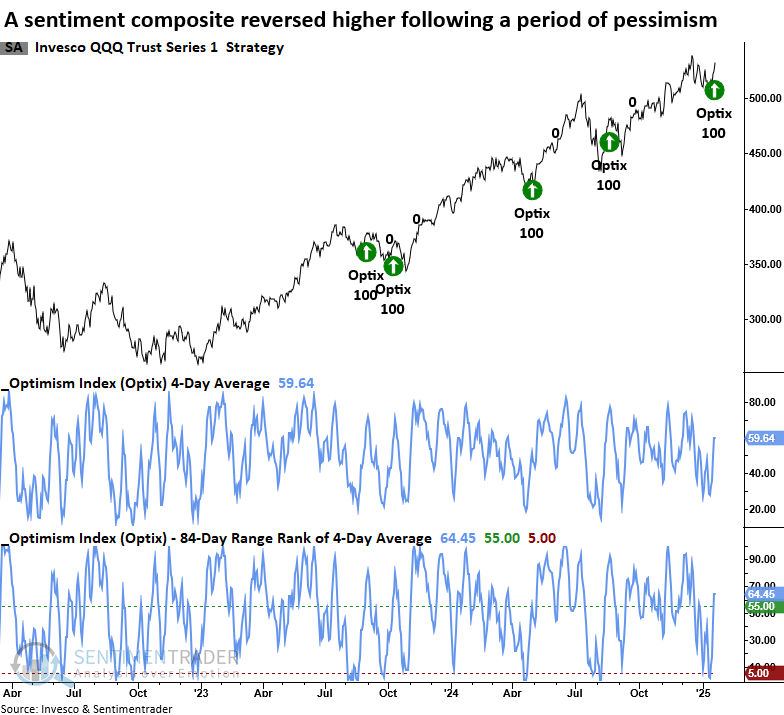
Over one- and three-month periods, the QQQ ETF advanced 89% of the time, with the three-month timeframe achieving an impressive streak of 16 consecutive gains. Furthermore, returns across the one- to twelve-month horizons exhibited statistically significant outperformance compared to random expectations.
Breadth buy signal in financials
A breadth composite for the S&P 500 Financials triggered a buy signal, indicating broad participation. Dean noted that comparable thrusts near a high produced solid returns and consistency over the next year.
Last week, he highlighted a rare breakdown reversal signal in the S&P 500 Financials sector, marking a bullish shift for the group. The breadth alert is activated when a breadth composite rises by 38% over one week. Although this signal is often observed following more significant corrections, this latest instance occurred with Financials down less than 5% below their recent high, a critical piece of context.
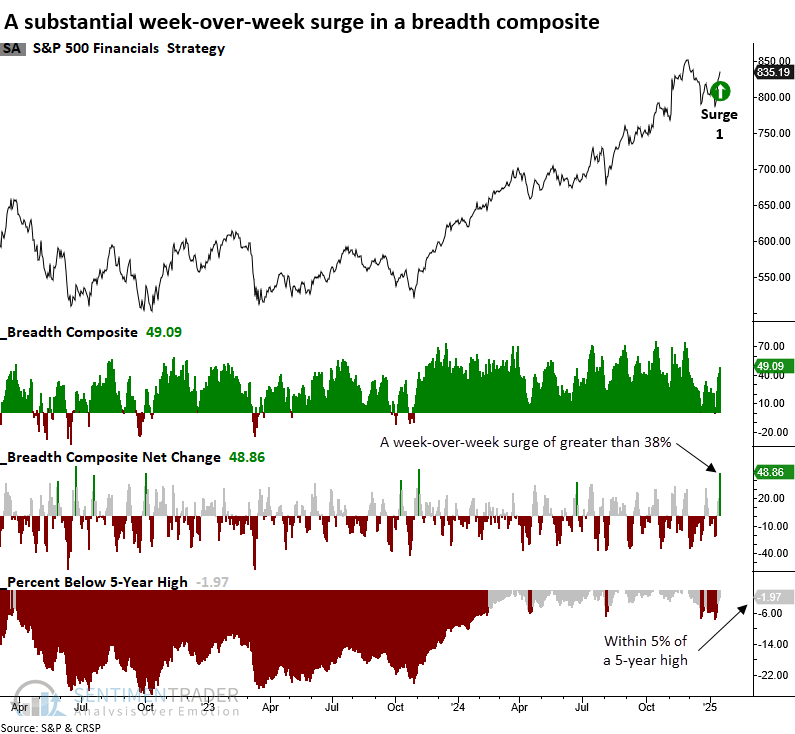
Two supplementary conditions are required in the breadth composite system. First, the composite must decline below a reading of 5%, indicative of weak breadth commonly associated with oversold conditions. The second is that the thrust signal must occur within two months of this reset to reflect precedents observed near such weak breadth scenarios.
The S&P 500 Financial sector demonstrated excellent returns and consistency over the subsequent year when the week-over-week change in its breadth composite surged above 38%, and the group was within 5% of a 5-year high.
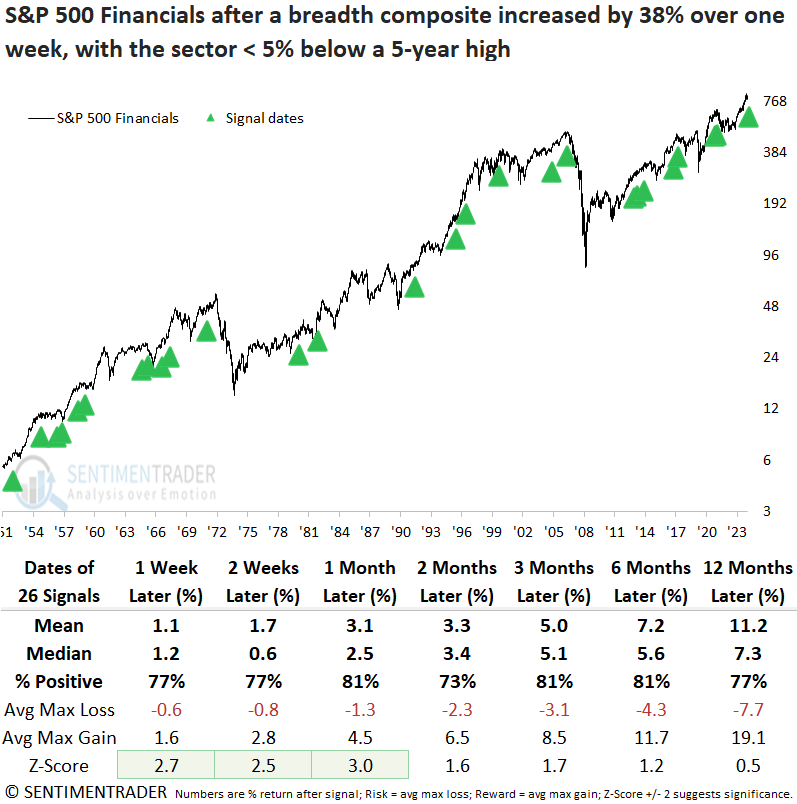
Over the subsequent two months, the S&P 500 Financials recorded three maximum losses of over 5%, with just one exceeding 10%, a rare occurrence last seen in 1957. According to the website's trend score sector summary page, the S&P 500 Financial sector boasts the second-highest percentage of stocks with a trend and relative trend score of eight or higher, narrowly outpaced by Communication Services.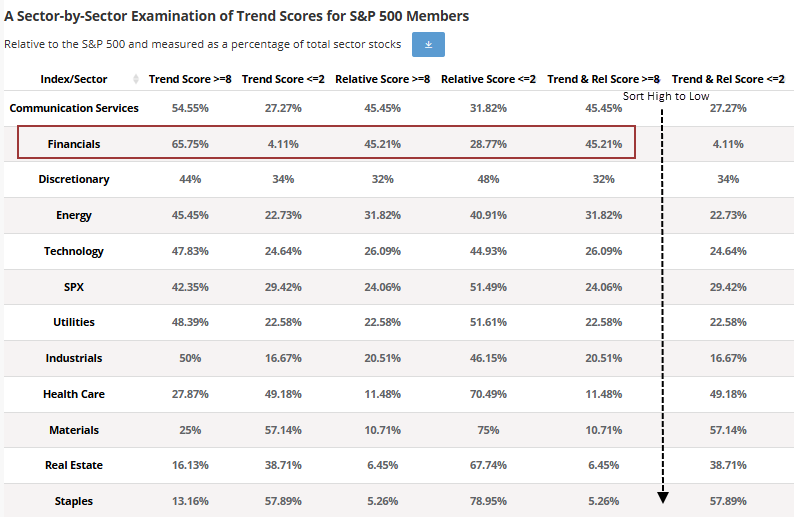
Seasonal small caps
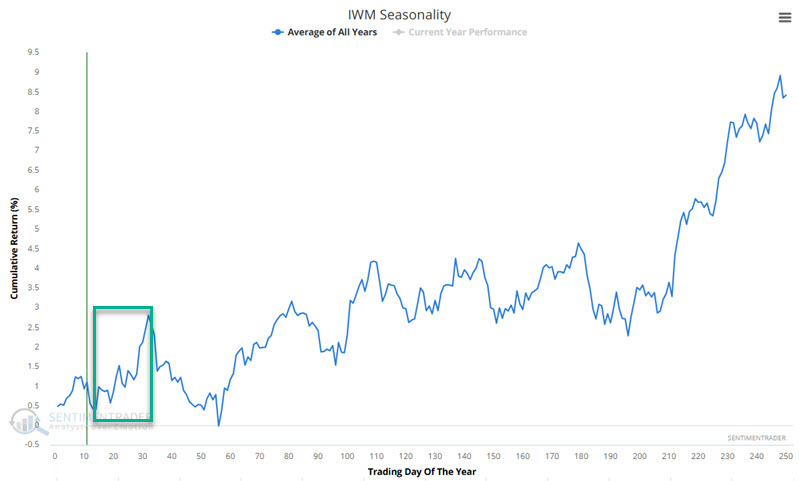
Jay highlighted the fact that small-caps have a historical tendency to outperform from mid-December into mid-February of the following year, so seasonality still favors small-caps in the weeks directly ahead.
The chart below displays the annual seasonal trend for ticker IWM. The period from Trading Day of the Year #14 through TDY #32 is highlighted. For 2025, this period extends from the close on 2025-01-23 through 2025-02-19.
The chart below displays the hypothetical growth of $1 invested in the S&P 600 Small-Cap Index during the TDY #14 through TDY #32 period every year since 1953. It turned into $5 during that stretch, with relatively minor drawdowns.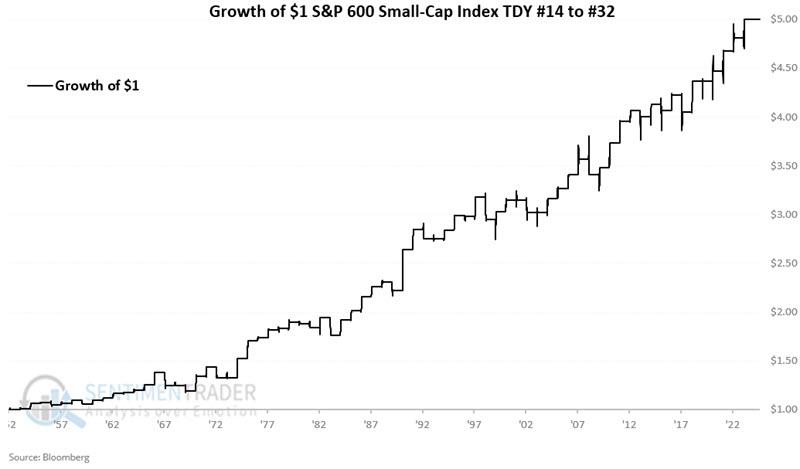
The chart below displays the growth of $1 invested in the S&P 500 Small-Cap Index and the S&P 500 Large-Cap Index. The better growth in smaller stocks is clear from their divergent equity curves.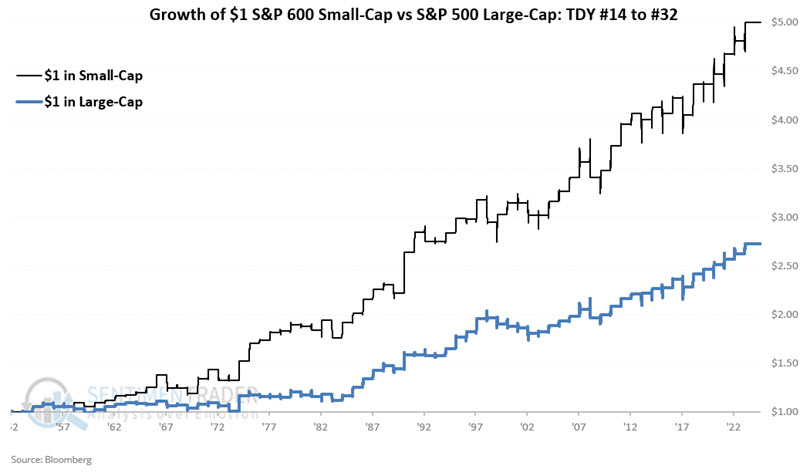
Seasonal stretches in commodities, too
Jay further noted that many commodities have strong seasonal tendencies for the coming weeks.
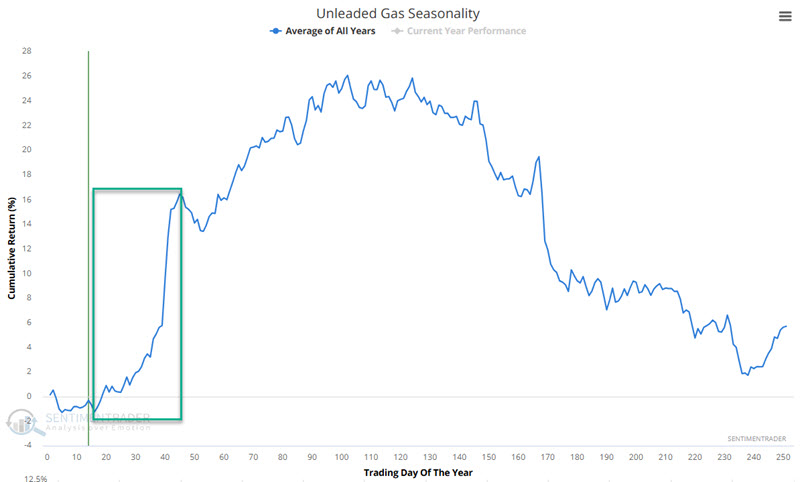
The chart below displays the annual seasonal trend for unleaded gas futures. A favorable period runs from Trading Day of Year (TDY) #16 through #45. For 2025, that period extends from the close on 2025-01-23 Through 2025-03-05.
The chart below displays the hypothetical growth of $1 based on percentage price movements for unleaded gas futures during the TDY #16 through TDY #45 period every year starting in 2006.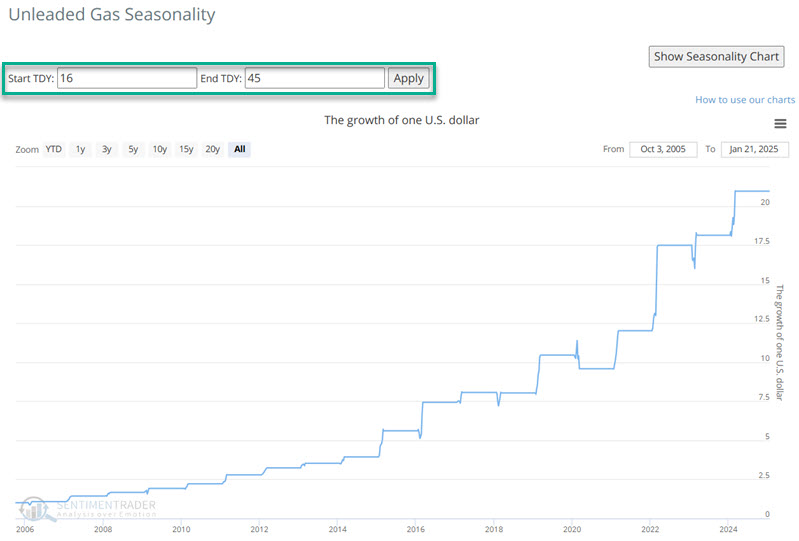
Soybeans have a history of being one of the most reliable seasonal markets. A favorable period runs from Trading Day of Year (TDY) #19 through #58. For 2025, that period extends from the close on 2025-01-30 Through 2025-03-27. The chart below displays the hypothetical growth of $1 during this seasonal window starting in 1985.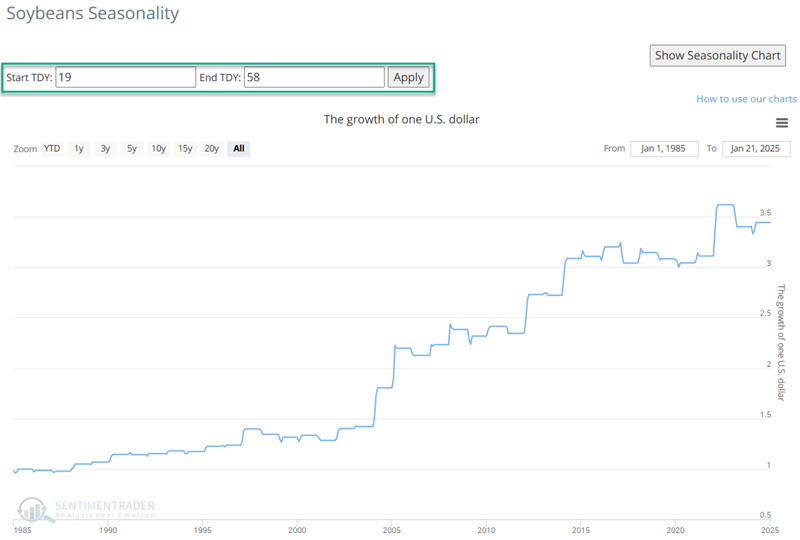
Jay further noted that copper and palladium are in positive seasonal windows, while the euro and British pound are definitely not.
About TradingEdge Weekly...
The goal of TradingEdge Weekly is to summarize some of the research published to SentimenTrader over the past week. Sometimes there is a lot to digest, and this summary highlights the highest conviction or most compelling ideas we discussed. This is NOT the published research; rather, it pulls out some of the most relevant parts. It includes links to the published research for convenience, and if you don't subscribe to those products, it will present the options for access.